How to Trade Honeywell After Q3 2025 Performance

Founded in 1906 and headquartered in Charlotte, North Carolina, Honeywell International Inc. (NASDAQ: HON) is a technology and manufacturing company that touches many aspects of everyday life. From aerospace and building technologies to advanced materials and industrial automation, its products and solutions power industries like aviation, energy, and manufacturing around the world.
In its latest earnings, Honeywell reported results for the third quarter of 2025. Below, we’ll take a closer look at the figures and examine how analysts view the company’s outlook.
This material is for informational purposes only and not financial advice. Consult a financial advisor before making investment decisions.
- The Invest.MT5 account allows you to buy real stocks and shares from some of the largest stock exchanges in the world.
- Risk Warning: Past performance is not a reliable indicator of future results or future performance. All trading is high risk, and you can lose more than you risk on a trade. Never invest more than you can afford to lose as some trades will lose and some trades will win. Start small to understand your own risk tolerance levels or practice on a demo account first to build your knowledge before investing.
- Trading is not suitable for everyone. Trading is highly speculative and carries a significant risk of loss. While it offers potential opportunities, it also involves high volatility, and leveraged trading can amplify both gains and losses. Retail investors should fully understand these risks before trading.

Honeywell Q3 2025 Performance Summary
Key Takeaways
- Reported sales reached $10.4 billion, up 7% year-on-year (YoY), while organic sales rose 6%, led by strong gains in commercial aftermarket and defence.
- Adjusted EPS stood at $2.82.
- Operating cash flow increased 65% YoY to $3.3 billion, and free cash flow stood at $1.5 billion, down 16% YoY.
Segment performance:
- Aerospace Technologies: Organic sales increased 12% YoY, driven by the commercial aftermarket and defence & space, helped by smoother supply chains and stronger shipment volumes.
- Industrial Automation: Organic sales rose 1% YoY, driven by steady demand across segments, though softness in Europe weighed on overall growth.
- Building Automation: Organic sales rose 7% YoY, driven by growth in building solutions and building products, with particularly strong demand in North America and the Middle East.
- Energy & Sustainability Solutions: Organic sales declined 2% YoY. Advanced materials grew 5% on strong refrigerants demand, while Universal Oil Products (Honeywell UOP division) fell 13% due to anticipated licensing delays and lower catalyst shipments.
Honeywell has finalised the spin-off of its Performance Materials division, which will begin operating independently as Solstice Advanced Materials. The spin-off is set for completion on 30 October 2025.
Once the spin-off takes effect, Solstice will no longer be part of Honeywell’s consolidated results. As a result, management expects a modest decline in the company’s reported figures for the year, with sales projected to fall by $0.7 billion, adjusted earnings per share dipping by $0.21, and free cash flow easing by $0.2 billion.
Source: Honeywell Quarterly Earnings Report
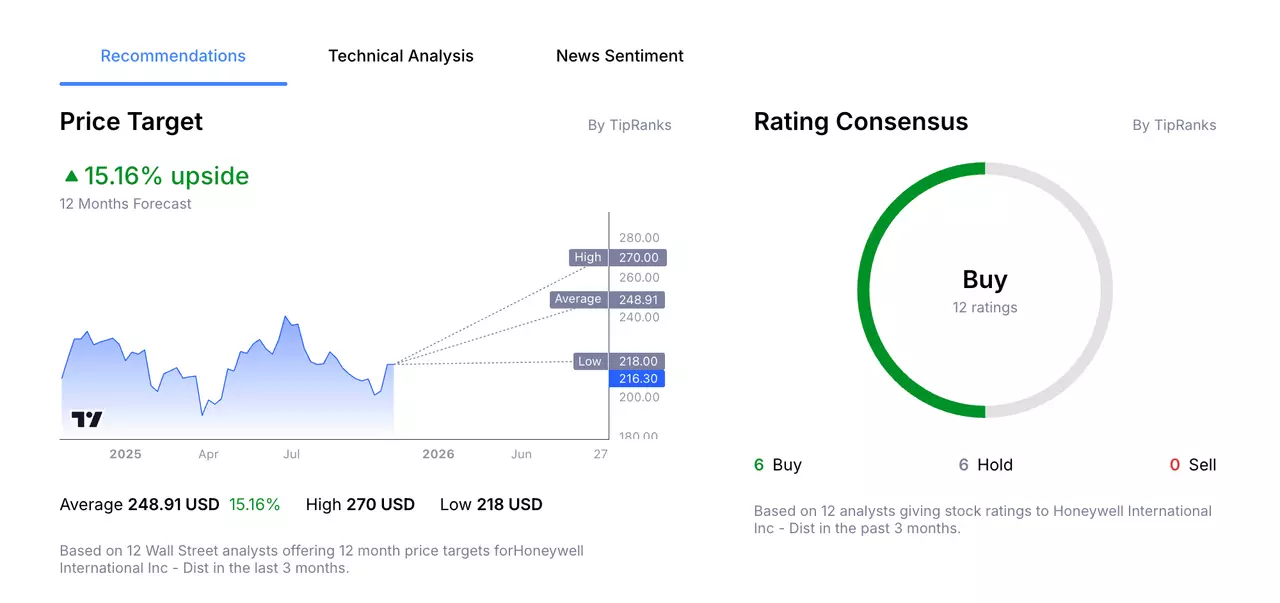
Honeywell 12-Month Analyst Stock Price Forecast
According to 12 Wall Street analysts, polled by TipRanks, offering a 12-month stock price forecast for Honeywell over the past 3 months:
- Buy Ratings: 6
- Hold Ratings: 6
- Sell Ratings: 0
- Average Price Target: $248.91
- High Price Target: $270
- Low Price Target: $218
Trading Strategy Example: Honeywell
The following trading examples are for educational purposes only and do not constitute investment advice. Investors should conduct independent research before making trading decisions. An example trading idea for the Honeywell share price could be as follows:
Remember that markets are volatile, and Honeywell’s stock price will fluctuate and may even trend lower. The company delivered a solid Q3, but several headwinds persist, including inflation and project-mix pressures that may weigh on margins. The company raised its full-year guidance, noting that the upcoming Solstice Advanced Materials spin-off will slightly reduce reported sales and EPS. Even as the stock trades near all-time highs, it could face short-term pullbacks as investors may react to near-term dynamics.
How to Buy Honeywell Stock in 4 Steps
- Open an account with Admirals and complete the onboarding process to access the dashboard.
- Click on Trade or Invest on one of your live or demo accounts to open the web platform.
- Search for your stock in the search window at the top.
- Input your entry, stop-loss and take profit levels in the trading ticket.

Do You See the Honeywell Stock Price Moving Differently?
If you believe there is a higher chance the share price of Honeywell will move lower, then you can also trade short using CFDs (Contracts for Difference). However, these have higher associated risks and are not suitable for all investors. Learn more about CFDs in this How to Trade CFDs article.
The given data provides additional information regarding all analysis, estimates, prognosis, forecasts, market reviews, weekly outlooks or other similar assessments or information (hereinafter “Analysis”) published on the websites of Admirals investment firms operating under the Admirals trademark (hereinafter “Admirals”) Before making any investment decisions please pay close attention to the following:
- This is a marketing communication. The content is published for informative purposes only and is in no way to be construed as investment advice or recommendation. It has not been prepared in accordance with legal requirements designed to promote the independence of investment research, and that it is not subject to any prohibition on dealing ahead of the dissemination of investment research.
- Any investment decision is made by each client alone whereas Admirals shall not be responsible for any loss or damage arising from any such decision, whether or not based on the content.
- With view to protecting the interests of our clients and the objectivity of the Analysis, Admirals has established relevant internal procedures for prevention and management of conflicts of interest.
- The Analysis is prepared by an analyst (hereinafter “Author”). The Author Roberto Rivero is a contractor for Admirals. This content is a marketing communication and does not constitute independent financial research.
- Whilst every reasonable effort is taken to ensure that all sources of the content are reliable and that all information is presented, as much as possible, in an understandable, timely, precise and complete manner, Admirals does not guarantee the accuracy or completeness of any information contained within the Analysis.
- Any kind of past or modelled performance of financial instruments indicated within the content should not be construed as an express or implied promise, guarantee or implication by Admirals for any future performance. The value of the financial instrument may both increase and decrease and the preservation of the asset value is not guaranteed.
- Leveraged products (including contracts for difference) are speculative in nature and may result in losses or profit. Before you start trading, please ensure that you fully understand the risks involved.

