How to Trade Carnival After Fiscal Q2 Earnings

Carnival Corporation is the world’s largest cruise company by revenue, operating a fleet of more than 90 vessels across eight different brands. Last week, the cruise line reported mixed earnings for its fiscal second quarter.
Whilst it broke a number of Q2 records and beat expectations on the bottom line, Carnival’s guidance fell short, leading to a significant decline in share price. Keep reading to learn more about the results and what analysts are forecasting for the stock.
The information in this article is provided for educational purposes only and does not constitute financial advice. Consult a financial advisor before making investment decisions.
- The Invest.MT5 Account allows you to buy real stocks and shares from some of the largest stock exchanges in the world.
- Risk Warning: Past performance is not a reliable indicator of future results or future performance. All trading is high risk, and you can lose more than you risk on a trade. Never invest more than you can afford to lose as some trades will lose and some trades will win. Start small to understand your own risk tolerance levels or practice on a demo account first to build your knowledge before investing.
- Trading is not suitable for everyone. Trading is highly speculative and carries a significant risk of loss. While it offers potential opportunities, it also involves high volatility, and leveraged trading can amplify both gains and losses. Retail investors should fully understand these risks before trading.

Carnival Fiscal Q2 Earnings Performance Summary
Key Takeaways
- Quarterly revenue rose a modest 5% year on year to $6.66 billion. Whilst this was slightly short of analyst expectations, it was a Q2 record.
- Adjusted net income rose more than 20% to a Q2 record of $569 million, despite a 30% jump in fuel costs.
- Demand for the remainder of the year looks strong. Customer deposits hit an all-time high of $9 billion, up $450 million compared to the prior year record. Carnival also stated that it’s now “93 percent booked for the year with less inventory remaining for sale than this time last year”.
-
- The positive demand outlook was somewhat tempered by the news that tensions in the Middle East had impacted booking trends in European deployments, particularly in the Mediterranean region.
-
- Carnival announced it had repurchased more than $450 million of stock to date under its current share buyback programme, which was launched in April. It also distributed a total of $207 million in dividends during the quarter ($0.15 per share), taking its year-to-date total to $414 million ($0.30 per share).
- However, forward guidance fell short of expectations, which sparked a sell-off in the session following the announcement.
-
- For the third quarter - the summer season, which typically produces the most profit - Carnival expects adjusted EPS of $1.35, considerably below the consensus of $1.42.
- For the full fiscal year, it guided for adjusted EPS of $2.22, just below the consensus of $2.23.
-
Carnival’s 12-Month Analyst Stock Price Forecast
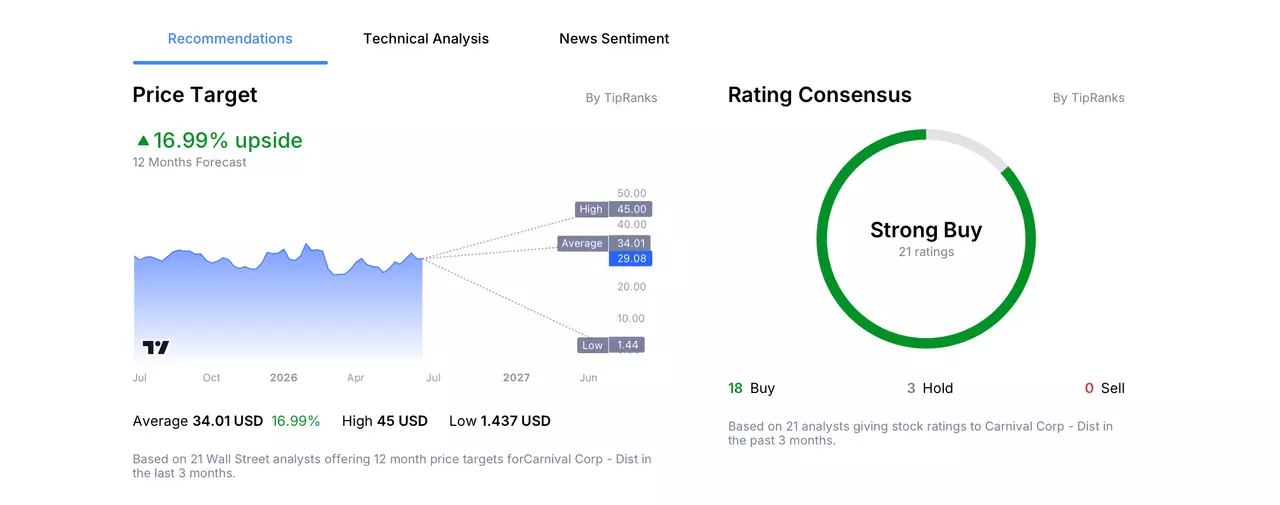
According to 21 Wall Street analysts, polled by TipRanks, offering a 12-month stock price forecast for Carnival over the past 3 months:
- Buy Ratings: 18
- Hold Ratings: 3
- Sell Ratings: 0
- Average Price Target: $34.01
- High Price Target: $45.00
- Low Price Target: $1.44
Trading Strategy Example: Carnival Corp.
The following trading examples are for educational purposes only and do not constitute investment advice. Investors should conduct independent research before making trading decisions. An example trading idea for Carnival could be as follows:
Carnival’s recent performance serves as a reminder that markets can be volatile. Following its Q2 results, share price fell as the market reacted negatively to weak guidance, and further declines should not be ruled out.
Carnival’s immediate outlook partly hinges on developments in the Middle East. Oil prices have eased significantly after diplomatic progress led to the US and Iran recently signing a memorandum of understanding. However, tensions remain elevated, with the ceasefire coming under pressure over the weekend as the two sides exchanged strikes. Any escalation could result in another jump in oil prices, as well as potentially impact Carnival’s future bookings.
Furthermore, recent spikes in inflation may take time to cool down. Even with global oil prices falling, this is likely to take time to filter through to consumer prices. Higher inflation combined with high interest rates, which are now expected to rise in the US before the end of the year, may weigh on consumer spending. A prolonged dip in spending could impact Carnival, as cruises are exactly the type of expenditure which consumers tend to cut back on in these circumstances.
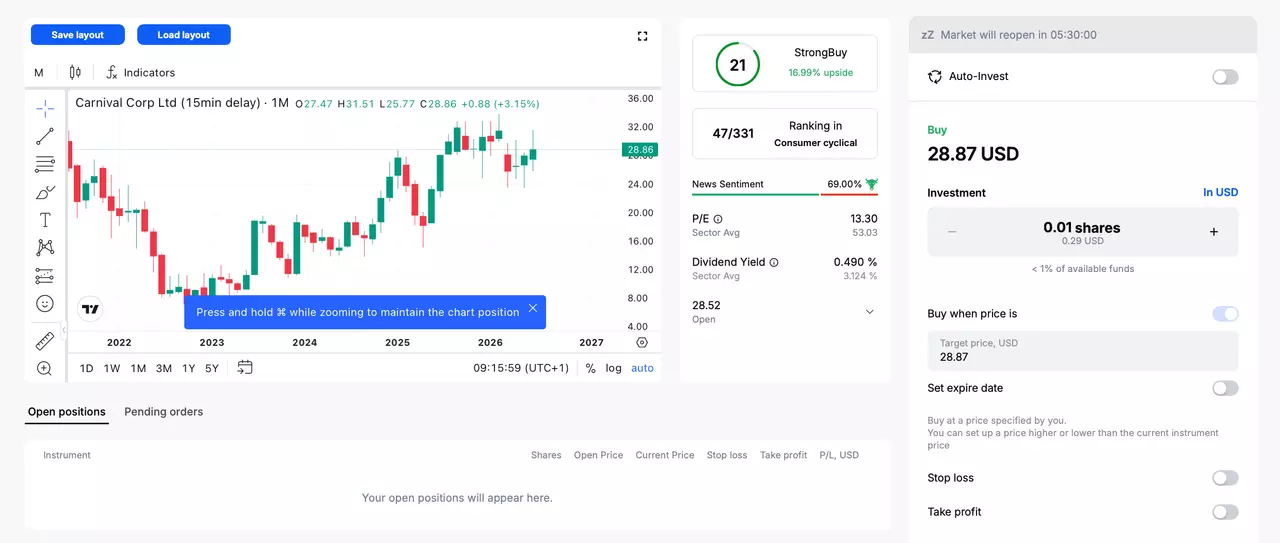
How to Buy Carnival Stock in 4 Steps
- Open an account with Admirals and complete the onboarding process to access the dashboard.
- Click on Trade or Invest on one of your live or demo accounts to open the Admirals Platform.
- Search for your stock in the search window at the top.
- Input your entry, stop-loss and take profit levels in the trading ticket.

Do You See the Carnival Stock Price Moving Differently?
If you believe there is a higher chance that the share price of Carnival will move lower, then you can also trade short using CFDs (Contracts for Difference). However, these have higher associated risks and are not suitable for all investors. Learn more about CFDs in this How to Trade CFDs article.
The given data provides additional information regarding all analysis, estimates, prognosis, forecasts, market reviews, weekly outlooks or other similar assessments or information (hereinafter “Analysis”) published on the websites of Admirals investment firms operating under the Admirals trademark (hereinafter “Admirals”) Before making any investment decisions please pay close attention to the following: