How to Trade Babcock International After FY26 Earnings


Babcock International Group is a UK defence company which operates across four segments: Marine, Nuclear, Land and Aviation.
Babcock shares have benefitted from increased military spending in recent years, helping the stock reclaim its place in the FTSE 100 after a seven-year absence. However, in 2026, its share price has come under pressure.
At the end of June, Babcock reported results for the year ended 31 March 2026. The main headline was negative, but this overshadowed an underlying performance that otherwise looked healthy. Keep reading to find out more and to learn what analysts are forecasting for the stock.
The information in this article is provided for educational purposes only and does not constitute financial advice. Consult a financial advisor before making investment decisions.
- The Invest.MT5 Account allows you to buy real stocks and shares from some of the largest stock exchanges in the world.
- Risk Warning: Past performance is not a reliable indicator of future results or future performance. All trading is high risk, and you can lose more than you risk on a trade. Never invest more than you can afford to lose as some trades will lose and some trades will win. Start small to understand your own risk tolerance levels or practice on a demo account first to build your knowledge before investing.
- Trading is not suitable for everyone. Trading is highly speculative and carries a significant risk of loss. While it offers potential opportunities, it also involves high volatility, and leveraged trading can amplify both gains and losses. Retail investors should fully understand these risks before trading.

Babcock Full-Year Earnings Summary
- Revenue rose 7% to £5,177.7 million, driven by strong growth in the group’s Nuclear and Aviation segments.
- Nuclear revenue, which accounted for approximately 40% of the group’s total, increased 14%. Whilst Defence accounts for the vast majority of Babcock’s Nuclear division, the group highlighted the UK’s civil nuclear renaissance as a significant addressable opportunity for the civil side of its business.
- Its results were partly offset by a non-recurring £140 million charge against its Type 31 frigate programme with the UK’s Ministry of Defence. Under the fixed-price contract, Babcock bears responsibility for any cost overruns, which is what happened here. The charge resulted from “higher than expected levels of rework as a result of changes to the design”, which were “more complex and more costly” because they were carried out at a later stage of construction. It had already disclosed the charge in a trading update on 13 May.
- As a direct result of the Type 31 charge, underlying operating profit sank 19% to £293.3 million. However, excluding the charge, underlying operating profit rose 19% to £433.3 million.
- Underlying earnings per share (EPS) dropped 21% to 39.6p; however, excluding the Type 31 charge, underlying EPS jumped 20% to 60.5p.
- Its contract backlog stood at £9.8 billion on 31 March 2026, slightly down from the £10.4 billion a year earlier. Recent wins include a contract to deliver 270 Light Utility Vehicles for the British Army, and Babcock’s first defence contract in South Africa, for submarine support.
- Net debt fell to £329 million, down from £373 million a year previously.
- Its full-year dividend per share rose to 7.5p, up from 6.5p in FY25.
- In April 2026, Babcock completed a £200 million share buyback and subsequently announced a further £200 million buyback for FY27.
- The group reiterated its medium-term guidance of mid-single digit organic revenue growth and underlying operating margin of at least 9%.
Source: Babcock - Full-Year Results for the Year Ended 31 March 2026
Babcock’s 12-Month Analyst Stock Price Forecast
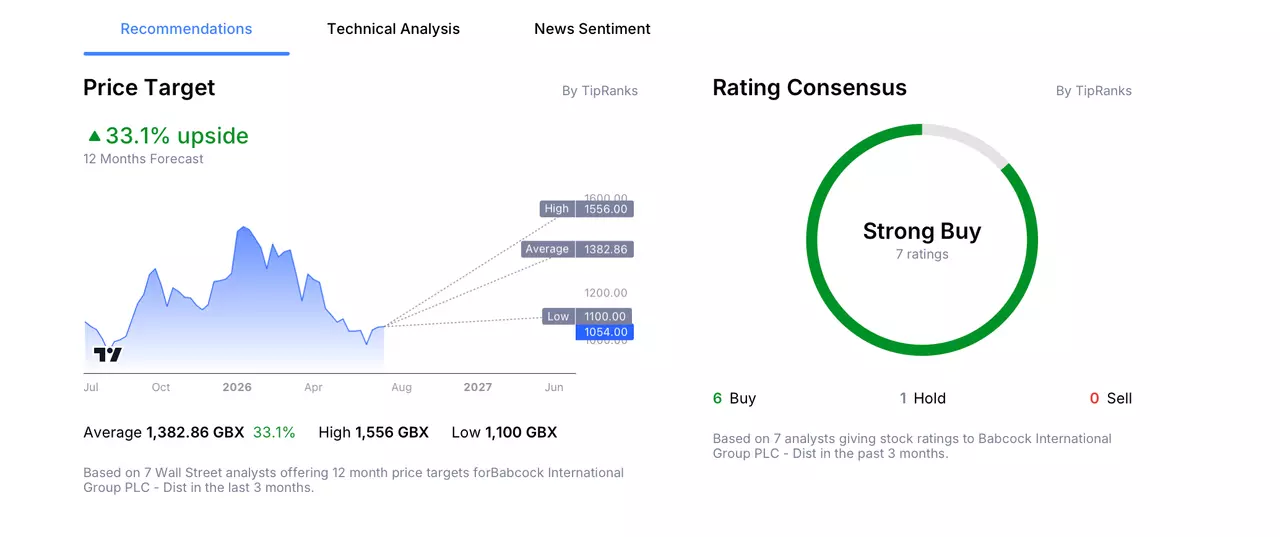
According to 7 Wall Street analysts, polled by TipRanks, offering a 12-month stock price forecast for Babcock over the past 3 months:
- Buy Ratings: 6
- Hold Ratings: 1
- Sell Ratings: 0
- Average Price Target: 1,382.86p
- High Price Target: 1,556.00p
- Low Price Target: 1,100.00p
Trading Strategy Example: Babcock International Group
The following trading examples are for educational purposes only and do not constitute investment advice. Investors should conduct independent research before making trading decisions. An example trading idea for Babcock could be as follows:
After hitting an all-time high in January this year, Babcock shares have been trending downwards, with no clear sign of when, or if, that will reverse.
Even though Babcock had already disclosed its Type 31 charge of £140 million in a trading update in May, shares still reacted negatively to its full-year results (although they have since recovered these losses). Babcock previously recognised a £90 million loss on the same contract in its FY24 results, citing design changes and increased labour costs.
This highlights the execution risks of fixed-price defence contracts which investors should be aware of, not just for Babcock, but for any defence contractor. Project costs can run over budget, and on fixed-price contracts, it’s the contractor, not the customer, who foots the difference.
It’s also worth noting that Babcock is yet to deliver any of the five vessels from its Type 31 frigate programme, meaning that there could be further cost overruns on this project in the future.
How to Buy Babcock Stock in 4 Steps
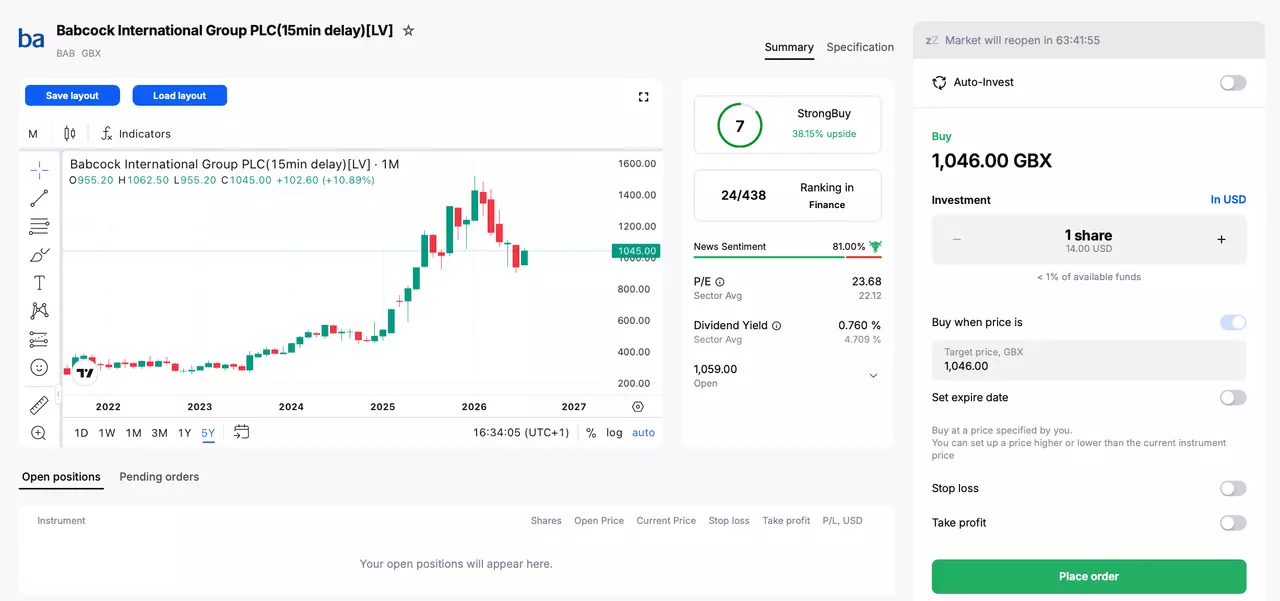
- Open an account with Admirals and complete the onboarding process to access the dashboard.
- Click on Trade or Invest on one of your live or demo accounts to open the Admirals Platform.
- Search for your stock in the search window at the top.
- Input your entry, stop-loss and take profit levels in the trading ticket.

Do You See the Babcock Stock Price Moving Differently?
If you believe there is a higher chance that the share price of Babcock will move lower, then you can also trade short using CFDs (Contracts for Difference). However, these have higher associated risks and are not suitable for all investors. Learn more about CFDs in this How to Trade CFDs article.
The given data provides additional information regarding all analysis, estimates, prognosis, forecasts, market reviews, weekly outlooks or other similar assessments or information (hereinafter “Analysis”) published on the websites of Admirals investment firms operating under the Admirals trademark (hereinafter “Admirals”) Before making any investment decisions please pay close attention to the following: