How to Trade Eli Lilly After Q2 Earnings Beat


Eli Lilly is the largest pharmaceutical company in the world by market capitalisation, currently valued at more than $1 trillion.
Last week, Lilly announced earnings for the second quarter. Thanks to strong demand for its weight loss and diabetes GLP-1 drugs, the company comfortably beat expectations on the top and bottom lines. However, revenue is now concentrated in just two products, and their success has contributed to Eli Lilly trading at a premium valuation.
Keep reading to find out more and learn what analysts are predicting for the stock.
The information in this article is provided for educational purposes only and does not constitute financial advice. Consult a financial advisor before making investment decisions.
- The Invest.MT5 Account allows you to buy real stocks and shares from some of the largest stock exchanges in the world.
- Risk Warning: Past performance is not a reliable indicator of future results or future performance. All trading is high risk, and you can lose more than you risk on a trade. Never invest more than you can afford to lose as some trades will lose and some trades will win. Start small to understand your own risk tolerance levels or practice on a demo account first to build your knowledge before investing.
- Trading is not suitable for everyone. Trading is highly speculative and carries a significant risk of loss. While it offers potential opportunities, it also involves high volatility, and leveraged trading can amplify both gains and losses. Retail investors should fully understand these risks before trading.

Eli Lilly Q2 Earnings Performance Summary
Key Takeaways
- Revenue jumped 48% to $22.97 billion, up from $15.56 billion a year before. This growth was driven by a 60% increase in volume, partially offset by a 13% decrease in realised prices.
- US revenue rose 33% to $14.4 billion whilst revenue outside the US soared 80% to $8.6 billion.
- Demand for Lilly’s weight loss and diabetes drugs, Zepbound and Mounjaro, continued to surge. In both cases, strong demand was partly offset by lower realised prices.
- Zepbound revenue climbed 46% to $4.93 billion.
- Mounjaro revenue jumped 91% to $9.94 billion.
- Lilly’s newly launched oral obesity pill, Foundayo, generated its first revenue of $98 million after winning US approval in April.
- Adjusted net income rose 32% to $7.49 billion, whilst adjusted earnings per share increased 33% to $8.38.
- Lilly completed the acquisitions of Orna Therapeutics, Ajax Therapeutics, Centessa Pharmaceuticals and Kelonia Therapeutics during the quarter. It also completed three acquisitions to build an infectious disease portfolio and agreed to acquire AtaiBeckley after the quarter closed.
- The pharmaceutical giant now expects full-year revenue to be in the range of $85 billion to $87 billion, up from previous guidance of $82 billion to $85 billion.
- Lilly expects full-year adjusted EPS to be in the range of $35.50 to $36.50, narrower than its previous guidance of $35.50 to $37.00
- Management said that it had raised underlying EPS guidance by $2.78 at the midpoint, but this had been more than offset by $3.03 per share in charges related to the quarter’s acquisitions.
Source: Eli Lilly Second-Quarter Earnings 2026 & CNBC
Eli Lilly 12-Month Analyst Stock Price Forecast
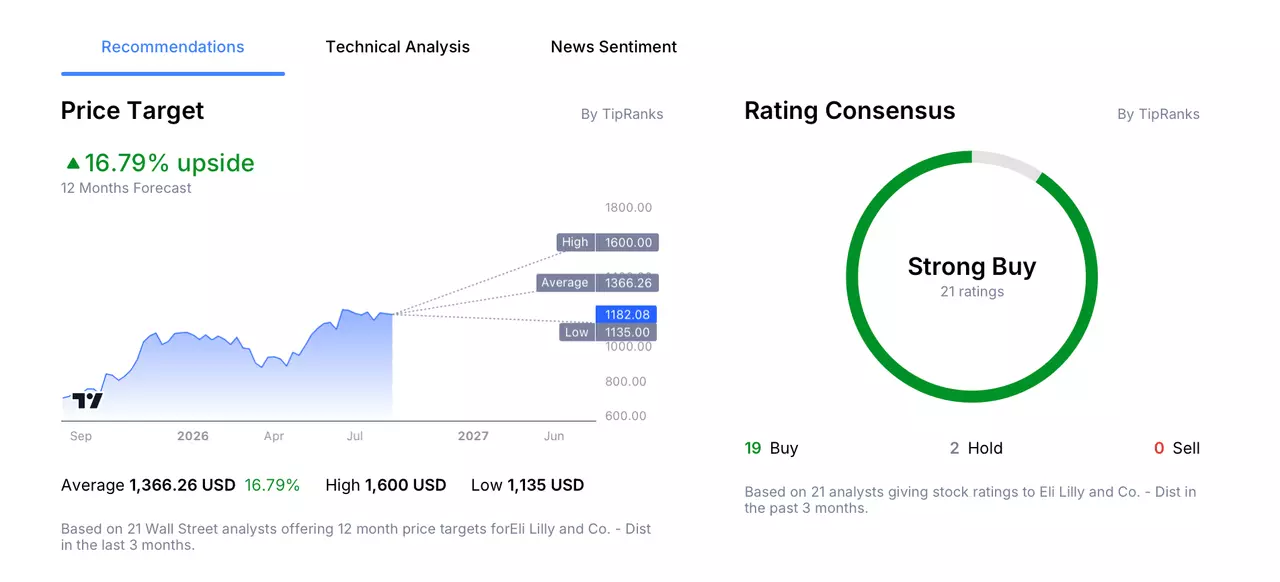
According to 21 Wall Street analysts, polled by TipRanks, offering a 12-month stock price forecast for Eli Lilly over the past 3 months:
- Buy Ratings: 19
- Hold Ratings: 2
- Sell Ratings: 0
- Average Price Target: $1,366.26
- High Price Target: $1,600.00
- Low Price Target: $1,135.00
Trading Strategy Example: Eli Lilly
The following trading examples are for educational purposes only and do not constitute investment advice. Investors should conduct independent research before making trading decisions. An example trading idea for Eli Lilly could be as follows:
Eli Lilly’s second quarter results were largely impressive, with the pharmaceutical giant comfortably beating expectations.
Lilly's recent strong performance hinges on its flagship GLP-1 drugs, Zepbound and Mounjaro. Indeed, the two products accounted for around 65% of quarterly revenue, highlighting their importance to the company’s results. This revenue concentration means that a development such as a change in the competitive landscape could have an outsized impact on financials.
To help combat this, Lilly has been aggressively channelling cash flow from these successful drugs towards new acquisitions to bolster its pipeline. Whilst this could fuel future growth, the costs involved may also weigh on earnings in the near-term, as evidenced by Lilly trimming the top end of its full-year earnings guidance in its Q2 results.
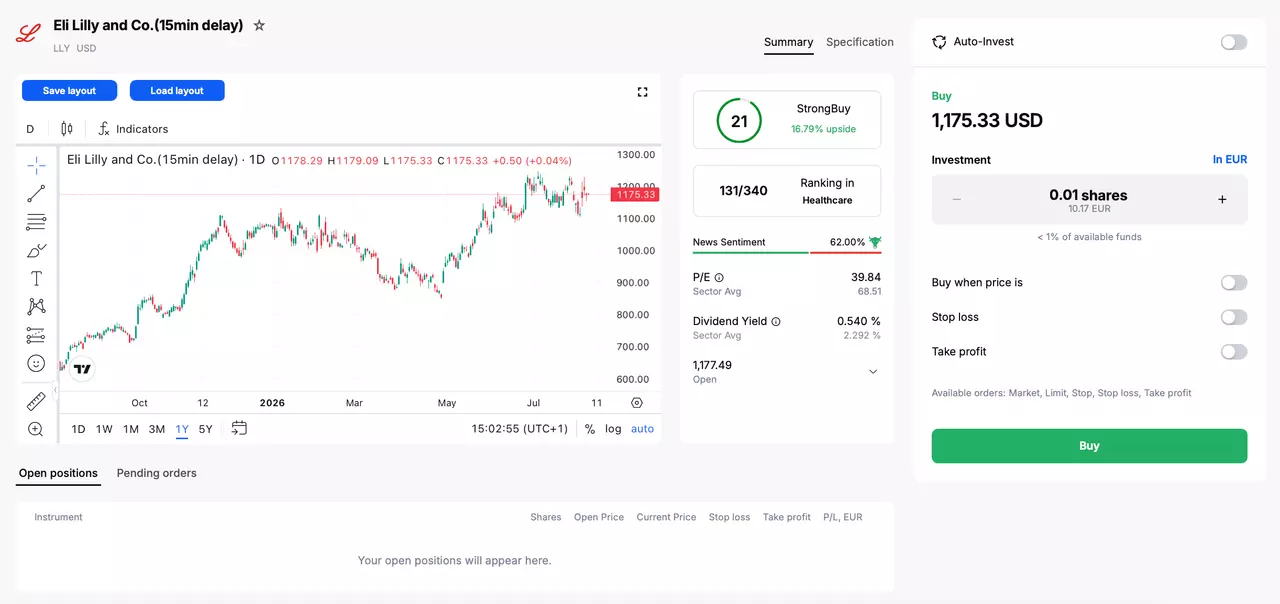
Something else for investors to consider is valuation. Lilly now trades at around 40 times trailing earnings, a premium valuation which could leave the company exposed to downside risk if future growth expectations change.
How to Buy Eli Lilly Stock in 4 Steps
- Open an account with Admirals and complete the onboarding process to access the dashboard.
- Click on Trade or Invest on one of your live or demo accounts to open the Admirals Platform.
- Search for your stock in the search window at the top.
- Input your entry, stop-loss and take profit levels in the trading ticket.

Do You See the Eli Lilly Stock Price Moving Differently?
If you believe there is a higher chance that the share price of Eli Lilly will move lower, then you can also trade short using CFDs (Contracts for Difference). However, these have higher associated risks and are not suitable for all investors. Learn more about CFDs in this How to Trade CFDs article.
The given data provides additional information regarding all analysis, estimates, prognosis, forecasts, market reviews, weekly outlooks or other similar assessments or information (hereinafter “Analysis”) published on the websites of Admirals investment firms operating under the Admirals trademark (hereinafter “Admirals”) Before making any investment decisions please pay close attention to the following: