What’s Going Wrong on Wall Street?
After a strong, and in some cases record-breaking, start to the year, US equities have cooled off more recently.
Yesterday, all the main US indices fell, with the S&P 500, Dow Jones and US100 dropping by 0.97%, 0.96%, 1.07% respectively.
All three of these indices recently posted record closing prices but have all declined considerably since. The S&P 500’s record closing high came on 3 January, but yesterday’s closing price confirmed a decline of 5.5% in the 11 sessions since.
For the tech-heavy US100, the figures are even worse. On 19 November, the index closed at a record high, but has since fallen a remarkable 9.2%.
So, what is going wrong on Wall Street at the moment? In a word, uncertainty.
Although the market seems to have by and large shaken off the majority of its concerns regarding Omicron, the economic landscape remains unclear. Inflation is at its highest rate in four decades in the US, exacerbated by disruptions in global supply chains. This fact is reinforced by the recent rocketing price of oil, which many analysts are touting to surpass $100 a barrel later this year.
As inflation rises, the Fed are under increasing pressure to take decisive action to arrest price increases before they become entrenched. Consequently, the Fed are now expected by many to hike interest rates three times this year, starting in March.
We recently wrote of the effect higher interest rates has on stocks, particularly tech stocks, and what we are currently seeing on Wall Street is the market attempting to price in rising inflation and the prospect of interest rate hikes.
Big tech companies are bearing the brunt of this currently, with Apple, Microsoft, Amazon, Meta Platforms (formerly Facebook), Tesla and Alphabet (Google) all in the red so far this year. Take Microsoft, for example; despite a slight rise yesterday in response to news of its latest acquisition, the tech giant has shed 9.8% from its share price since the turn of the year.
As we also wrote about recently, due to their mammoth market capitalisation, these big tech stocks account for a disproportionate percentage of both the S&P 500 and the US100, so their performance significantly impacts the overall performance of both of these indices.
As long as uncertainty lingers, we can expect to see more volatility in the US stock market and there is bound to be continued uncertainty until we learn for certain what actions the Fed will take in the coming months.
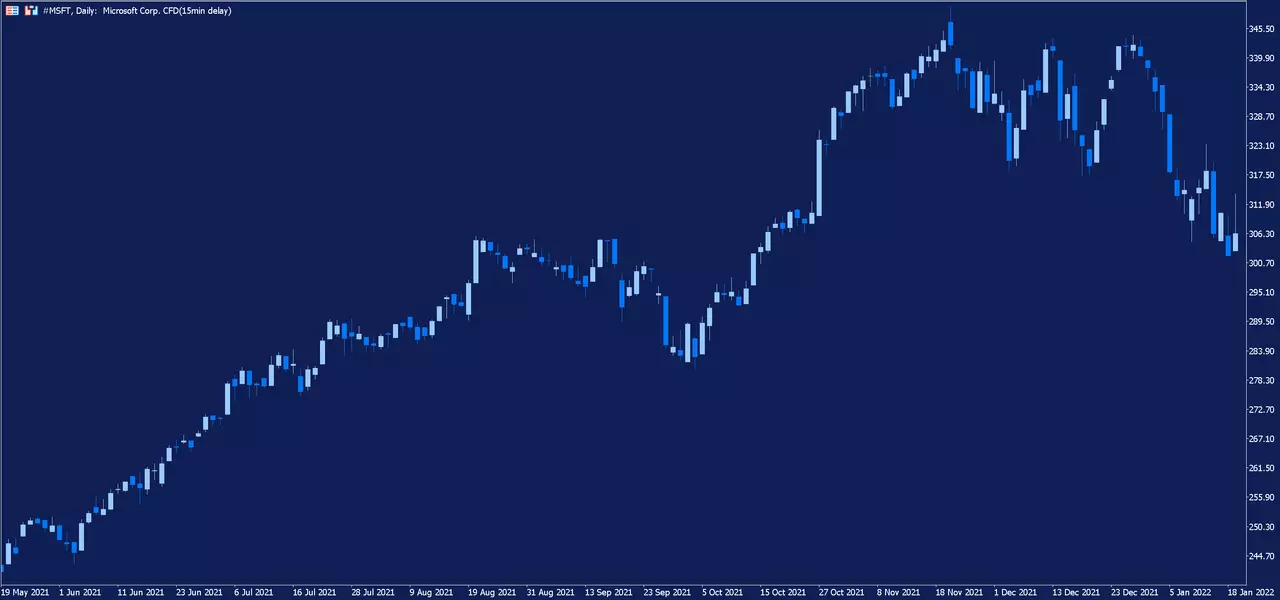
Depicted: Admirals MetaTrader 5 – Microsoft Daily Chart. Date Range: 19 May 2021 – 20 January 2022. Date Captured: 20 January 2022. Past performance is not a reliable indicator of future results.
Trade Stock CFDs with Admirals
With a Trade.MT5 account from Admirals, you can trade Contracts for Difference (CFDs) on the S&P 500, US100, Microsoft, Apple, all the other instruments we looked at in this article and over 3,000 other stocks! CFDs allow traders to attempt to profit from both rising and falling prices, whilst also benefitting from the use of leverage. Click the banner below in order to open an account today:

INFORMATION ABOUT ANALYTICAL MATERIALS:
The given data provides additional information regarding all analysis, estimates, prognosis, forecasts, market reviews, weekly outlooks or other similar assessments or information (hereinafter “Analysis”) published on the websites of Admirals investment firms operating under the Admirals trademark (hereinafter “Admirals”) Before making any investment decisions please pay close attention to the following:
- This is a marketing communication. The content is published for informative purposes only and is in no way to be construed as investment advice or recommendation. It has not been prepared in accordance with legal requirements designed to promote the independence of investment research, and that it is not subject to any prohibition on dealing ahead of the dissemination of investment research.
- Any investment decision is made by each client alone whereas Admirals shall not be responsible for any loss or damage arising from any such decision, whether or not based on the content.
- With view to protecting the interests of our clients and the objectivity of the Analysis, Admirals has established relevant internal procedures for prevention and management of conflicts of interest.
- The Analysis is prepared by an independent analyst Roberto Rivero, Freelance Contributor (hereinafter "Author") based on personal estimations.
- Whilst every reasonable effort is taken to ensure that all sources of the content are reliable and that all information is presented, as much as possible, in an understandable, timely, precise and complete manner, Admirals does not guarantee the accuracy or completeness of any information contained within the Analysis.
- Any kind of past or modelled performance of financial instruments indicated within the content should not be construed as an express or implied promise, guarantee or implication by Admirals for any future performance. The value of the financial instrument may both increase and decrease and the preservation of the asset value is not guaranteed.
- Leveraged products (including contracts for difference) are speculative in nature and may result in losses or profit. Before you start trading, please ensure that you fully understand the risks involved.