How to Trade Vera Bradley After Fiscal Q2 Earnings


Vera Bradley is a US lifestyle brand best known for its handbags, luggage, travel products and accessories, with products sold through its own stores, e-commerce channels and third-party retailers.
On 15 September, Vera Bradley reported results for its fiscal second quarter of 2026 - 2027. Quarterly revenue rose by 1.1% to $71.6 million, while Direct segment sales increased by 8.0%. The company also returned to profitability, reporting net income from continuing operations of $4.5 million, compared with a $4.7 million loss a year earlier. Vera Bradley shares subsequently surged around 31%, as investors reacted positively to signs that the company's turnaround strategy may be gaining traction.
However, the results were not positive across the board. Indirect segment revenue fell 39.4%, while part of the sharp improvement in gross margin was driven by $7.7 million of tariff refunds related to prior periods. With Vera Bradley reiterating its full-year outlook rather than raising it, investors will now be watching whether stronger direct sales and improving profitability can translate into sustainable growth. Keep reading to learn more about Vera Bradley's latest earnings and what analysts are forecasting for the stock.
The information in this article is provided for educational purposes only and does not constitute financial advice. Consult a financial advisor before making investment decisions.
- The Invest.MT5 Account allows you to buy real stocks and shares from some of the largest stock exchanges in the world.
- Risk Warning: Past performance is not a reliable indicator of future results or future performance. All trading is high risk, and you can lose more than you risk on a trade. Never invest more than you can afford to lose as some trades will lose and some trades will win. Start small to understand your own risk tolerance levels or practice on a demo account first to build your knowledge before investing.
- Trading is not suitable for everyone. Trading is highly speculative and carries a significant risk of loss. While it offers potential opportunities, it also involves high volatility, and leveraged trading can amplify both gains and losses. Retail investors should fully understand these risks before trading.

Vera Bradley Fiscal Q2 Performance Summary
Key Takeaways:
- Consolidated net revenue increased 1.1% year-over-year to $71.6 million, compared with $70.9 million in the same quarter last year. This marked Vera Bradley’s second consecutive quarter of overall revenue growth, supporting management’s view that its turnaround strategy is beginning to gain momentum.
- The company’s Direct segment, which includes its own stores, websites and direct-to-consumer marketplaces, was the main growth driver:
- Revenue increased 8.0% to $65.4 million, up from $60.5 million a year earlier.
- Comparable sales rose 9.2%, with all direct channels reporting positive comparable growth.
- Management attributed the improvement partly to stronger e-commerce conversion and a higher average transaction value.
- In contrast, Indirect segment revenue fell 39.4% to $6.3 million, from $10.3 million a year earlier. Management attributed the decline to changes in its marketplace strategy, the timing of certain sales and a deliberate reduction in inventory liquidation activity.
- Profitability improved significantly during the quarter:
- Net income from continuing operations was $4.5 million, or $0.15 per diluted share, compared with a loss of $4.7 million, or $0.17 per diluted share, a year earlier.
- On a non-GAAP basis, net income from continuing operations was $3.3 million, or $0.11 per diluted share, compared with a $0.5 million loss in the prior-year quarter.
- Operating income from continuing operations reached $4.2 million, equivalent to an operating margin of 5.8%, compared with an operating loss of $4.6 million and a negative 6.5% margin one year earlier. This represented a 1,230 basis-point year-over-year improvement in operating margin.
- Gross profit rose to $42.8 million, with gross margin expanding to 59.8% from 50.1% a year earlier. However, investors should note that the improvement was boosted by $7.7 million of tariff refunds relating to prior-period customs entries. Excluding those refunds, gross margin improved by slightly more than 0.4 percentage points year-over-year.
- Vera Bradley also reported improvement in its balance sheet and cash generation:
- Inventory fell 28.4% to $69.3 million.
- The company generated $23 million of operating cash flow during the quarter.
- Cash and cash equivalents reached $34.2 million, more than double the $15.2 million reported a year earlier.
- Vera Bradley reported no long-term debt at the end of the quarter.
- Management reiterated its fiscal 2027 outlook, including:
- Net sales of $255 million to $270 million.
- An improvement of 50% or more in non-GAAP operating loss compared with the prior-year loss of $21.7 million.
- Continued focus on rebuilding the wholesale business while reducing reliance on liquidation channels.
Vera Bradley 12-Month Analyst Stock Price Forecast
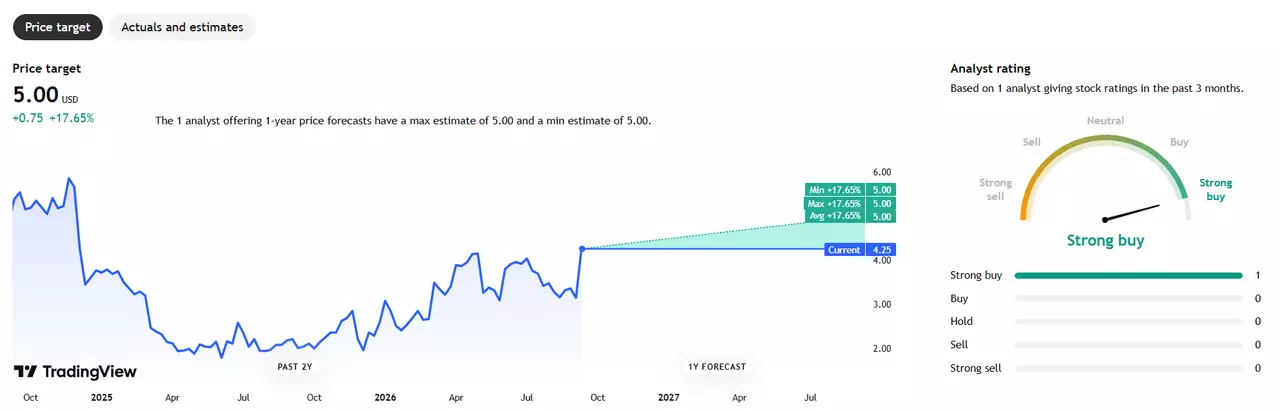
According to analyst data available for Vera Bradley, there are currently nine analyst ratings on the stock. Of these, six are Buy ratings, one is a Hold and two are Sell ratings. Analyst coverage of Vera Bradley remains limited compared with larger publicly traded companies, which should be taken into consideration when assessing the consensus outlook:
- Buy Ratings: 6
- Hold Ratings: 1
- Sell Ratings: 2
- Average Price Target: $4.50
- High Price Target: $5.00
- Low Price Target: $4.00
The average 12-month analyst price target for Vera Bradley is currently $4.50, while the shares closed at $4.25 on 18 September 2026. This represents potential upside of approximately 5.9% from that closing price. The highest analyst target of $5.00 would imply potential upside of approximately 17.6%. However, because analyst coverage is relatively limited, investors should consider these forecasts alongside the company’s earnings, guidance and progress with its turnaround strategy.
Source: Yahoo Finance and analyst ratings data. Past performance is not a reliable indicator of future results.
Trading Strategy Example: Vera Bradley
The following trading examples are for educational purposes only and do not constitute investment advice. Investors should conduct independent research before making trading decisions. An example trading idea for Vera Bradley could be as follows:
Two key considerations to keep in mind are the sustainability of Vera Bradley’s turnaround and the quality of its recent margin improvement.
Vera Bradley’s fiscal Q2 results showed encouraging signs from its direct-to-consumer business. Direct segment revenue increased 8.0%, while comparable sales rose 9.2%, marking the second consecutive quarter of positive comparable sales. If the company can maintain this momentum while continuing to improve profitability, it could provide support for the turnaround story. However, Indirect segment revenue declined 39.4%, highlighting that the recovery is not yet broad-based across the business.
Investors should also consider how much of the recent improvement in profitability is sustainable. Gross margin rose to 59.8%, but the increase was significantly helped by $7.7 million of tariff refunds related to prior-period customs entries. Excluding these refunds, gross margin improved by only slightly more than 0.4 percentage points year-over-year. Future earnings will therefore be important in showing whether Vera Bradley can continue expanding margins without the benefit of similar one-off items.
How to Buy Vera Bradley Stock in 4 Steps
- Open an account with Admirals and complete the onboarding process to access the dashboard.
- Click on Trade or Invest on one of your live or demo accounts to open the Admirals Platform.
- Search for Vera Bradley (VRA.US) in the search window at the top.
- Input your entry, stop-loss and take-profit levels in the trading ticket.

Do You See the Vera Bradley Stock Price Moving Differently?
If you believe there is a higher chance that the share price of Vera Bradley will move lower, then you can also trade short using CFDs (Contracts for Difference). However, these have higher associated risks and are not suitable for all investors. Learn more about CFDs in this How to Trade CFDs article.
The given data provides additional information regarding all analysis, estimates, prognosis, forecasts, market reviews, weekly outlooks or other similar assessments or information (hereinafter “Analysis”) published on the websites of Admirals investment firms operating under the Admirals trademark (hereinafter “Admirals”) Before making any investment decisions please pay close attention to the following: