How to Trade NVIDIA After Fiscal Q4 2026 Earnings

Founded in 1993 and headquartered in Santa Clara, California, NVIDIA (NASDAQ: NVDA) has grown from a niche graphics chipmaker into one of the most influential technology companies in the world.
The company operates through four primary businesses: Data Centre, Gaming, Professional Visualisation, and Automotive. Across these segments, it provides the hardware and software that support AI development, cloud computing, and advanced digital graphics.
NVIDIA recently reported its Q4 fiscal 2026 results. Here’s a closer look at its performance and what analysts are forecasting for the stock.
The information in this article is provided for educational purposes only and does not constitute financial advice. Consult a financial advisor before making investment decisions.
- The Invest.MT5 Account allows you to buy real stocks and shares from some of the largest stock exchanges in the world.
- Risk Warning: Past performance is not a reliable indicator of future results or future performance. All trading is high risk, and you can lose more than you risk on a trade. Never invest more than you can afford to lose as some trades will lose and some trades will win. Start small to understand your own risk tolerance levels or practice on a demo account first to build your knowledge before investing.
- Trading is not suitable for everyone. Trading is highly speculative and carries a significant risk of loss. While it offers potential opportunities, it also involves high volatility, and leveraged trading can amplify both gains and losses. Retail investors should fully understand these risks before trading.

NVIDIA’s Fiscal Q4 2026 Earnings Performance Summary
Key Takeaways
- Revenue growth remained exceptionally strong, driven by broad-based strength across segments, particularly accelerating demand for AI and data centre infrastructure. Fiscal Q4 revenue came in at $68.1 billion, increasing 73% year on year and 20% quarter on quarter, marking record quarterly revenue and the largest QoQ growth in the company’s history.
- Profitability remained strong, with earnings scaling alongside revenue growth. Net income increased 79% YoY, while adjusted earnings per share came in at $1.76, up 98% YoY.
- Core operating segments showed strong momentum, particularly in Data Centre and Professional Visualisation.
- Data Centre remained the primary growth driver, with Q4 revenue up 75% YoY, fuelled by accelerating demand for AI and cloud computing.
- The Gaming and AI PC segments remained healthy, with revenue up 47% YoY to $3.7 billion, driven by strong Blackwell demand, although it declined 13% from the previous quarter as channel inventory naturally moderated following a season of strong holiday demand.
- Professional Visualisation was the standout performer, with revenue up 159% YoY and 74% QoQ to $1.3 billion, driven by exceptional demand for Blackwell and AI-focused workstation products.
- Automotive and Robotics grew more steadily, with revenue up 6% YoY, supported by continued adoption of NVIDIA’s self-driving platforms.
- Management highlighted an inflection point in AI demand, signalling continued strong growth ahead. CEO Jensen Huang said, “Computing demand is growing exponentially,” and that enterprise adoption of AI agents is “skyrocketing,” with customers racing to invest in AI compute.
- Guidance pointed to continued momentum. NVIDIA expects first-quarter fiscal 2027 revenue of $78.0 billion (±2%), and noted that this outlook does not assume any Data Centre compute revenue from China.
Source: NVIDIA Quarterly Earnings Release and Earnings Presentation
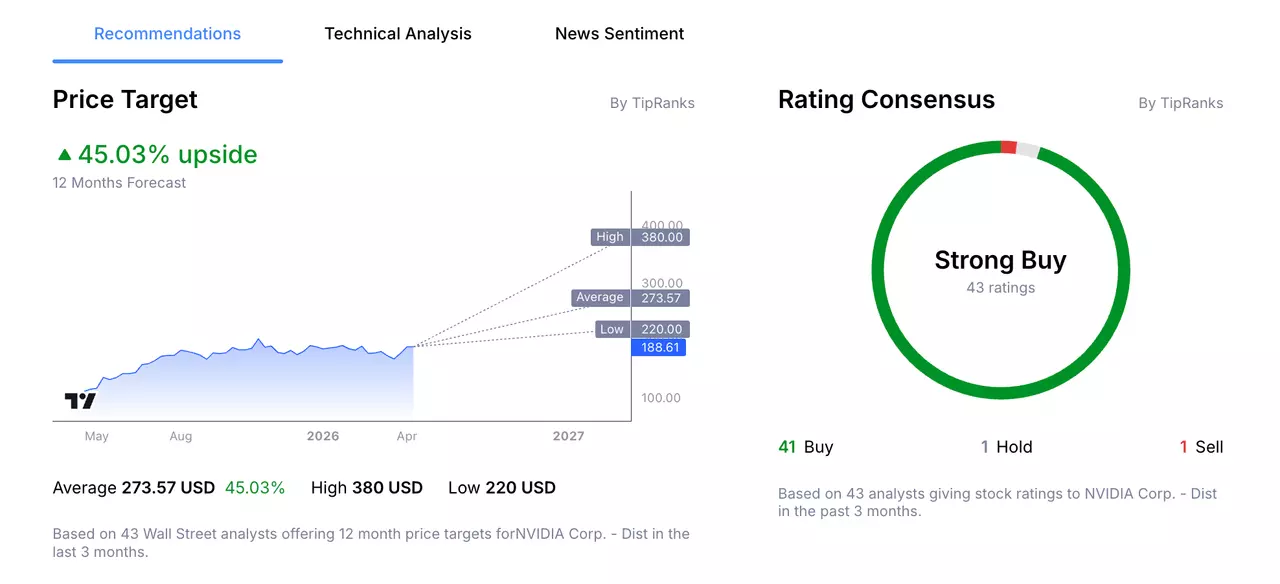
NVIDIA’s 12-Month Analyst Stock Price Forecast
According to 43 Wall Street analysts, polled by TipRanks, offering a 12-month stock price forecast for NVIDIA over the past 3 months:
- Buy Ratings: 41
- Hold Ratings: 1
- Sell Ratings: 1
- Average Price Target: $273.57
- High Price Target: $380.00
- Low Price Target: $220.00
Trading Strategy Example: NVIDIA Corp.
The following trading examples are for educational purposes only and do not constitute investment advice. Investors should conduct independent research before making trading decisions. An example trading idea for the NVIDIA share price could be as follows:
Remember, markets are volatile, and NVIDIA’s share price can fluctuate and may even trend lower. While demand for AI infrastructure remains strong, uncertainty around export controls and regulation could weigh on growth expectations and investor sentiment.
Moreover, any moderation in large-scale AI spending, rising costs, supply-chain pressures, or broader market shifts could influence how the company performs over time.
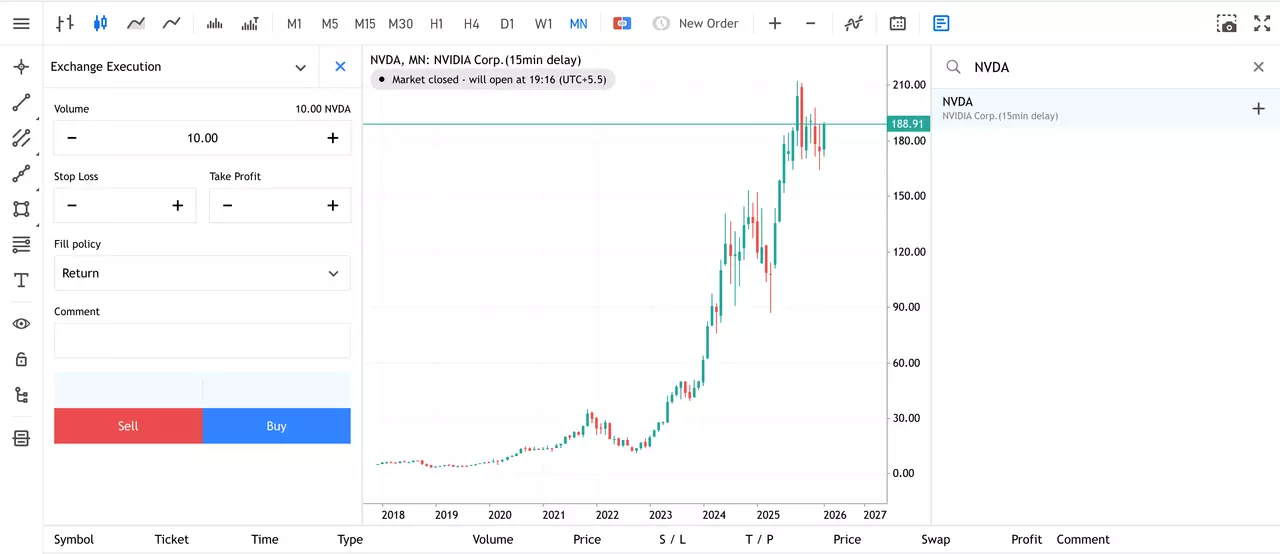
How to Buy NVIDIA Stock in 4 Steps
- Open an account with Admirals and complete the onboarding process to access the dashboard.
- Click on Trade or Invest on one of your live or demo accounts to open the web platform.
- Search for your stock in the search window at the top.
- Input your entry, stop-loss and take profit levels in the trading ticket.
Do You See the NVIDIA Stock Price Moving Differently?
If you believe there is a higher chance that the share price of NVIDIA will move lower, then you can also trade short using CFDs (Contracts for Difference). However, these have higher associated risks and are not suitable for all investors. Learn more about CFDs in this How to Trade CFDs article.
The given data provides additional information regarding all analysis, estimates, prognosis, forecasts, market reviews, weekly outlooks or other similar assessments or information (hereinafter “Analysis”) published on the websites of Admirals investment firms operating under the Admirals trademark (hereinafter “Admirals”) Before making any investment decisions please pay close attention to the following:
- This is a marketing communication. The content is published for informative purposes only and is in no way to be construed as investment advice or recommendation. It has not been prepared in accordance with legal requirements designed to promote the independence of investment research, and that it is not subject to any prohibition on dealing ahead of the dissemination of investment research.
- Any investment decision is made by each client alone whereas Admirals shall not be responsible for any loss or damage arising from any such decision, whether or not based on the content.
- With view to protecting the interests of our clients and the objectivity of the Analysis, Admirals has established relevant internal procedures for prevention and management of conflicts of interest.
- The Analysis is prepared by an analyst (hereinafter “Author”). The Author Clarice Mendonsa is a contractor for Admirals. This content is a marketing communication and does not constitute independent financial research.
- Whilst every reasonable effort is taken to ensure that all sources of the content are reliable and that all information is presented, as much as possible, in an understandable, timely, precise and complete manner, Admirals does not guarantee the accuracy or completeness of any information contained within the Analysis.
- Any kind of past or modelled performance of financial instruments indicated within the content should not be construed as an express or implied promise, guarantee or implication by Admirals for any future performance. The value of the financial instrument may both increase and decrease and the preservation of the asset value is not guaranteed.
- Leveraged products (including contracts for difference) are speculative in nature and may result in losses or profit. Before you start trading, please ensure that you fully understand the risks involved.