How to Trade Citi After Q4 2025 Earnings

Citigroup (NYSE: C), headquartered in New York City, is one of the world’s largest banking groups, providing financial services to consumers and businesses in more than 180 countries.
The firm operates through five core interconnected businesses: Services, Markets, Banking and International, Wealth, and U.S. Consumer Cards. Through these divisions, the bank offers a wide range of financial services, including corporate and investment banking, trading, lending, wealth management, and credit card services.
Citigroup recently reported its fourth-quarter 2025 results. Here’s a closer look at its performance and what analysts are forecasting for the stock.
The information in this article is provided for educational purposes only and does not constitute financial advice. Consult a financial advisor before making investment decisions.
- The Invest.MT5 Account allows you to buy real stocks and shares from some of the largest stock exchanges in the world.
- Risk Warning: Past performance is not a reliable indicator of future results or future performance. All trading is high risk, and you can lose more than you risk on a trade. Never invest more than you can afford to lose as some trades will lose and some trades will win. Start small to understand your own risk tolerance levels or practice on a demo account first to build your knowledge before investing.
- Trading is not suitable for everyone. Trading is highly speculative and carries a significant risk of loss. While it offers potential opportunities, it also involves high volatility, and leveraged trading can amplify both gains and losses. Retail investors should fully understand these risks before trading.

Citi’s Q4 2025 Earnings Performance Summary
Key Takeaways
- Revenue growth appeared modest, but underlying business performance was stronger after adjusting for one-time charges. Fourth quarter revenue rose 2% year over year to $19.9 billion, while full-year revenue increased 6% to $85.2 billion. Excluding a $1.1 billion after-tax loss tied to Citi’s planned exit from its Russian operations, fourth-quarter revenue would have reached $21.0 billion, up 8% YoY, reflecting modest performance across several core businesses.
- Quarterly profit declined due to the Russia divestiture charge, but full-year earnings improved. Fourth quarter net income fell 13% YoY to $2.5 billion. For the full year, net income rose 13% to $14.3 billion, supported by revenue growth.
- Core operating segments showed strong momentum, particularly in Banking and Services.
- Banking revenue: $2.2 billion (+78% YoY), driven by stronger corporate lending and investment banking activity.
- Services revenue: $5.9 billion (+15% YoY), supported by higher deposit balances and transaction activity in Treasury and Trade Solutions.
- Wealth revenue: $2.1 billion (+7% YoY), reflecting growth in Citigold and the Private Bank.
- U.S. Personal Banking revenue: $5.3 billion (+3% YoY), supported by branded cards and retail banking.
- Markets revenue: $4.5 billion (−1% YoY), reflecting slightly lower performance in fixed income and equity trading compared with a strong quarter in the prior year.
- The CEO of Citigroup Jane Fraser said, “We enter 2026 with visible momentum across the firm and are committed to reaching our target of 10-11% return on tangible common equity (RoTCE) for the year and positioning Citi for improved returns above that level in the years ahead.”
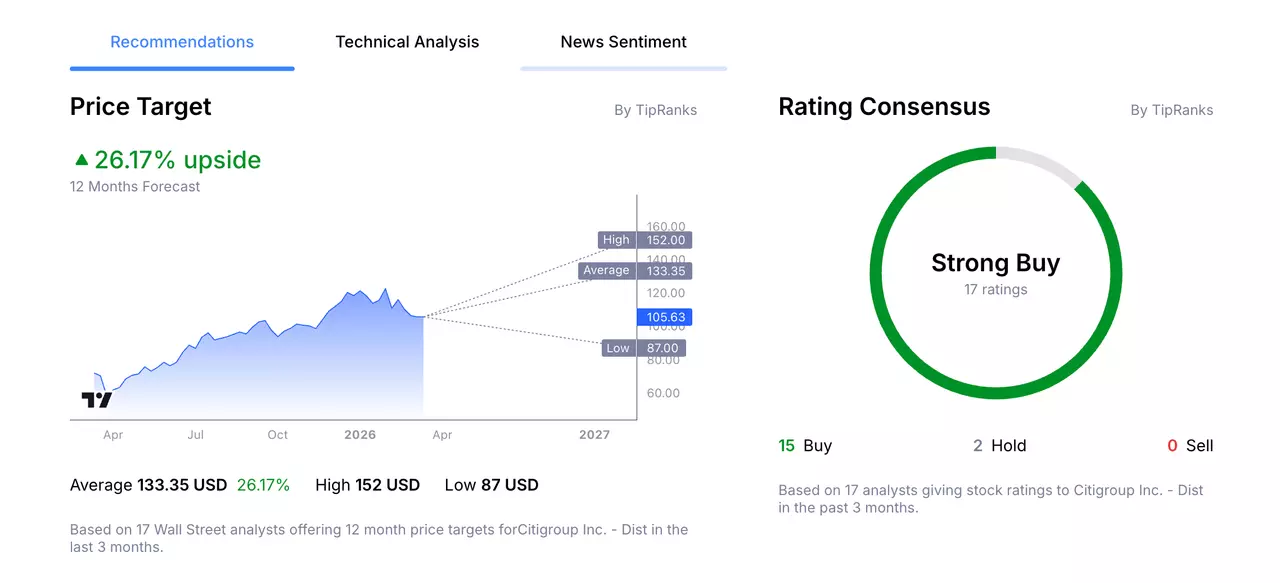
Citi’s 12-Month Analyst Stock Price Forecast
According to 17 Wall Street analysts, polled by TipRanks, offering a 12-month stock price forecast for Citigroup over the past 3 months:
- Buy Ratings: 15
- Hold Ratings: 2
- Sell Ratings: 0
- Average Price Target: $133.35
- High Price Target: $152.00
- Low Price Target: $87.00
Trading Strategy Example: Citigroup Inc.
The following trading examples are for educational purposes only and do not constitute investment advice. Investors should conduct independent research before making trading decisions. An example trading idea for the Citigroup share price could be as follows:
Remember, markets are volatile, and Citi’s share price can fluctuate and may even trend lower. In the current environment, geopolitical tensions, including the recent escalation involving Iran, may increase the risk of a broader economic shock. If this were to occur, it could weigh on investor sentiment and potentially affect global markets. In addition, potential changes in interest-rate expectations and broader market conditions could influence how the bank performs over time.
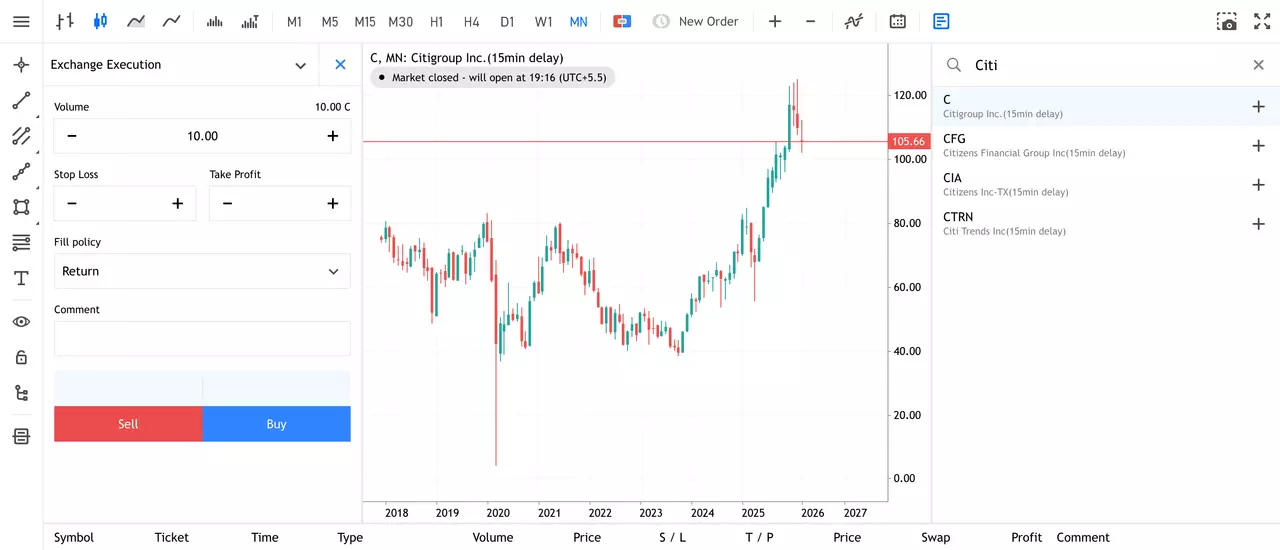
How to Buy Citi Stock in 4 Steps
- Open an account with Admirals and complete the onboarding process to access the dashboard.
- Click on Trade or Invest on one of your live or demo accounts to open the web platform.
- Search for your stock in the search window at the top.
- Input your entry, stop-loss and take profit levels in the trading ticket.
Do You See the Citi Stock Price Moving Differently?
If you believe there is a higher chance that the share price of Citi will move lower, then you can also trade short using CFDs (Contracts for Difference). However, these have higher associated risks and are not suitable for all investors. Learn more about CFDs in this How to Trade CFDs article.
The given data provides additional information regarding all analysis, estimates, prognosis, forecasts, market reviews, weekly outlooks or other similar assessments or information (hereinafter “Analysis”) published on the websites of Admirals investment firms operating under the Admirals trademark (hereinafter “Admirals”) Before making any investment decisions please pay close attention to the following:
- This is a marketing communication. The content is published for informative purposes only and is in no way to be construed as investment advice or recommendation. It has not been prepared in accordance with legal requirements designed to promote the independence of investment research, and that it is not subject to any prohibition on dealing ahead of the dissemination of investment research.
- Any investment decision is made by each client alone whereas Admirals shall not be responsible for any loss or damage arising from any such decision, whether or not based on the content.
- With view to protecting the interests of our clients and the objectivity of the Analysis, Admirals has established relevant internal procedures for prevention and management of conflicts of interest.
- The Analysis is prepared by an analyst (hereinafter “Author”). The Author Clarice Mendonsa is a contractor for Admirals. This content is a marketing communication and does not constitute independent financial research.
- Whilst every reasonable effort is taken to ensure that all sources of the content are reliable and that all information is presented, as much as possible, in an understandable, timely, precise and complete manner, Admirals does not guarantee the accuracy or completeness of any information contained within the Analysis.
- Any kind of past or modelled performance of financial instruments indicated within the content should not be construed as an express or implied promise, guarantee or implication by Admirals for any future performance. The value of the financial instrument may both increase and decrease and the preservation of the asset value is not guaranteed.
- Leveraged products (including contracts for difference) are speculative in nature and may result in losses or profit. Before you start trading, please ensure that you fully understand the risks involved.