How to Trade Amazon After Q3 2025 Performance
December 16, 2025 09:11

Amazon.com, Inc. (NASDAQ: AMZN) is a global technology company that connects millions of customers to products, services, and digital experiences. It sells products directly to consumers and operates marketplaces for third-party sellers, provides cloud computing through Amazon Web Services (AWS), offers subscriptions like Prime, delivers advertising solutions, and more.
The company recently reported its third-quarter 2025 results. Here’s a closer look at the performance and what analysts are forecasting for the stock.
This material is for informational purposes only and not financial advice. Consult a financial advisor before making investment decisions.
- The Invest.MT5 account allows you to buy real stocks and shares from some of the largest stock exchanges in the world.
- Risk Warning: Past performance is not a reliable indicator of future results or future performance. All trading is high risk, and you can lose more than you risk on a trade. Never invest more than you can afford to lose as some trades will lose and some trades will win. Start small to understand your own risk tolerance levels or practice on a demo account first to build your knowledge before investing.
- Trading is not suitable for everyone. Trading is highly speculative and carries a significant risk of loss. While it offers potential opportunities, it also involves high volatility, and leveraged trading can amplify both gains and losses. Retail investors should fully understand these risks before trading.

Amazon’s Q3 2025 Performance Summary
Key Takeaways
- Amazon delivered strong third-quarter results with total net sales of $180.2 billion, up 13% year-on-year (YoY).
- Net income rose sharply to $21.2 billion, or $1.95 per diluted share, compared with $15.3 billion or $1.43 last year.
- Amazon Web Services (AWS) continued to be a major profit engine, driving the biggest share of segment operating income. The operating income of the segment grew to $11.4 billion from $10.4 billion a year earlier, even after absorbing planned severance costs.
- Operating cash flow remains robust, expanding 16% to $130.7 billion for the trailing twelve months. However, free cash flow declined due to capital expenditures.
- Amazon is currently focusing on accelerating capacity, having added 3.8 gigawatts of power capacity over the past 12 months, more than any other cloud provider.
- For Q4 2025, the company expects net sales to grow between 10% and 13% YoY, with operating income expected to be roughly in line with the prior-year quarter.
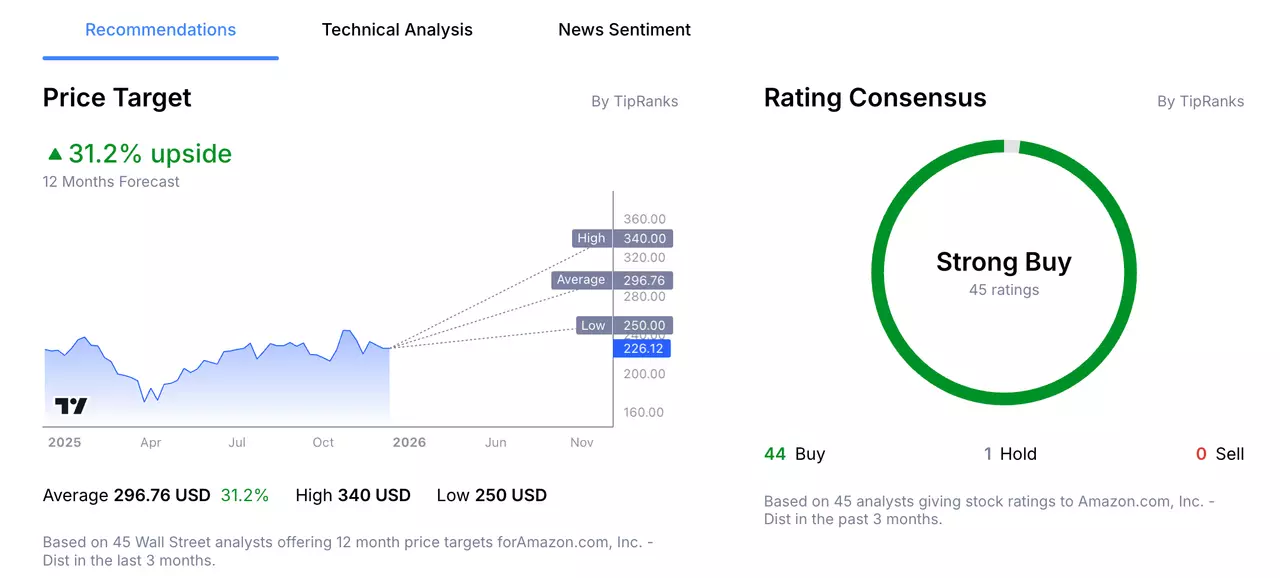
Amazon’s 12-Month Analyst Stock Price Forecast
According to 45 Wall Street analysts, polled by TipRanks, offering a 12-month stock price forecast for Amazon over the past 3 months:
- Buy Ratings: 44
- Hold Ratings: 1
- Sell Ratings: 0
- Average Price Target: $296.76
- High Price Target: $340.00
- Low Price Target: $250.00
Trading Strategy Example: Amazon
The following trading examples are for educational purposes only and do not constitute investment advice. Investors should conduct independent research before making trading decisions. An example trading idea for the Amazon share price could be as follows:
Remember, markets are volatile, and the share price of Amazon will fluctuate and may even trend lower. While Amazon benefits from diversified revenue streams, its valuation remains sensitive to changes in consumer spending, cloud demand, and overall market sentiment. Moreover, the stock is trading near its all-time high and could also see short-term pullbacks.
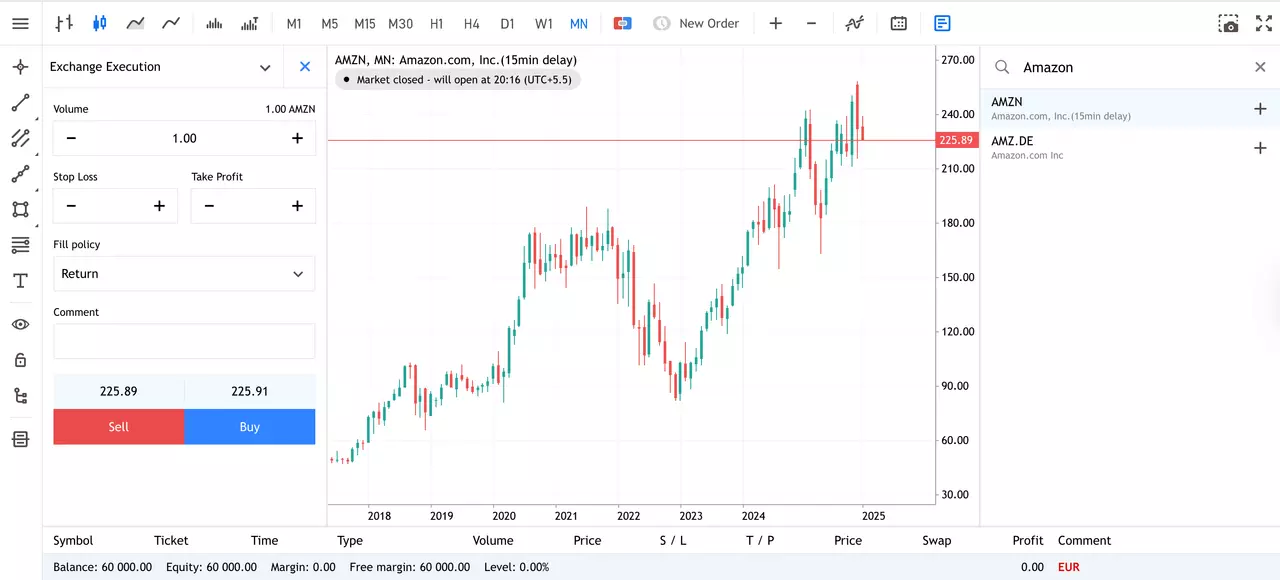
How to Buy Amazon Stock in 4 Steps
- Open an account with Admirals and complete the onboarding process to access the dashboard.
- Click on Trade or Invest on one of your live or demo accounts to open the web platform.
- Search for your stock in the search window at the top.
- Input your entry, stop-loss and take profit levels in the trading ticket.
Do You See the Amazon Stock Price Moving Differently?
If you believe there is a higher chance the share price of Amazon will move lower, then you can also trade short using CFDs (Contracts for Difference). However, these have higher associated risks and are not suitable for all investors. Learn more about CFDs in this How to Trade CFDs article.
The given data provides additional information regarding all analysis, estimates, prognosis, forecasts, market reviews, weekly outlooks or other similar assessments or information (hereinafter “Analysis”) published on the websites of Admirals investment firms operating under the Admirals trademark (hereinafter “Admirals”) Before making any investment decisions please pay close attention to the following:
- This is a marketing communication. The content is published for informative purposes only and is in no way to be construed as investment advice or recommendation. It has not been prepared in accordance with legal requirements designed to promote the independence of investment research, and that it is not subject to any prohibition on dealing ahead of the dissemination of investment research.
- Any investment decision is made by each client alone whereas Admirals shall not be responsible for any loss or damage arising from any such decision, whether or not based on the content.
- With view to protecting the interests of our clients and the objectivity of the Analysis, Admirals has established relevant internal procedures for prevention and management of conflicts of interest.
- The Analysis is prepared by an analyst (hereinafter “Author”). The Author Clarice Mendonsa is a contractor for Admirals. This content is a marketing communication and does not constitute independent financial research.
- Whilst every reasonable effort is taken to ensure that all sources of the content are reliable and that all information is presented, as much as possible, in an understandable, timely, precise and complete manner, Admirals does not guarantee the accuracy or completeness of any information contained within the Analysis.
- Any kind of past or modelled performance of financial instruments indicated within the content should not be construed as an express or implied promise, guarantee or implication by Admirals for any future performance. The value of the financial instrument may both increase and decrease and the preservation of the asset value is not guaranteed.
- Leveraged products (including contracts for difference) are speculative in nature and may result in losses or profit. Before you start trading, please ensure that you fully understand the risks involved.