Top 10 Trading Ideas for 2019
In 2018, traders and investors from all over the world experienced one of the most interesting years in the financial markets. Trade tensions between the United States and China, ongoing troubles with Brexit, and a crash in cryptocurrencies were just some events that took centre stage.
However, these events are setting up 2019 to be a very interesting year for financial markets. In today's article, we take a look at the top 10 trading ideas for the new year that are available on the Admiral Markets' platform. Remember: trading is not just about the idea but also the execution and risk management of the trade. After all, every trade will win or lose so be sure to trade responsibly.
Trade Idea #1: A 70% Stock Market Crash?
The Rationale:
2018 has been one of the most volatile years global stock markets have seen since the 2008 financial recession. This volatility, combined with rising interest rates, may prove to be an explosive combination and is just one reason many hedge fund managers are predicting a stock market crash in 2019.
In some cases, there have been predictions of a 40% - 70% crash in the stock market:
- Scott Minerd, Chairman of Investments and Global Chief Investment Officer of Guggenheim Partners, has forecasted a 40% drop.
- The CIA's Financial Threat and Asymmetric Warfare Advisor Jim Rickards has claimed that a 70% drop is the best case scenario.
At the last Federal Reserve meeting of the year on 19 December, Chairman Jerome Powell reiterated his bullish stance on hiking interest rates in the future. With interest rate hikes preceding more than 10 economic recessions in the past 40 years, it is little wonder that stock market investors are predicting the worst for 2019. The technical chart also has some investors concerned.
The Trade:
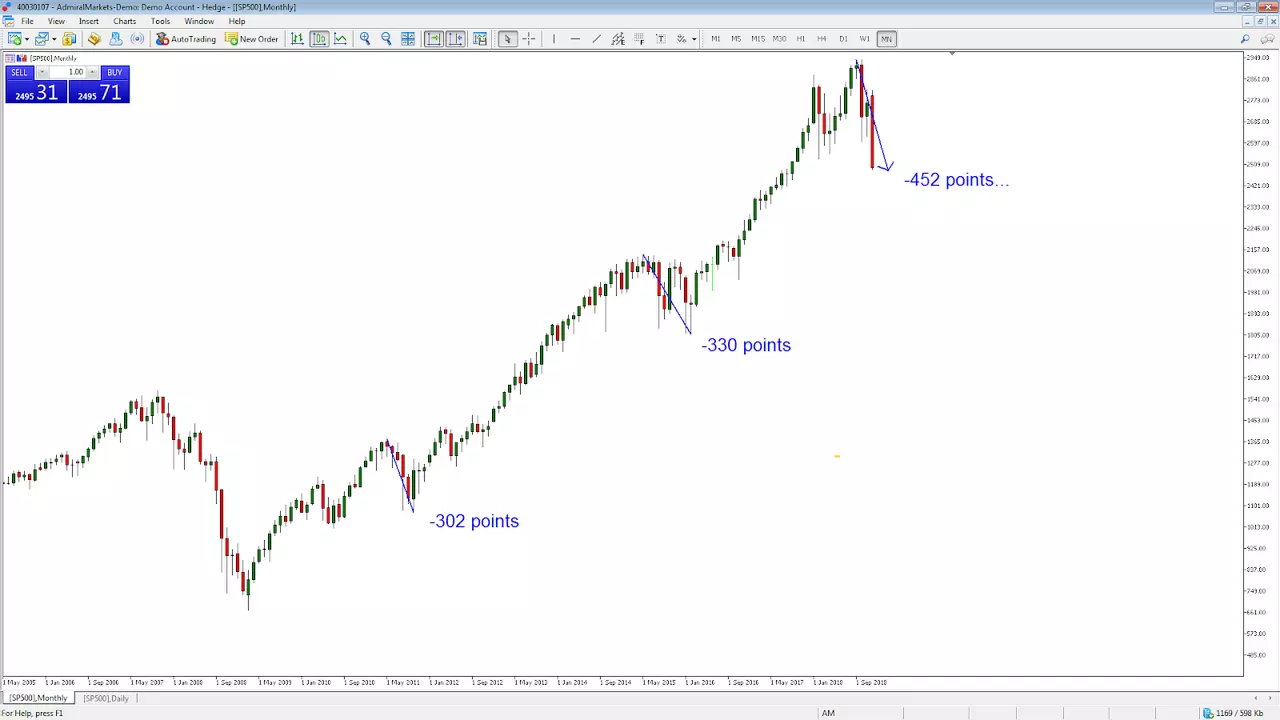
Source: Admiral Markets MetaTrader 5 Supreme Edition - SP500 CFD, Monthly Chart - Data range: 1 May 2005 - 19 December 2018 - Performed on 19 December 2018 at 9:36 PM GMT. Please note: Past performance is not a reliable indicator of future results, or future performance.
In the above chart of the SP500 CFD, the market has rallied higher since 2008 with only three major corrections. With the magnitude of the last retracement already exceeding the amount (in points) of the previous two retracements, sellers are firmly in control of this market.
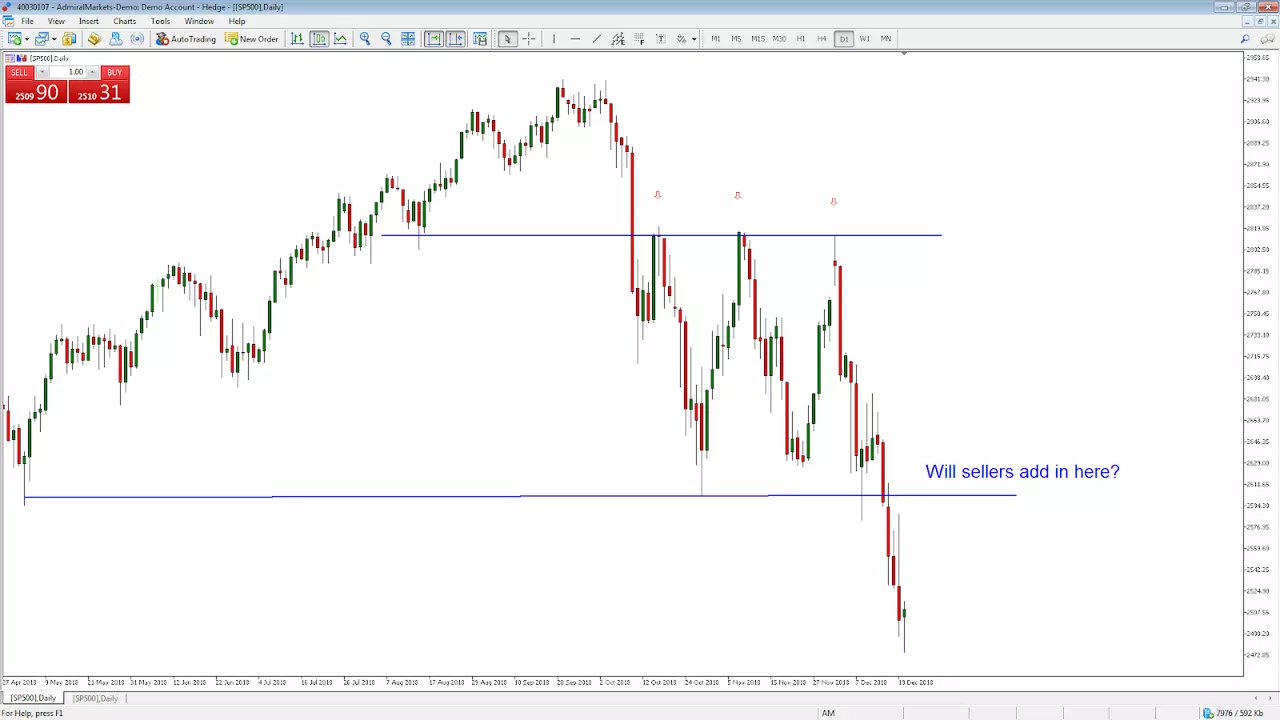
Source: Admiral Markets MetaTrader 5 Supreme Edition - SP500 CFD, Daily Chart - Data range: 27 April 2018 - 20 December 2018 - Performed on 20 December 2018 at 12:49 PM GMT. Please note: Past performance is not a reliable indicator of future results, or future performance.
In the above daily chart of the SP500 CFD sellers have struggled at previous levels of resistance. That makes the $2,603 price level an area to watch, as some traders may use that area to initiate fresh short positions. You may consider using price action based strategies to help identify entry and stop loss levels for 2019.
Trade Idea #2: Will central banks fuel a surge in Gold prices?
The Rationale:
In the first quarter of 2018 demand for gold was up a whopping 42% year on year - according to the World Gold Council. It seems that most of the buying has come from central banks who - in 2010 - transitioned into being net sellers of gold to becoming net buyers of the yellow metal.
It is not yet clear why some central banks around the world have started to raise their gold reserves. One theory is that many emerging economies and fringe countries are trying to move away from the US dollar to end its status as the world's reserve currency.
After all, Russia and China have been very active in gathering support from global governments into creating a new gold-backed currency. With a frosty relationship developing between China and the US due to ongoing trade tariff disputes, many investors have diversified their portfolios to include gold - such as the world's biggest hedge fund manager Ray Dalio.
The Trade:
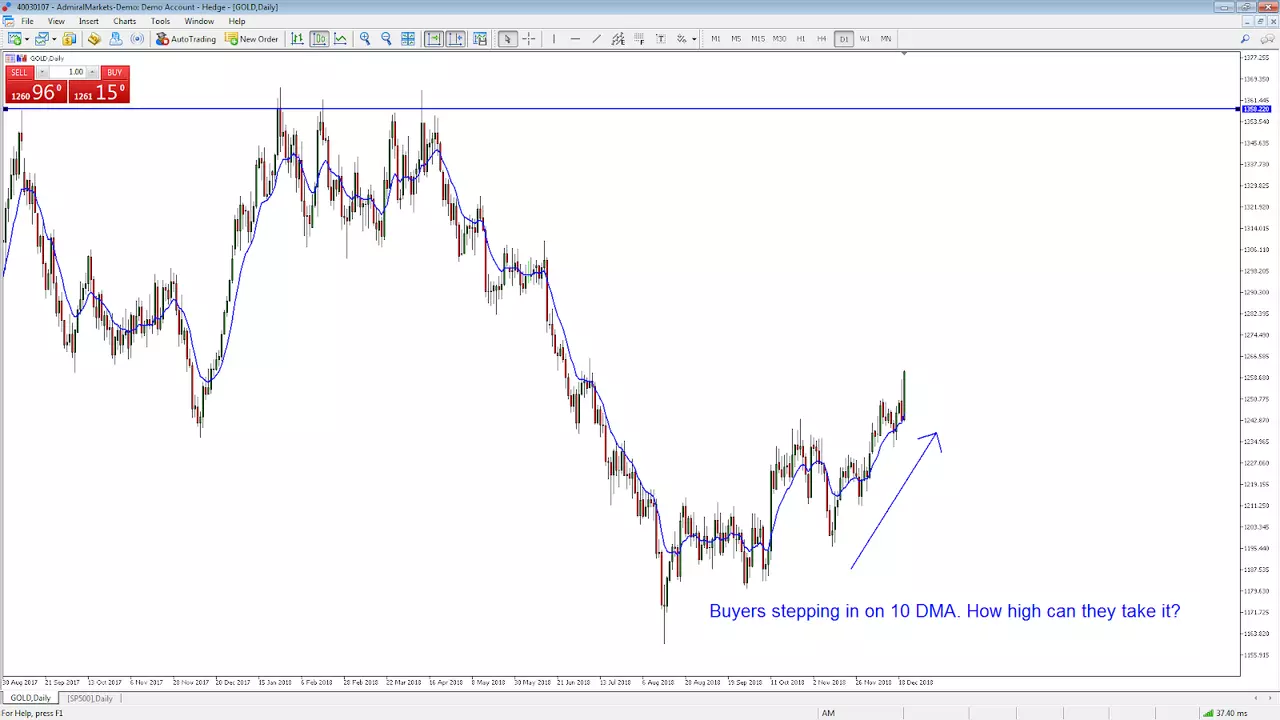
Source: Admiral Markets MetaTrader 5 Supreme Edition - Gold, Daily Chart - Data range: 30 Aug 2017 - 20 December 2018 - Performed on 20 December 2018 at 2:26 PM GMT. Please note: Past performance is not a reliable indicator of future results, or future performance.
In the above chart of gold it's clear to see that sellers were in control for much of 2018. However, in the latter part of 2018 buyers started to take control of the market. Technical indicators like moving averages can help in identifying possible entry points.
It seems that buyers are stepping in on the 10 day moving average but how far can it go? The $1,380 level represents a 5 year high that is sure to have some traders excited. Are you one of them?
Trading With A Demo Account
Trader's also have the ability to trade risk-free with a demo trading account. This means that traders can avoid putting their capital at risk, and they can choose when they wish to move to the live markets. For instance, Admiral Markets' demo trading account enables traders to gain access to the latest real-time market data, the ability to trade with virtual currency, and access to the latest trading insights from expert traders.
To open your FREE demo trading account, click the banner below!
Trade Idea #3: Will a short squeeze in Treasuries send bond prices soaring?
The Rationale:
The 10-year Treasury yield reached a seven year high in 2018. As yields and bond prices have an inverse relationship, this has helped the price of a 10 year treasury bond reach a critical seven-year low.
China, which is the largest foreign holder of US government debt (via products like Treasuries), has been cutting its holdings of US Treasuries for most of 2018. The continued trade dispute with the Trump administration has been cited as just one of the reasons for China's selling.
However, the short positions in the Treasury market are at the highest in history creating strong trading opportunities for some well known investors.
The Trade:
According to billionaire investor Jeff Gundlach the extreme short positions in Treasuries makes it ripe for a 'short squeeze'. This is a situation where a heavily shorted asset moves sharply higher causing more short sellers to close their positions further accelerating the move upward - and it seems it has already started.
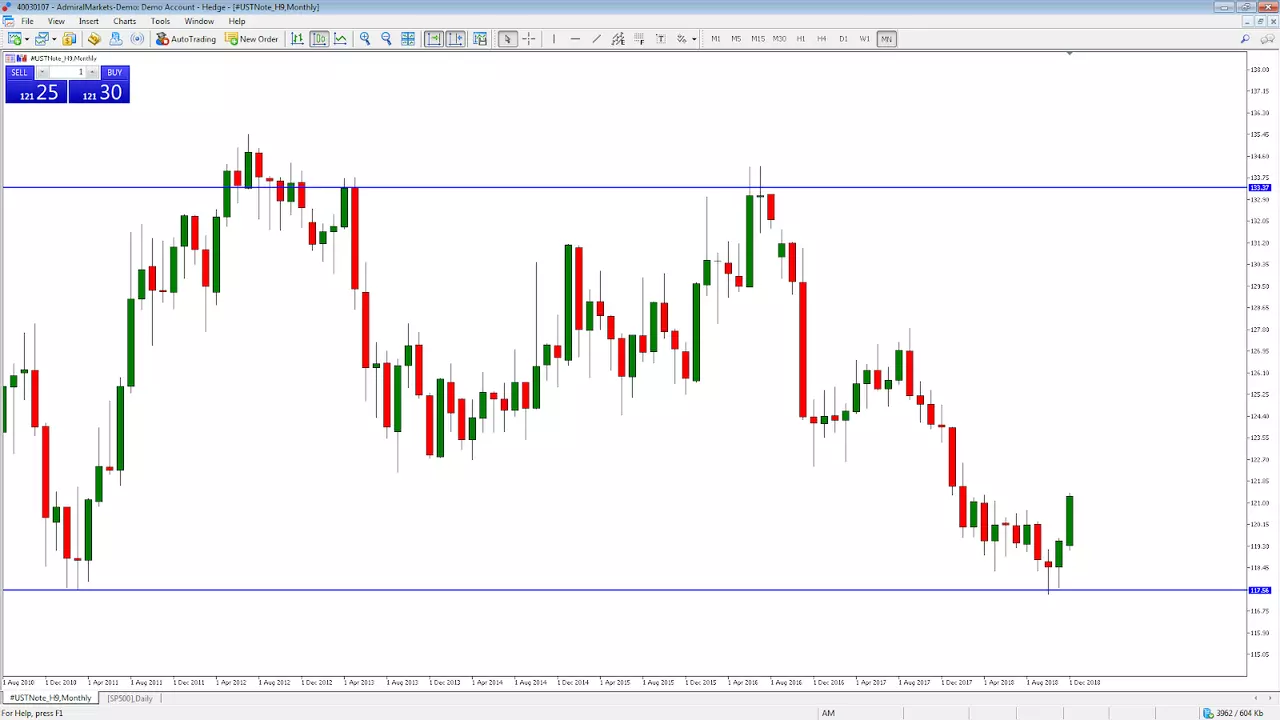
Source: Admiral Markets MetaTrader 5 Supreme Edition - USTNote_H9, Monthly Chart - Data range: 1 Aug 2010 - 19 December 2018 - Performed on 19 December 2018 at 10:22 PM GMT
Please note: Past performance is not a reliable indicator of future results, or future performance.
In the chart above, we can see that the 10-year Treasury Bond CFD is trading in between two horizontal lines - highlighted in blue - that represent historical highs and lows. Current price action shows price moving up as the short squeeze plays out.
Some traders will be looking to add to long positions with an eye for targeting the upper horizontal line at $133.37. To add further fuel to the move, if stock markets do crash in 2019 there is a tendency for investors to run to the safe haven of - you guessed it - Treasury bonds.
Trade Idea #4: Will Trump crash the US dollar?
The Rationale:
The US dollar spent much of 2018 moving higher thanks to rising interest rates from US Federal Reserve policy. However, according to JP Morgan Asset Management, who manage over $1.7 trillion, the dollar could slump in the second half of 2019 and it could last for years.
So why the negativity surrounding the US dollar?
First off, US president Donald Trump has been blasting Federal Reserve Chairman for increasing interest rates - stating that a higher dollar makes them less competitive in global economic trade.Secondly, some investment banks are forecasting a cooling of in US economic growth and a possible pause in the Federal Reserve's hiking cycle. Both factors will cause investors to move their money into currencies and markets with better growth prospects - possibly sending the US dollar crashing lower.
The Trade:
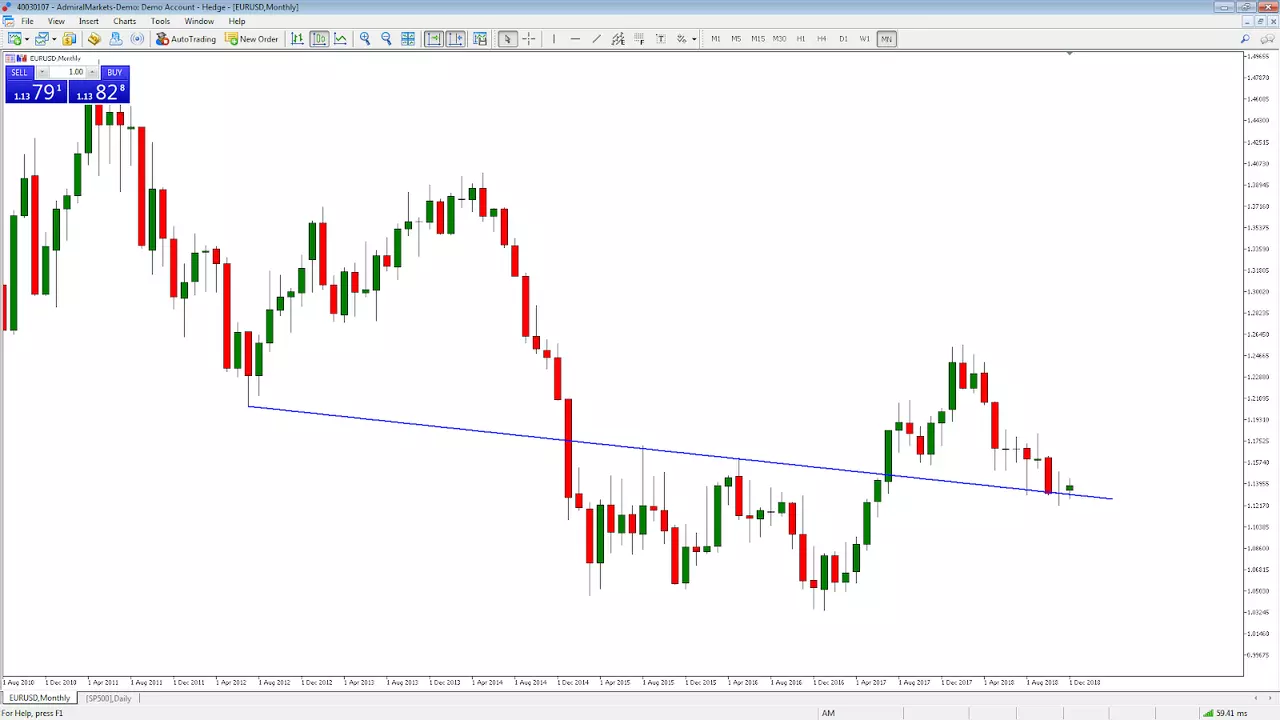
Source: Admiral Markets MetaTrader 5 Supreme Edition - EURUSD, Monthly Chart - Data range: 1 Aug 2010 - 19 December 2018 - Performed on 19 December 2018 at 10:22 PM GMT
Please note: Past performance is not a reliable indicator of future results, or future performance.
The screenshot above shows a chart of the EURUSD currency pair. When prices rise the euro is strengthening against the US dollar. When prices are falling the US dollar is strengthening against the euro.
After spending much of 2018 falling lower, the pairing has held at lower support - highlighted by the blue line. Sellers have struggled to break this level for the past four months. It seems it is just a matter of time before buyers take control making 2019 a big year for the euro currency and a possibly shocking year for the US dollar.
Trade Idea #5: Oil. The comeback king of 2019?
The Rationale:
In the last quarter of 2018 oil prices crashed more than 30% lower - making it the worst plunge since the 2008 financial crisis. But, is a reversal of fortune on the cards for the struggling black gold? Goldman Sachs seem to think so.
The investment bank has put a rebound in brent crude oil prices at the top of its list for trade ideas in 2019. And this was before the 7 December OPEC and Russia meeting where the cartel of oil-rich nations agreed to take off 1.2 million barrels of oil from the market every day for the first six months of 2019. While this news was highly favourable for Goldman's long-term call, what do the charts now tell us?
The Trade:
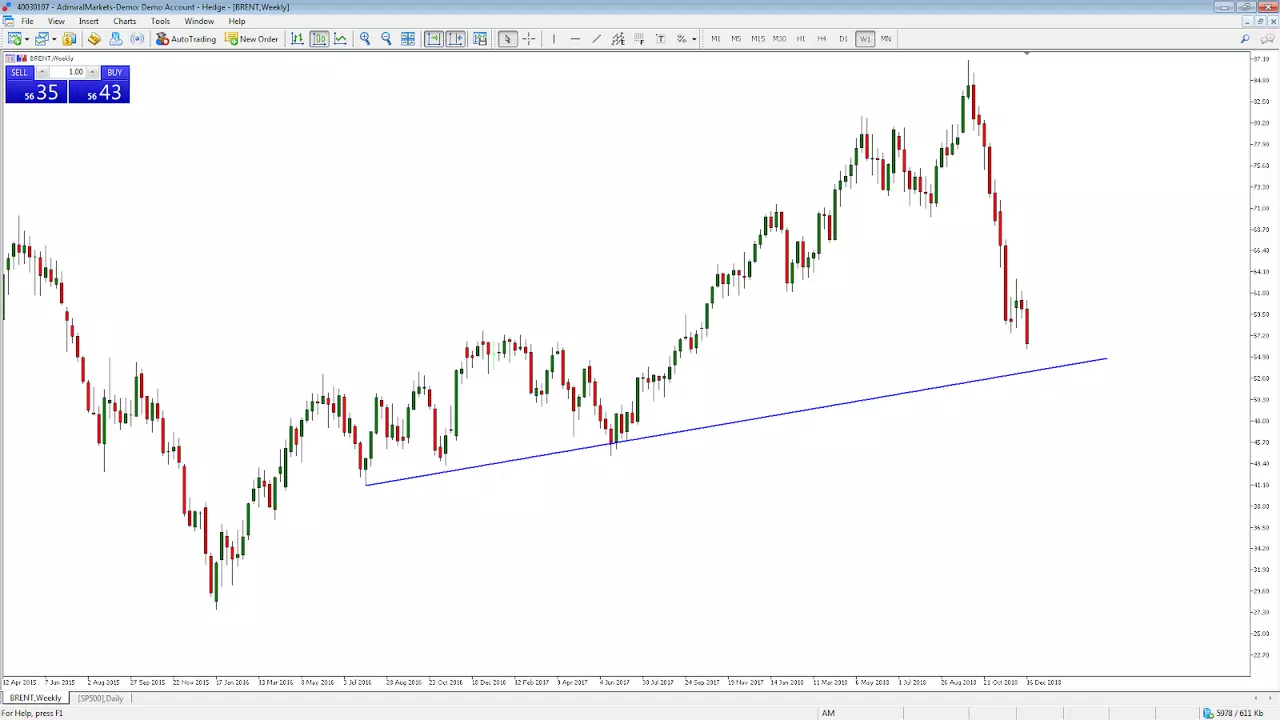
Source: Admiral Markets MetaTrader 5 Supreme Edition - BRENT, Weekly Chart - Data range: 12 April 2015 - 19 December 2018 - Performed on 19 December 2018 at 11:03 PM GMT
Please note: Past performance is not a reliable indicator of future results, or future performance.
In the above chart of brent crude oil, the aggressive fall in prices in the latter part of 2018 is clear. While investment banks may be bullish on prices in the long term, the market may keep on falling down to the lower trend line support highlighted in blue.
However, this could be the big buy opportunity for the first set of buyers to step in to the market. Analysing price action at these levels will be key in determining whether other buyers are going to join in and make oil the comeback king of 2019. Watch this space.
Trade Idea #6: Will 2019 see a resurgence in cryptocurrency prices?
The Rationale:
It was only in 2017 that Bitcoin led the cryptocurrency market soaring higher to over 2,000% at its peak. However, it only took a year for over $700 billion to be wiped off the market in the great cryptocurrency crash of 2018. But with cryptocurrencies trading at yearly lows is anyone betting big on cryptos in 2019? There are a few.
Hot new startup, Bakkt, is getting cryptocurrency and Bitcoin traders very excited. The new company has been launched by the New York Stock Exchange's owner - the Intercontinental Exchange - and has backing from heavyweights such as Microsoft and Starbucks.
Given their backing from the Intercontinental Exchange, Bakkt aims to bring proper infrastructure and regulation to the tarnished crypto market. And they aren't planning to stop there. They have also teamed up with Starbucks so sometime in the near future you'll be paying for coffee by swiping your Bitcoin app.
The Trade:
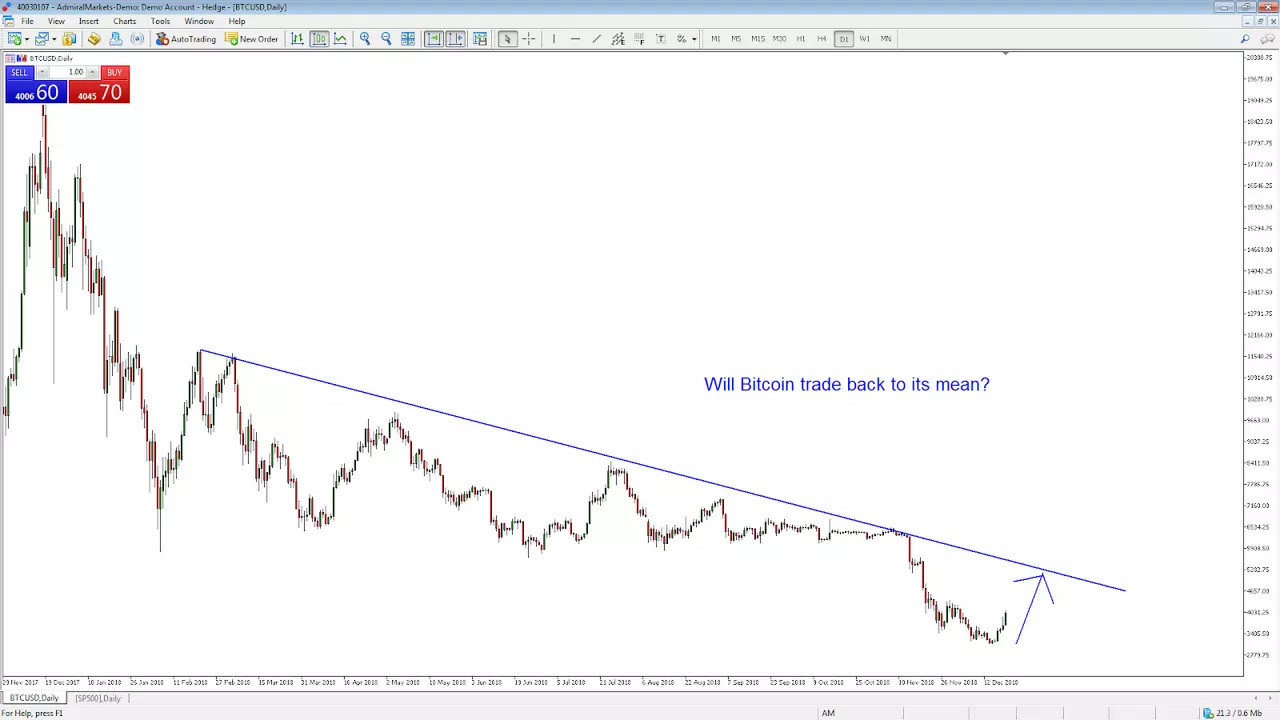
Source: Admiral Markets MetaTrader 5 Supreme Edition - BTCUSD, Daily Chart - Data range: 29 November 2017 - 20 December 2018 - Performed on 20 December 2018 at 3:03 PM GMT. Please note: Past performance is not a reliable indicator of future results, or future performance.
Buyers of Bitcoin have been encouraged by this recent news, as prices rallied higher towards the latter part of 2018. With key technical resistance above - highlighted by the blue line - it seems that buyers have short term control of the market. A break above this and 2019 may be known as the year of the cryptocurrency resurgence. How will you be trading it?
Trade Cryptocurrency CFDs With Admiral Markets
Are you ready to join the growing cryptocurrency market?
Admiral Markets enables professional traders to trade 24 hours a day, 7 days a week with the EUR and crypto cross, as well as the ability to go long or short on any cryptocurrency CFDs, with no actual crypto assets required for trading. Trade CFDs on BTCEUR, ETHEUR, XRPEUR, BTCUSD, and many more! Click the banner below to open an account and start trading!
Trade Idea #7: Can 2018's $20.5 billion worth of inflows into emerging markets continue in 2019?
The Rationale:
Inflows into emerging market ETFs have risen to over $20.5 billion for 2018. The ETFs, or Exchange Traded Funds, invest across a wide variety of developing nations and commodities. The week ending 23 November also marked the sixth consecutive week of inflows into emerging market ETFs - and this bullishness has not gone unnoticed.
Investment bank Morgan Stanley is so bullish on the sector that they gave it a 'double upgrade'. They join other investors such as Aberdeen Standard Investments, Goldman Sachs Asset Management and BlackRock Inc in looking at the potential of emerging markets for 2018.
The Trade:
One of the best places to look for exposure to emerging markets is through the use of ETFs. For example, the Vanguard FTSE Emerging Market ETF CFD tracks the price of this fund which invests into large and mid cap companies in multiple emerging markets in Europe, Asia, Africa, Central and South America and the Middle East.
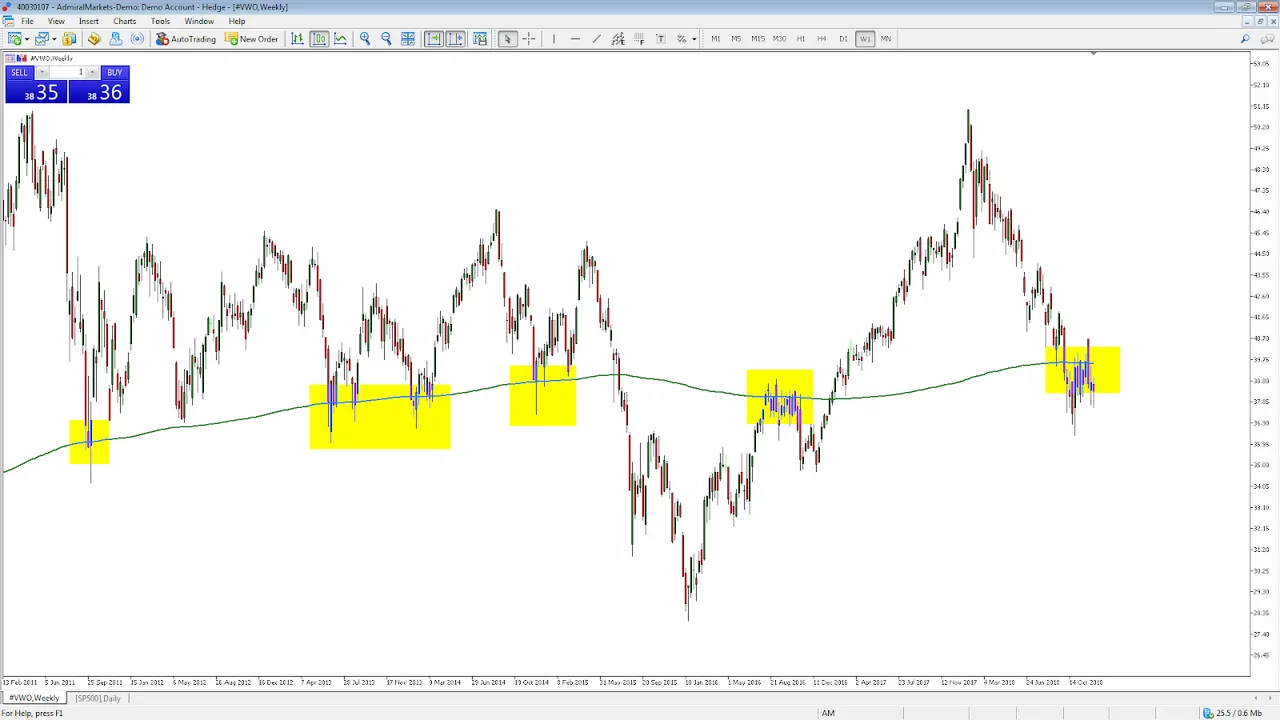
Source: Admiral Markets MetaTrader 5 Supreme Edition - #VMO, Weekly Chart - Data range: 13 February 2011 - 20 December 2018 - Performed on 20 December 2018 at 3:19 PM GMT. Please note: Past performance is not a reliable indicator of future results, or future performance.
In the above chart of the Vanguard FTSE Emerging Market ETF CFD, there has been a lot of interaction with the weekly 500 simple moving average. The market has bounced eight times off the moving average and broken three times. If buyers can get above the moving average - and stay above- then we may see billions of dollars worth of additional inflows into emerging markets. Then the question is whether you want to participate in it or not?
Trade Idea #8: Will Brexit save the British pound?
The Rationale:
The UK is set to leave the European Union on the 29 March 2019 at 11pm. Recently, the British pound has experienced heightened volatility due to the uncertainty on the future trading relationship between the UK and the EU.
The beginning of 2019 will be key to future direction of the British pound. UK prime minister Theresa May is due to put her deal to parliament for a vote. After cancelling the last vote due to the high possibility of the deal not being voted through it is the last obstacle that stands in between a deal or no-deal Brexit.
The Trade:
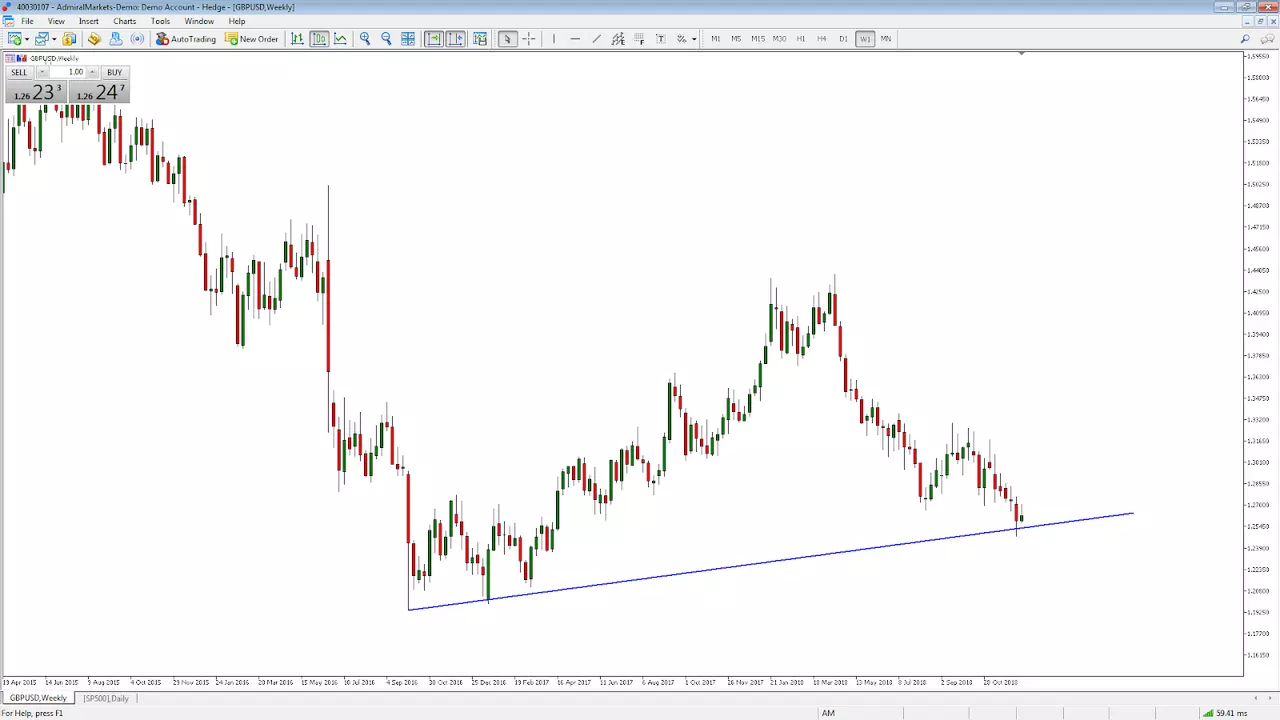
Source: Admiral Markets MetaTrader 5 Supreme Edition - GBPUSD, Weekly Chart - Data range: 19 April 2015 - 19 December 2018 - Performed on 19 December 2018 at 11:45 PM GMT. Please note: Past performance is not a reliable indicator of future results, or future performance.
In the chart of GBPUSD above, the currency pairing is ending 2018 at a critical juncture. The fall in the pair has been held at the lower trend line support - highlighted in blue. If traders can hold above this level then the British pound may find some support to push higher. If that is the case, any short sellers will look to exit their positions creating a possible short squeeze and the beginning of a huge turnaround story for the currency.
Trade Idea #9: Is it time to like Facebook again?
The Rationale:
On the 26 July 2018 Facebook shocked the market after admitting a significant decline in user growth after the Cambridge Analytica breach of 87 million Facebook users. This helped the stock to wipe off over $119 billion in their market cap. Since then, the stock has continued to decline in the broader tech market sell off, with the most recent data privacy exposé resulting in another 7% hit to the share price.
However, is it time to like the stock again?
In Facebook's third quarter earnings report for 2018 the numbers reflected a return to stability in their user base after three million European users left the social media platform earlier in the year. The company also seem to be taking recent events very seriously by doubling their safety and security staff from 10,000 to 20,000.
The Trade:
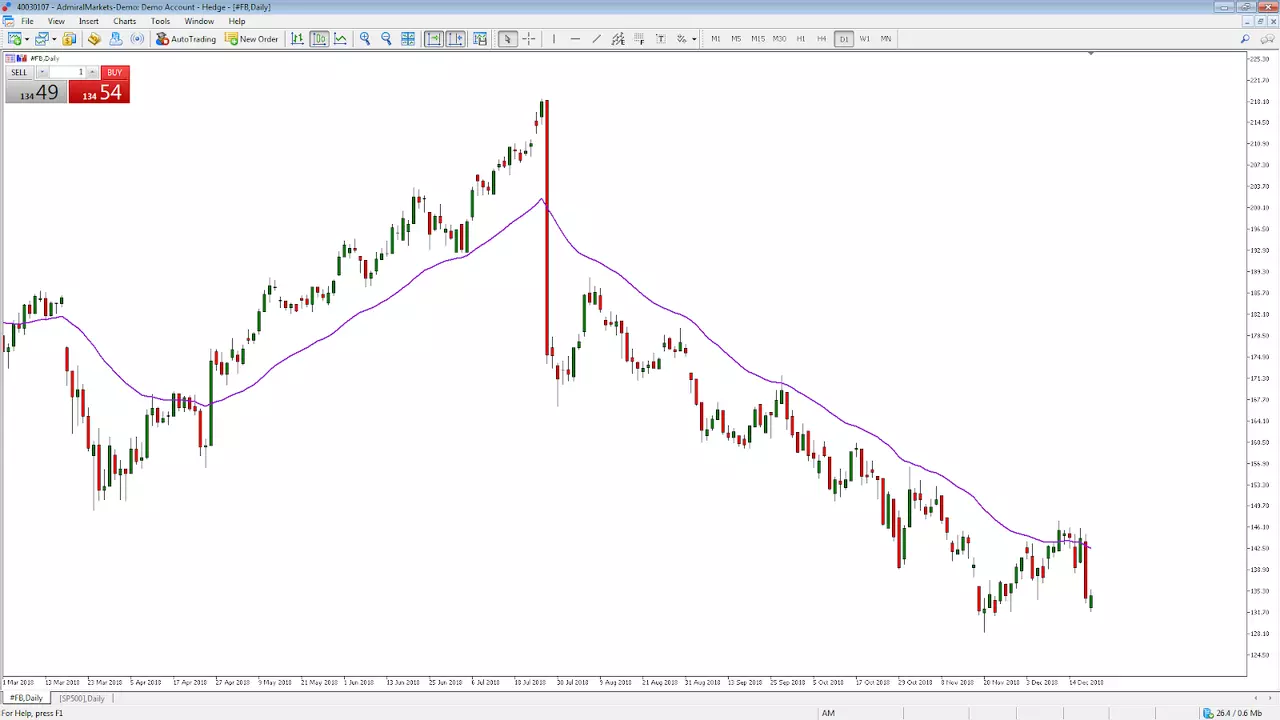
Source: Admiral Markets MetaTrader 5 Supreme Edition - #FB Weekly Chart - Data range: 19 April 2015 - 19 December 2018 - Performed on 19 December 2018 at 11:45 PM GMT.
Please note: Past performance is not a reliable indicator of future results, or future performance.
In the chart above of the Facebook CFD, sellers still remain in control of the market. Buyers have struggled to break through the 34 exponential moving average - highlighted in purple. If traders are starting to like Facebook again, then the market will be looking for buyers to take control by trading above this moving average. Then it's up to the company to turn themselves around and attract even more buyers to the stock.
Trade Idea #10: The new STARS of the financial world
CNBC host Jim Cramer famously coined the term FANG for four of the hottest tech stocks at the time: Facebook, Amazon, Netflix and Google. However, while some stocks fared well for 2018, others haven't.
And now there is a new acronym in town that has piqued the interest of stock traders - the STARS group of stocks. It includes:
- Shopify
- Trade Desk
- Adobe
- Roku
- Square
The likes of Shopify and Square only became public and available to trade in 2015. Square made its public debut in 2016. While these companies are very young, they're available to trade with Admiral Markets. Maybe one of these market leading internet-service stocks could be the next big thing in 2019 - how are you preparing for it?
Trade on MetaTrader 5 With Admiral Markets
Admiral Markets offers the ability to trade with MetaTrader 5 in your browser, or to download the entire platform for FREE! Gain access to real-time market data, technical analysis, insight from professional trading experts, and thousands of trading instruments to trade and invest with. Start your trading journey the right way, click the banner below to get started!
The given data provides additional information regarding all analysis, estimates, prognosis, forecasts or other similar assessments or information (hereinafter "Analysis") published on the website of Admiral Markets. Before making any investment decisions please pay close attention to the following:
- This is a marketing communication. The content is published for informative purposes only and is in no way to be construed as investment advice or recommendation. It has not been prepared in accordance with legal requirements designed to promote the independence of investment research, and that it is not subject to any prohibition on dealing ahead of the dissemination of investment research.
- Any investment decision is made by each client alone whereas Admiral Markets Group AS investment firms (Admiral Markets) shall not be responsible for any loss or damage arising from any such decision, whether or not based on the content.
- The Analysis is prepared by an independent analyst (hereinafter "Author") based on the Author's personal estimations.
- To ensure that the interests of the clients would be protected and objectivity of the Analysis would not be damaged Admiral Markets has established relevant internal procedures for prevention and management of conflicts of interest.
- Whilst every reasonable effort is taken to ensure that all sources of the content are reliable and that all information is presented, as much as possible, in an understandable, timely, precise and complete manner, Admiral Markets does not guarantee the accuracy or completeness of any information contained within the Analysis.
- Any kind of past or modeled performance of financial instruments indicated within the content should not be construed as an express or implied promise, guarantee or implication by Admiral Markets for any future performance. The value of the financial instrument may both increase and decrease and the preservation of the asset value is not guaranteed.
- Leveraged products (including contracts for difference) are speculative in nature and may result in losses or profit. Before you start trading, you should make sure that you understand all the risks.

