OPEC Responds to Oil’s 30% Crash. What’s next?

Oil prices crashed over 30% lower in the last quarter of 2018, making it the worst plunge since the 2008 financial crisis. However, there were some glimmers of hope for the oil market at the G20 Summit in Argentina on 1 December, where Russian president Vladimir Putin and Saudi Arabia's Crown Prince Mohammed bin Salman agreed to cooperate and rebalance the world's oil market.
All eyes were then firmly fixed on the 7 December OPEC meeting at their headquarters in Vienna, Austria. The cartel of oil-rich nations that control the world's oil supply were to hash out a deal to stop the crash in oil prices. However, deep divisions between the alliance were laid bare as they struggled to reach an agreed amount to cut oil production.
It was only on the second day of the meeting that they finally managed to agreed to a cut in production levels. The agreement was to take 1.2 million barrels of oil off from the market per day for the first six months of 2019. 800,000 barrels per day came from the 15 nation strong OPEC cartel with Russia and other allied producers committing to a 400,000 barrel per day reduction.
How did the oil market respond to OPEC production cuts?
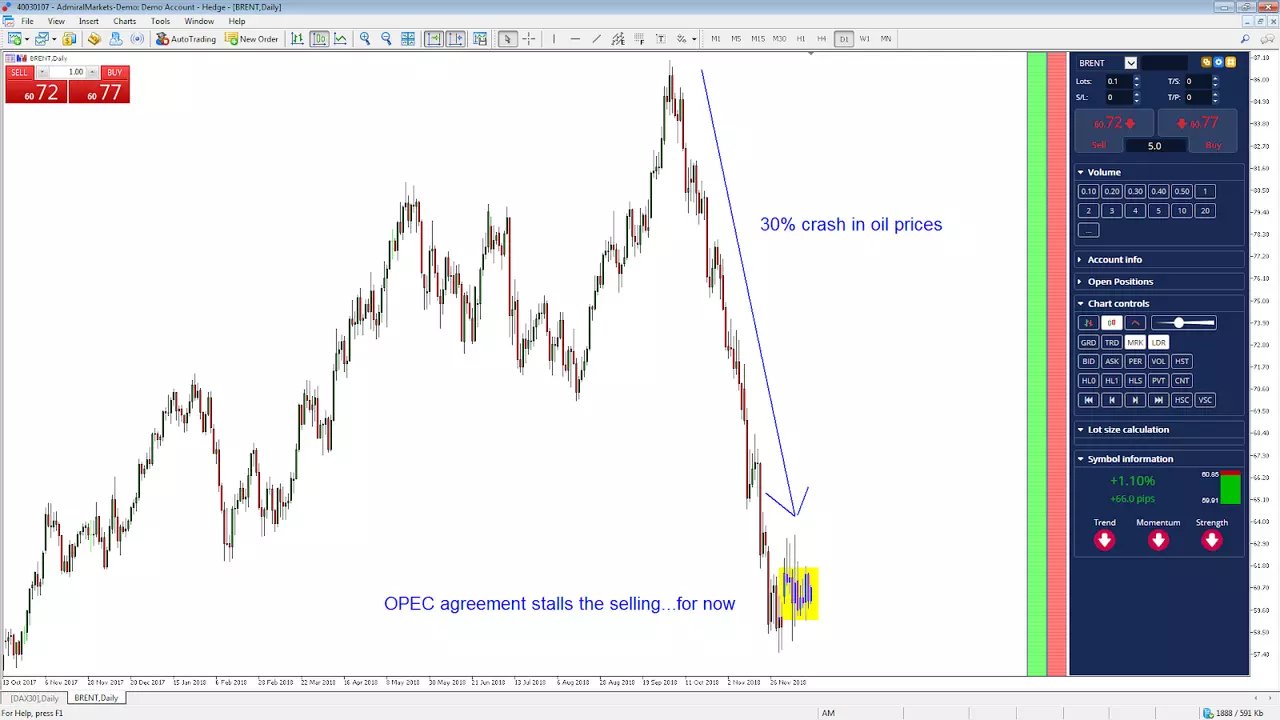
Source: Admiral Markets MT5 Supreme Edition BRENT, Daily - Data range: from 13 October 2017 - 17 December 2018 - performed on 17 December 2018 at 11:33 AM GMT. Please note: Past performance is not a reliable indicator of future results.
In the chart of brent crude oil, it's clear to see the 30% crash lower in oil prices. The yellow box highlights the time period where the marke was expecting some action to be taken by OPEC, as well as the final decision from them to cut oil production for the first six months of 2019.
OPEC's decision has done well to stall the velocity of selling prior to their meeting but still doesn't leave any clue as to the future direction. After all, the market has been trading in a sideways range for the first half of December. However, that can be quite useful for shorter term traders. Let's discuss how short term traders could take advantage of this.
Short term trading opportunities in the oil market
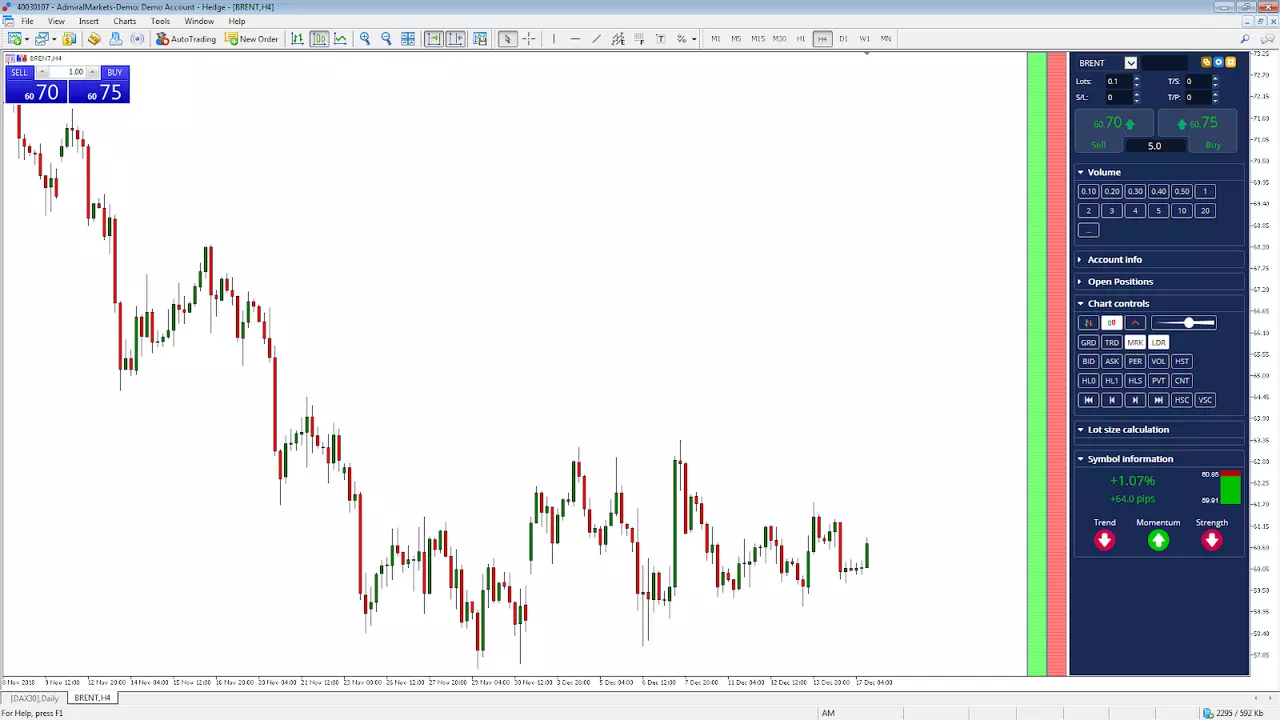
Source: Admiral Markets MT5 Supreme Edition BRENT, H4 - Data range: from 8 November 2018 - 17 December 2018 - performed on 17 December 2018 at 11:42 AM GMT. Please note: Past performance is not a reliable indicator of future results.
The screenshot above shows the four hour chart of the brent crude oil market during the G20 summit and OPEC meeting. We can see that after the 30% drop in oil prices, the market traded in a range between the two meetings. While longer-term traders may struggle for direction, shorter-term traders can use technical analysis to identify possible trading opportunities.
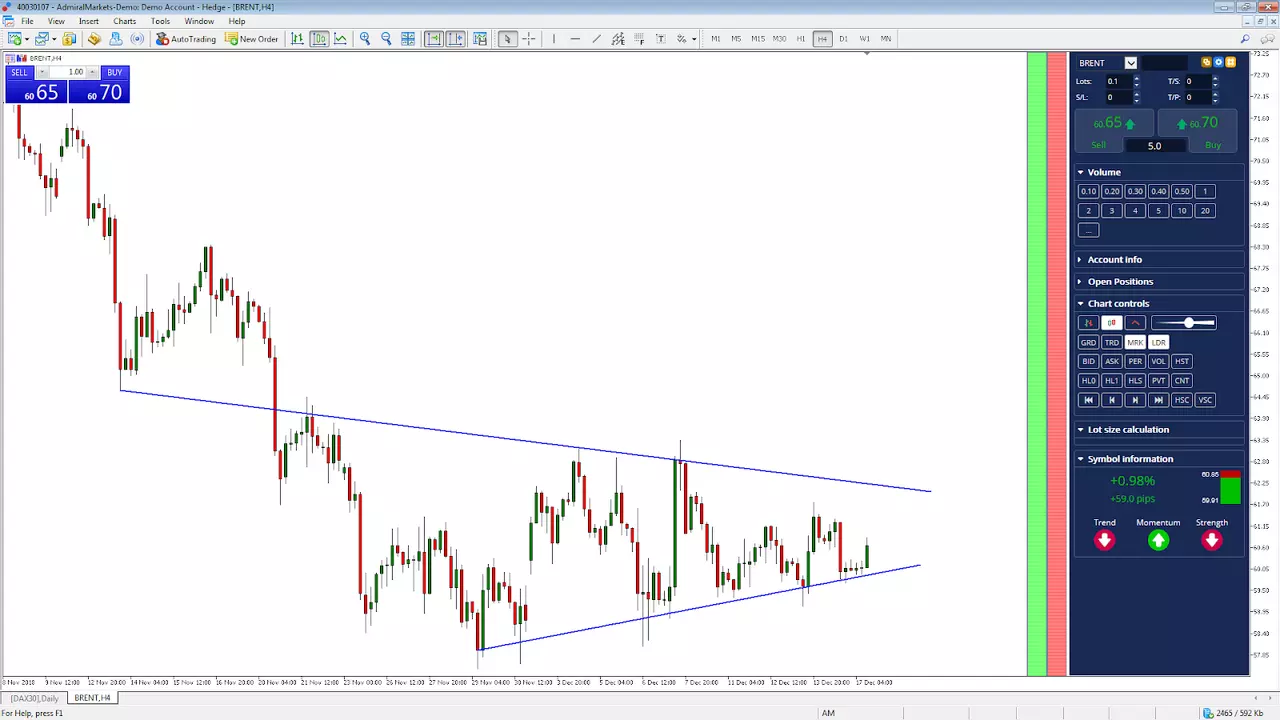
Source: Admiral Markets MT5 Supreme Edition BRENT, H4 - Data range: from 8 November 2018 - 17 December 2018 - performed on 17 December 2018 at 11:45 AM GMT. Please note: Past performance is not a reliable indicator of future results.
By using technical analysis tools such as support and resistance lines, as highlighted in blue, shorter-term traders can identify possible turning points in the market. Essentially, these lines help us to identify the limits of buyers and sellers in the market. This is known as a range-based, or consolidated, market and is a market condition in which traders will trade in between the lines until the market breaks out in either direction.
How could short-term traders take advantage of support and resistance lines?
We already know that the market has a high probability chance of turning at support and resistance lines, before eventually breaking through. So how could traders use these lines for entry and stop loss levels?
- By using price action based strategies which highlight specific chart patterns that represent possible reversals
- By entering market or limit orders, using the advanced features of the Supreme Edition plugin available for MetaTrader 4 and MetaTrader 5 as well as free tools such as the Average True Range Indicator for stop loss placement
- By using a combination of price action strategies and advanced risk management features
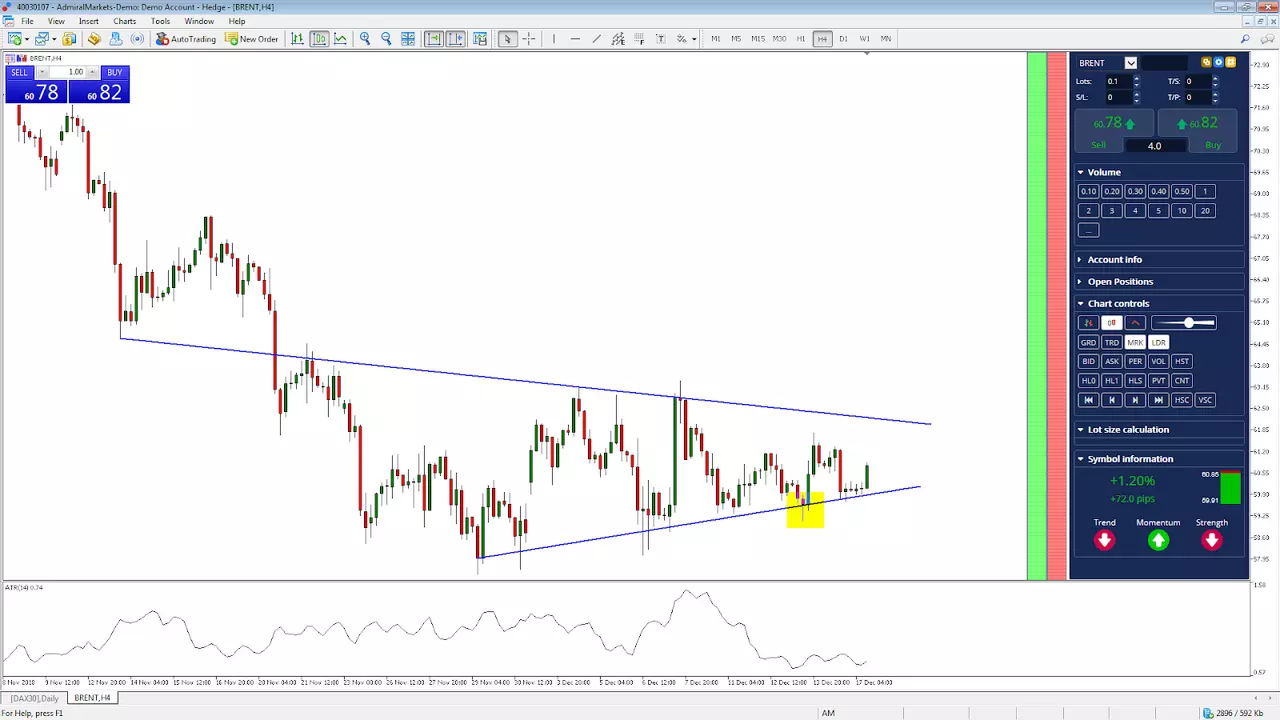
Source: Admiral Markets MT5 Supreme Edition BRENT, H4 - Data range: from 8 November 2018 - 17 December 2018 - performed on 17 December 2018 at 11:55 AM GMT. Please note: Past performance is not a reliable indicator of future results.
In the highlighted yellow box, the market presents a very popular type of a price action pattern called a 'pin bar'. A trader could enter on the close of this bar as it also rejects the lower blue support line. Using the default setting of 14 for the ATR a stop loss could be placed $0.70 lower which is the average true range of the last fourteen bars.
This would result in an entry price of $59.60 and a stop loss at $58.90. If the entry price was triggered and then the stop loss was triggered, trading 1 lot would result in a loss of $70. In this instance, the stop loss was not triggered. If the trader stayed in until the previous high point at $61.13, this would have resulted in a profit of $153.
How to quickly improve your short term trading today
Risk management is essential to the success of any consistently profitable trader. After all, trading is about winning and losing so it is imperative traders stay in the game long enough to allow probabilities to work in their favour. A quick way to improve your trading today is to use a trading calculator so you can manage your risk properly and always know how much you stand to win or lose on any trade you take.
The given data provides additional information regarding all analysis, estimates, prognosis, forecasts or other similar assessments or information (hereinafter "Analysis") published on the website of Admiral Markets. Before making any investment decisions please pay close attention to the following:
- The analysis is published for informative purposes only and are in no way to be construed as investment advice or recommendation.
- Any investment decision is made by each client alone whereas Admiral Markets shall not be responsible for any loss or damage arising from any such decision, whether or not based on the Analysis.
- Each of the Analysis is prepared by an independent analyst (hereinafter "Author") based on the Author's personal estimations.
- To ensure that the interests of the clients would be protected and objectivity of the Analysis would not be damaged Admiral Markets has established relevant internal procedures for prevention and management of conflicts of interest.
- Whilst every reasonable effort is taken to ensure that all sources of the Analysis are reliable and that all information is presented, as much as possible, in an understandable, timely, precise and complete manner, Admiral Markets does not guarantee the accuracy or completeness of any information contained within the Analysis. The presented figures refer that refer to any past performance is not a reliable indicator of future results.
- The contents of the Analysis should not be construed as an express or implied promise, guarantee or implication by Admiral Markets that the client shall profit from the strategies therein or that losses in connection therewith may or shall be limited.
- Any kind of previous or modeled performance of financial instruments indicated within the Publication should not be construed as an express or implied promise, guarantee or implication by Admiral Markets for any future performance. The value of the financial instrument may both increase and decrease and the preservation of the asset value is not guaranteed.
- The projections included in the Analysis may be subject to additional fees, taxes or other charges, depending on the subject of the Publication. The price list applicable to the services provided by Admiral Markets is publicly available from the website of Admiral Markets.
- Leveraged products (including contracts for difference) are speculative in nature and may result in losses or profit. Before you start trading, you should make sure that you understand all the risks.

