DAX attacks 11,000 on COVID-19 cure hopes - sustainable?
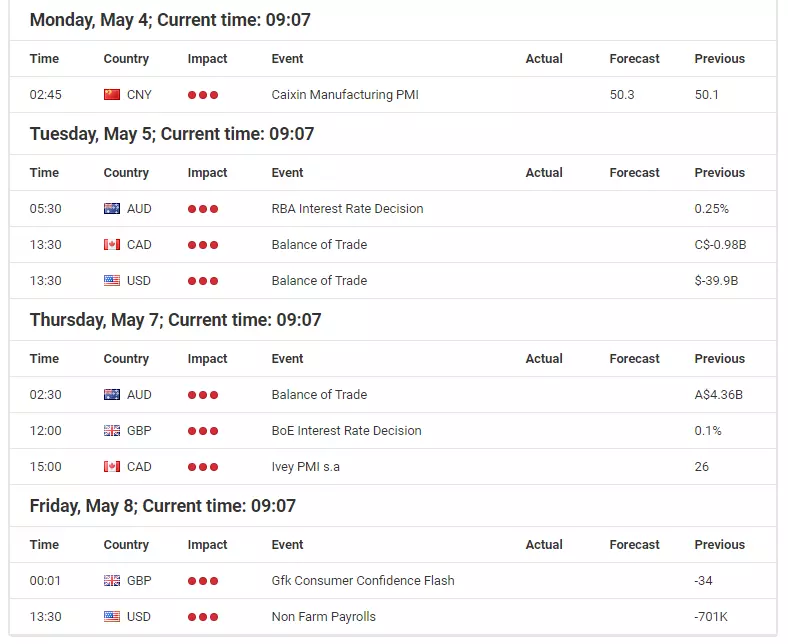
Source: Economic Events Calendar May 4–8, 2020 - Admiral Markets' Forex Calendar
DAX30 CFD
The German DAX30 continued with its surprisingly bullish performance over the last week of trading, despite ongoing turbulence in oil markets and US GDP data indicating a shrinkage of an annualized 4.8% in Q1, ending the longest period of expansion in the country's history.
In fact, it was the steepest pace of contraction in GDP since Q4/2008 and much worse than market consensus of a 4.0% slump.
The squeeze back above 11,000 points was driven mainly by rumours that Gilead announced that early results of a coronavirus drug trial has shown improvement with shorter Remdesivir treatment, fuelling hopes that we might be headed towards an effective drug treatment against Covid-19.
But, again: speculations around Remdesivir being a potential and effective Coronavirus treatment are not new and we'd like to emphasize that one should potentially be careful in being too hopeful and optimistic.
We are still careful in terms of DAX30 CFD long engagements, even though short-term and technically we stay positive as long as the German index trades above 10,100/150 points.
After the bearish performance post the ECB last Thursday, we have to see whether the German index can hold above 10,800 points. If so, a sustainable run above 11,000 points makes a test of the region around 11,450/500 points possible:
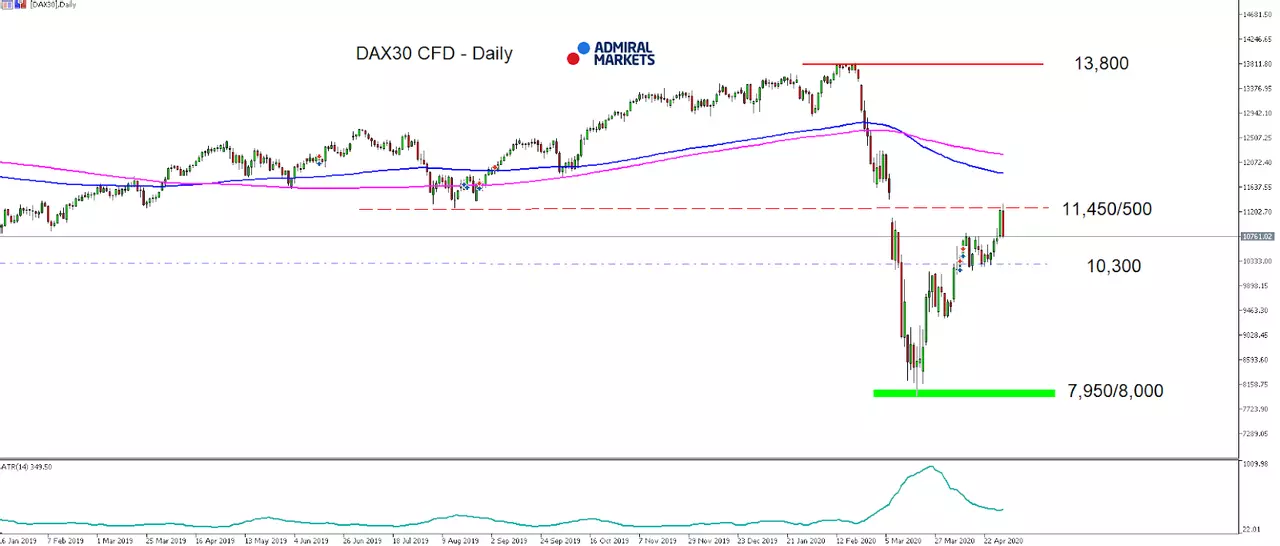
Source: Admiral Markets MT5 with MT5-SE Add-on DAX30 CFD Daily chart (between January 16, 2019, to May 1, 2020). Accessed: May 1, 2020, at 10:00pm GMT - Please note: Past performance is not a reliable indicator of future results, or future performance.
In 2015, the value of the DAX30 CFD increased by 9.56%, in 2016, it increased by 6.87%, in 2017, it increased by 12.51%, in 2018, it fell by 18.26%, in 2019, it increased by 26.44% meaning that after five years, it was up by 34.2%.
Check out Admiral Markets' most competitive conditions on the DAX30 CFD and start trading on the DAX30 CFD with a low 0.8 point spread offering during the main Xetra trading hours!
US Dollar
While last week's release of the US GDP data and Fed rate decision certainly had the potential to trigger elevated volatility, market participants were a little disappointed to see the subdued market rection, so the picture in the US dollar Index Future remains similar compared to last week.
There, we had a very sceptical outlook in regards to the US dollar, which potentially intensified over the last week again, especially after Wednesday's US GDP came in at -4.8% (QoQ) against -4% expected.
The disappointing print results came mainly out of the Corona lockdown, indicating the first signs of an economic downturn, even though the data set is only an initial estimate for Q1/2020, and the Corona lockdown was only being relevant for the last two weeks of the first quarter.
While the Fed re-emphasized the Status Quo, the Fed statement still made clear that a worsening economic situation could leave the US central bank considering further monetary stimulus and ballooning the balance even further with the target to guide markets and the economy through the coronavirus crisis.
Still, the main reason for the solid USD Index Future performance is most likely the still mixed performance of the Euro which leaves the Greenback, despite the dark fundamental picture with further upside potential if we get to see a drop lower in the Euro, making another stint higher with a target around 105.00 points an option.
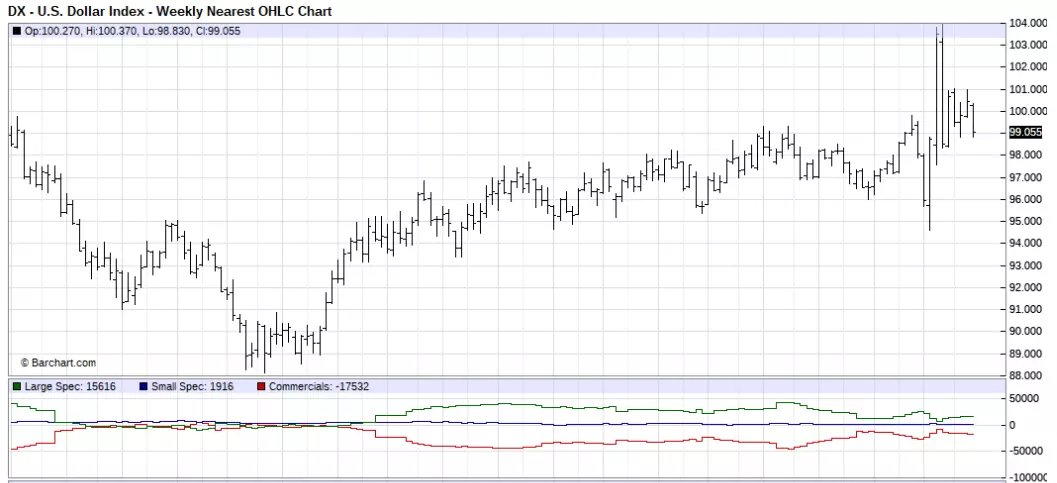
Source: Barchart - U.S Dollar Index - Weekly Nearest OHLC Chart (between January 2017 to May 2020). Accessed: May 1, 2020, at 10:00 PM GMT
Don't forget to register for the weekly "Trading Spotlight" webinar with presenters including Jens Klatt, every Monday, Wednesday and Friday at 2pm London time! It's your opportunity to follow Jens and others as they explore the weekly market outlook in detail, so don't miss out!
Euro
The focus over the last week of trading was clearly on the ECB. The European central bank was certainly under pressure after EU policymakers failed to reach a consensus on the details of a 1 trillion euro emergency fund to tackle an economic downturn resulting out of the Corona lockdown.
But the ECB did not really deliver, did not raise the size of its emergency bond-buying package (PEPP), but kept it at 750 billion Euro. Instead, it eased conditions on TLTRO III operations between June 2020 to June 2021 to 50 basis points below the average interest rate on the Eurosystem's main refinancing operations, what means that it 'only' delivers more liquidity to European banks.
In our interpretation, this is can be interpreted as a message to European member states that the ECB will only add in size to its PEPP program once the EU decides on further and significant fiscal stimulus measures.
With a little delay, the Euro took on bullish momentum, eyeing again 1.1000. But the technical mode in the EUR/USD stays choppy with a bearish touch, at least in our opinion.
As already mentioned in our last weekly market outlook, the main reason why the Euro still presents itself stable against the US dollar, especially with the massive monetary stimulus delivered from the ECB can be found in the also massively intervening Fed, which continued and will continue to balloon its balance sheet further within the next weeks and months and the weak Euro profiting from an also very weak US dollar.
That said, we are still overall short-term bearish for the European currency and consider a rather sooner than later re-test of the March lows around 1.0630 still a serious option, especially as long as we trade below 1.1000:
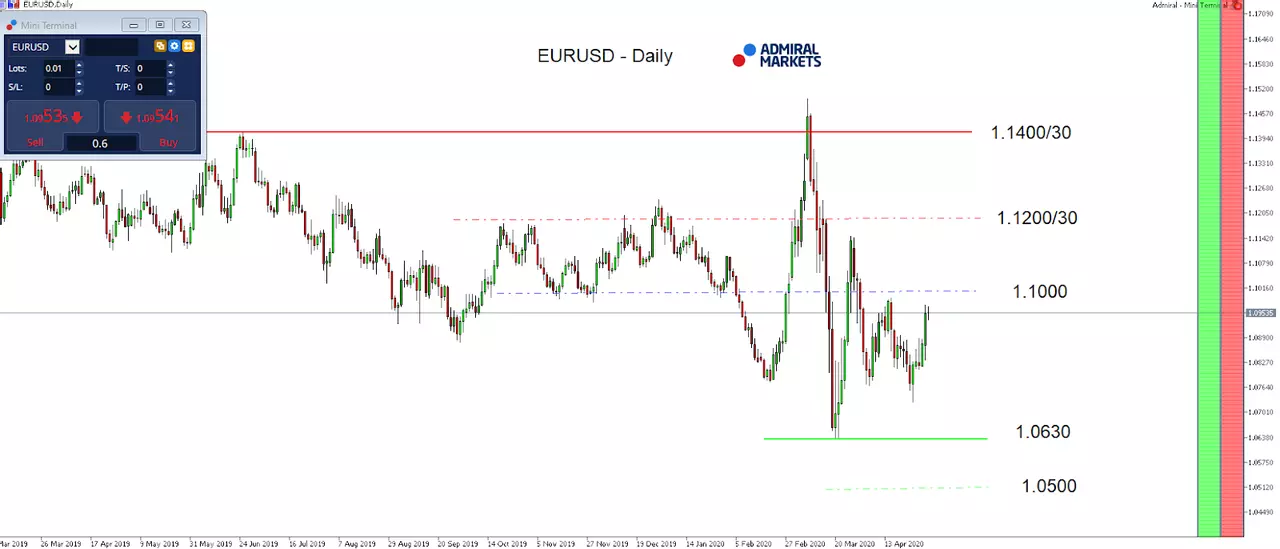
Source: Admiral Markets MT5 with MT5-SE Add-on EUR/USD Daily chart (between March 4, 2019, to May 1, 2020). Accessed: May 1, 2020, at 10:00pm GMT - Please note: Past performance is not a reliable indicator of future results, or future performance.
In 2015, the value of the EUR/USD fell by 10.2%, in 2016, it fell by 3.2%, in 2017, it increased by 13.92%, 2018, it fell by 4.4%, 2019, it fell by 2.2%, meaning that after five years, it was down by 7.3%.
JPY
The performance of the Japanese Yen against the US dollar certainly surprised with the currency pair breaking the below the short-term relevant region of support around 107.00 already before the Fed rate decision last Wednesday.
"Surprisingly", because the BoJ matched market speculation by pledging to buy unlimited amounts of government bonds and thus removing its previous target of 80 trillion yen per year.
In addition, the Bank of Japan raised the purchases of corporate and commercial debt and eased rules for what debt would qualify for these purchases.
In our opinion, that's a clear sign of JPY strength respectively underlines our overall bearish take on the USD/JPY.
The re-formulation of the Status Quo from the Fed last Wednesday came as no surprise, but in addition to the latest GDP data pointing to a more negative impact on the US economy as initially anticipated, it seems clear that a worsening situation around the US respectively global economy leaves the Fed likely to consider more monetary stimulus and ballooning the balance sheet even further.
That said, a test of the region around 105.00 and even a push lower seems a realistic option in the days and weeks to come after recent price action in the USD/JPY:
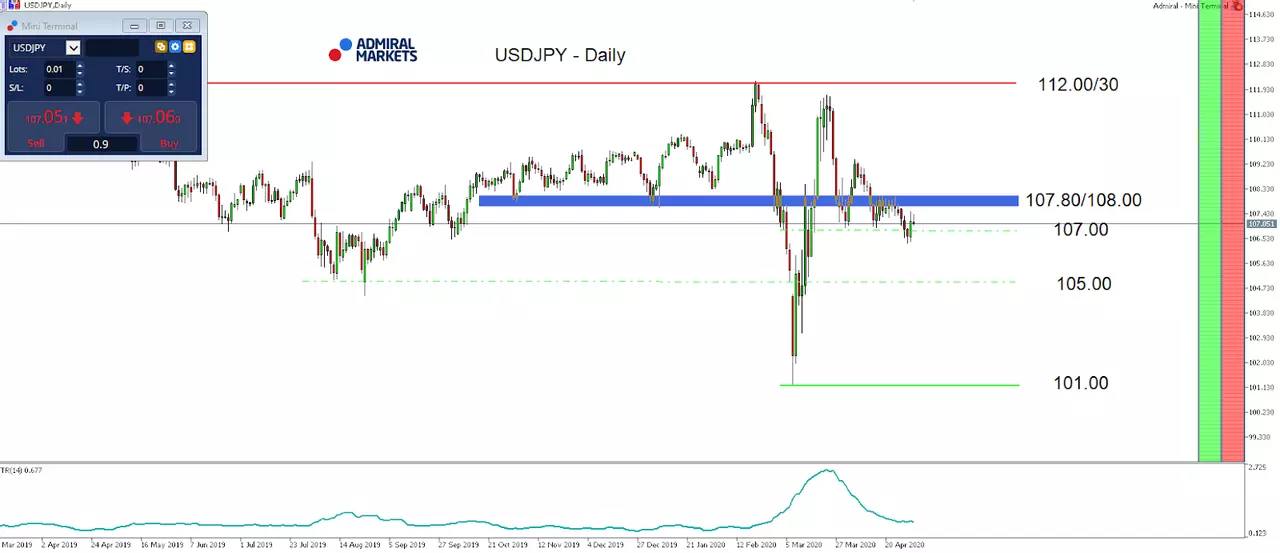
Source: Admiral Markets MT5 with MT5-SE Add-on USD/JPY Daily chart (between March 11, 2019, to May 1, 2020). Accessed: May 1, 2020, at 10:00pm GMT
In 2015, the value of USD/JPY increased by 0.5%, in 2016, it fell by 2.8%, in 2017, it fell by 3.6%, in 2018, it fell by 2.7%, in 2019, it fell by 0.85%, meaning that after five years, it was down by 9.2%.
Gold
When looking at Gold, the overall picture hasn't changed, the yellow continues to trade around 1,700 USD, even though technically with a slight bearish touch given by the bearish divergence in the RSI(14) on a daily time-frame (orange) and the weaker weekly close.
Still, we consider the midterm picture bullish, especially after Wednesday's US GDP which disappointed, came in at -4.8% against -4% expected.
The disappointing print results mainly out of the Corona lockdown showing first signs in terms of economic downturn, even though the data set is only a first estimate and here for Q1/2020 with the Corona lockdown only being relevant in the last two weeks of the first quarter.
Still, what became clear is that the lockdown obviously has a more negative impact on the US economy as initially anticipated and while the Fed announced that same day to keep its benchmark interest rate at 0.00 – 0.25%, the Fed statement still made clear that a worsening situation could leave the Fed considering further monetary stimulus and ballooning the balance even further with the target to guide markets and the economy through the coronavirus crisis.
With that in mind, we keep our bullish take on Gold, favour Long engagements from a risk-reward perspective, but also from a pure technical perspective as long as we trade above 1,440/450 USD.
If we the short-term corrective move accelerates, a potential first target around 1,650 USD while a first target on the upside can be found around 1,800 USD:
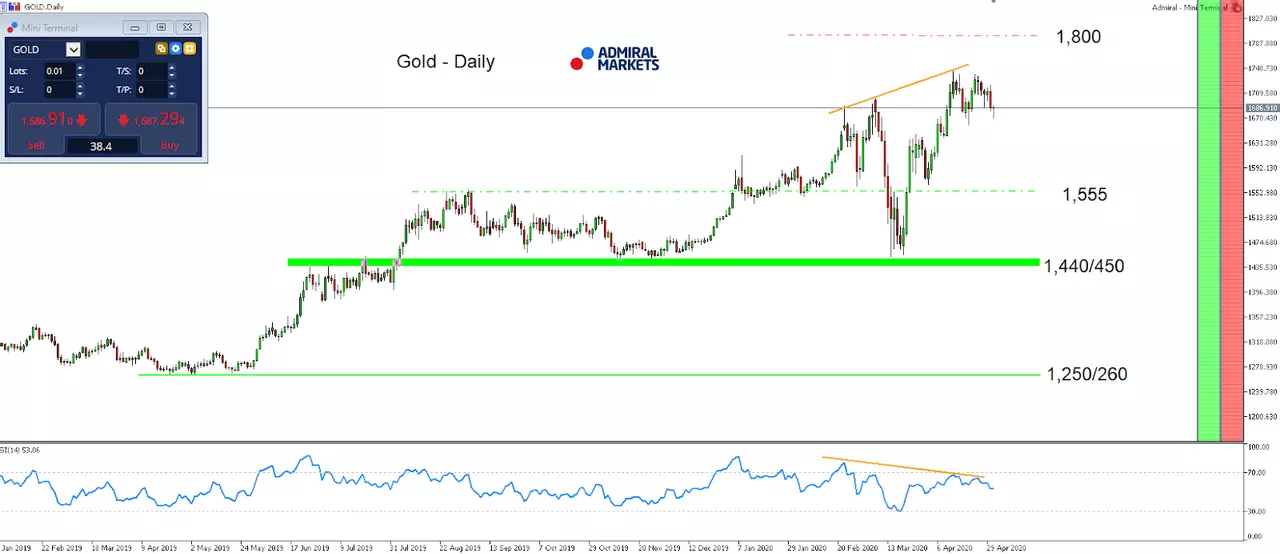
Source: Admiral Markets MT5 with MT5-SE Add-on Gold Daily chart (between January 31, 2019, to May 1, 2020). Accessed: May 1, 2020, at 10:00pm GMT - Please note: Past performance is not a reliable indicator of future results, or future performance.
In 2015, the value of Gold fell by 10.4%, in 2016, it increased by 8.1%, in 2017, it increased by 13.1%, in 2018, it fell by 1.6%, in 2019, it increased by 18.9%, meaning that after five years, it was up by 28%.
Discover the world's #1 multi-asset platform
Admiral Markets offers professional traders the ability to trade with a custom, upgraded version of MetaTrader 5, allowing you to experience trading at a significantly higher, more rewarding level. Experience benefits such as the addition of the Market Heat Map, so you can compare various currency pairs to see which ones might be lucrative investments, access real-time trading data, and so much more. Click the banner below to start your FREE download of MT5 Supreme Edition!

Disclaimer: The given data provides additional information regarding all analysis, estimates, prognosis, forecasts or other similar assessments or information (hereinafter "Analysis") published on the website of Admiral Markets. Before making any investment decisions please pay close attention to the following:
- This is a marketing communication. The analysis is published for informative purposes only and are in no way to be construed as investment advice or recommendation. It has not been prepared in accordance with legal requirements designed to promote the independence of investment research, and that it is not subject to any prohibition on dealing ahead of the dissemination of investment research.
- Any investment decision is made by each client alone whereas Admiral Markets shall not be responsible for any loss or damage arising from any such decision, whether or not based on the Analysis.
- Each of the Analysis is prepared by an independent analyst (Jens Klatt, Professional Trader and Analyst, hereinafter "Author") based on the Author's personal estimations.
- To ensure that the interests of the clients would be protected and objectivity of the Analysis would not be damaged Admiral Markets has established relevant internal procedures for prevention and management of conflicts of interest.
- Whilst every reasonable effort is taken to ensure that all sources of the Analysis are reliable and that all information is presented, as much as possible, in an understandable, timely, precise and complete manner, Admiral Markets does not guarantee the accuracy or completeness of any information contained within the Analysis. The presented figures refer that refer to any past performance is not a reliable indicator of future results.
- The contents of the Analysis should not be construed as an express or implied promise, guarantee or implication by Admiral Markets that the client shall profit from the strategies therein or that losses in connection therewith may or shall be limited.
- Any kind of previous or modeled performance of financial instruments indicated within the Publication should not be construed as an express or implied promise, guarantee or implication by Admiral Markets for any future performance. The value of the financial instrument may both increase and decrease and the preservation of the asset value is not guaranteed.
- The projections included in the Analysis may be subject to additional fees, taxes or other charges, depending on the subject of the Publication. The price list applicable to the services provided by Admiral Markets is publicly available from the website of Admiral Markets.
- Leveraged products (including contracts for difference) are speculative in nature and may result in losses or profit. Before you start trading, you should make sure that you understand all the risks.

