DAX holding above 10,000 points despite oil turbulence – calm before the storm?
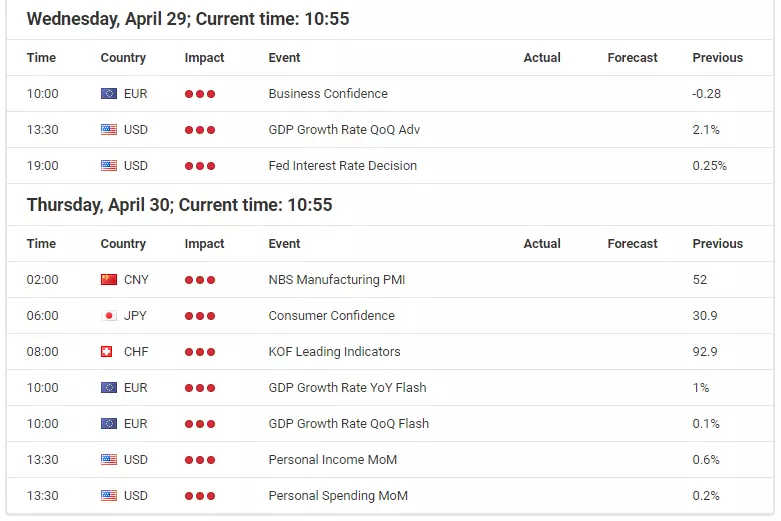
Source: Economic Events Calendar April 27 – May 1, 2020 - Admiral Markets' Forex Calendar
DAX30 CFD
The DAX30 CFD surprised us over the last week of trading: while we certainly saw some selling pressure, mainly resulting out of the developments in oil markets with the May contract settling at -37.63 USD/BBL, the German index still held significantly above 10,000 points.
While it is definitely not correct to call the price action in WTI to be representative in terms of future market conditions, it is nevertheless worth noting that it points to oil storage capacities becoming unavailable.
That said, further declines in the upcoming WTI contracts seem likely, resulting in turbulence around the globe, may it be with the US Fracking industry facing trouble, insolvencies and bankruptcies, of the Middle East with Saudi Arabia facing potential political instabilities, etc.
That in mind, leaves us careful in terms of DAX30 CFD long engagements, even though short-term and technically we stay positive (even though with a neutral touch) as long as the German index holds above 10,100/150 points.
A drop below that level again leaves room for an accelerating drop which targets the region around 9,300 respectively 9,150/200 points in the days to come.
On the upside a push above 10,800 points activates 11,000 points as a next target, opening even further room up to 11,450/500 points:
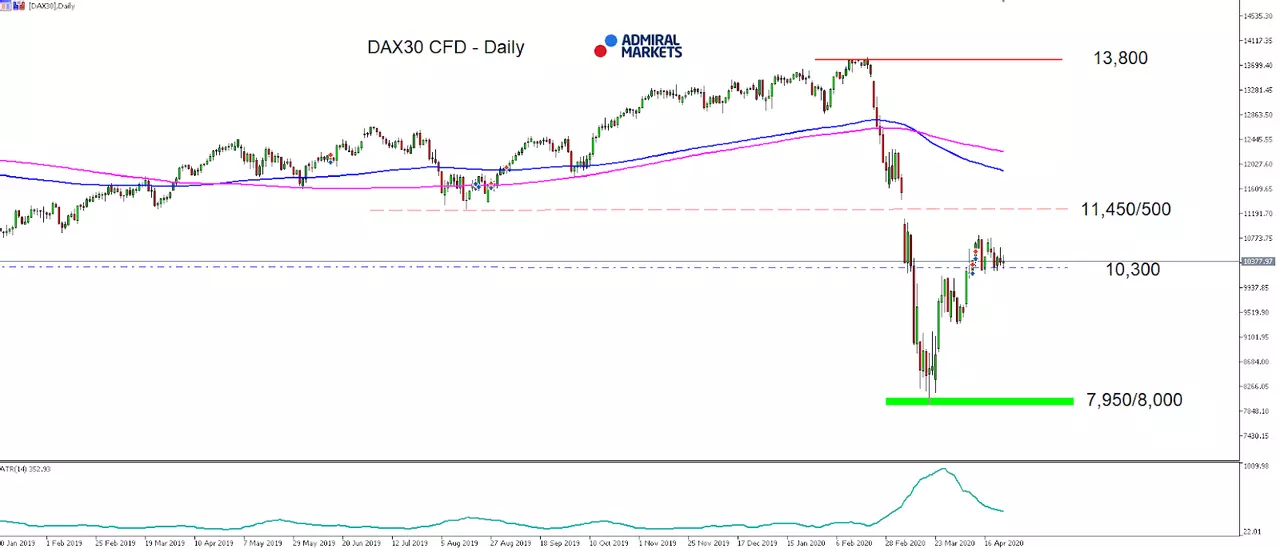
Source: Admiral Markets MT5 with MT5-SE Add-on DAX30 CFD Daily chart (between January 10, 2019, to April 24, 2020). Accessed: April 24, 2020, at 10:00pm GMT - Please note: Past performance is not a reliable indicator of future results, or future performance.
In 2015, the value of the DAX30 CFD increased by 9.56%, in 2016, it increased by 6.87%, in 2017, it increased by 12.51%, in 2018, it fell by 18.26%, in 2019, it increased by 26.44% meaning that after five years, it was up by 34.2%.
Check out Admiral Markets' most competitive conditions on the DAX30 CFD and start trading on the DAX30 CFD with a low 0.8 point spread offering during the main Xetra trading hours!
US Dollar
While the US-Dollar Index Future stabilised around 100.00 points, our very sceptical outlook in regard US-Dollar intensified over the last week again.
Our main point for this bearishness is still the expected pressure on 10-year-US Treasury yields, resulting out of the louder growing voices for a bailout of the badly hit US oil industry by the turbulences in the oil market..
Donald Trump tweeted already last Tuesday, that he […]instructed the Secretary of Energy and Secretary of the Treasury to formulate a plan which will make funds available so that these very important companies and jobs will be secured long into the future.[…]
That in mind makes it very likely that the Fed will rather sooner than later take monetary action again to deliver the needed financing of such a bailout package, pumping its balance sheet further, which has just recently passed 6.0 trillion USD.
Still, main reason for the solid USD Index Future performance is most likely the very weak performance of the Euro which leaves the Greenback, despite the dark fundamental picture with further upside potential if we get to see a drop lower in the Euro, making another stint higher with a target around 105.00 points an option.
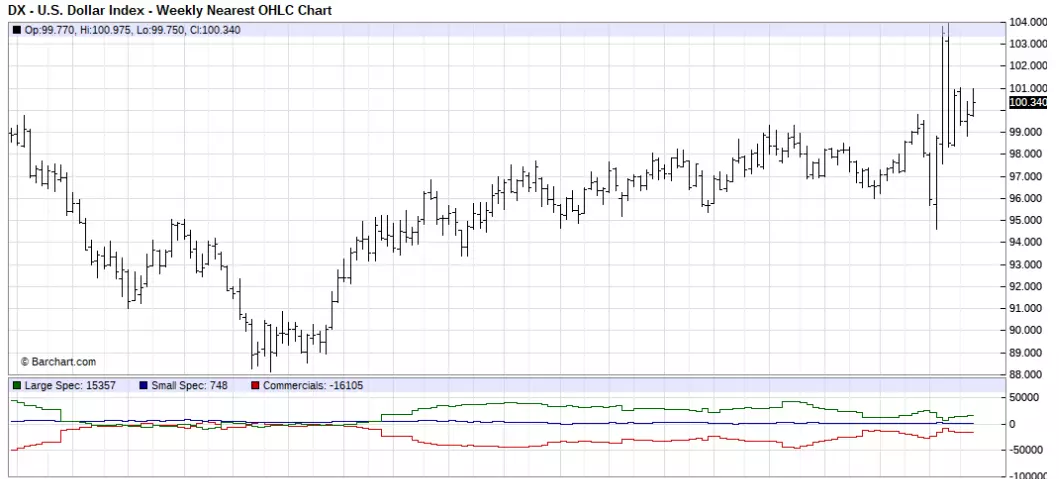
Source: Barchart - U.S Dollar Index - Weekly Nearest OHLC Chart (between January 2017 to April 2020). Accessed: April 24, 2020, at 10:00pm GMT
Don't forget to register for the weekly "Trading Spotlight" webinar with presenters including Jens Klatt, every Monday, Wednesday and Friday at 2pm London time! It's your opportunity to follow Jens and others as they explore the weekly market outlook in detail, so don't miss out!
Euro
The mode in the Euro and here in the EUR/USD stays choppy, but given the failed attempt to recapture 1.1000, we are still overall short-term bearish for the European currency.
That said, we consider a rather sooner than later re-test of the March lows around 1.0630 still a serious option.
That's probably especially true with the intensifying signs of the ECB loosening collateral rules and accept junk bonds as collateral while the failure to reach a Coronavirus stimulus agreement on the EU summit last week with the outlook that the Eurozone GDP faces a potential 5-10% contraction, shows that the effectiveness of the ECB's monetary policy without creating a unified structure to channel this liquidity to where it is needed in the EU and support will go nowhere, but devalue the Euro instead.
The reason, why this outlook hasn't yet resulted in a sharper drop in the European currency may be because of the also massively intervening US FED, which has ballooned its balance sheet now to over 6 trillion USD within weeks and the Euro holding stable due to an also very weak US-Dollar.
That said, we stay overall negative and bearish for the Euro, even though further monetary stimulus from the FED (e.g. to bail out the US oil industry) could prevent another aggressive wave lower with a break below 1.0600/30, instead resulting in an ongoing choppy and sideways price action:
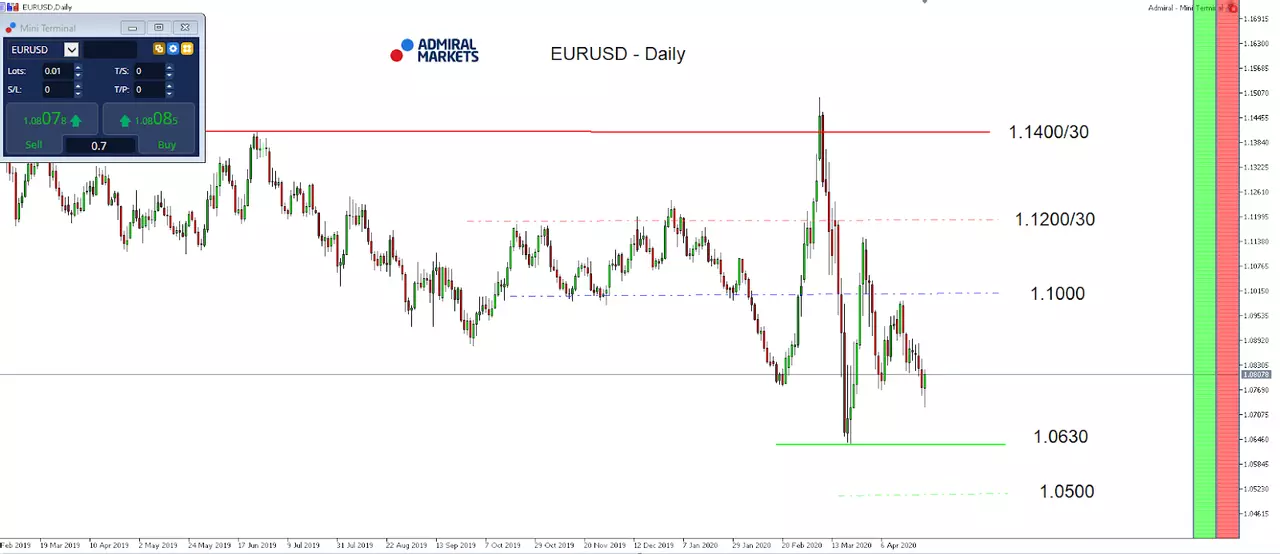
Source: Admiral Markets MT5 with MT5-SE Add-on EURUSD Daily chart (between February 25, 2019, to April 24, 2020). Accessed: April 24, 2020, at 10:00pm GMT - Please note: Past performance is not a reliable indicator of future results, or future performance.
In 2015, the value of the EUR/USD fell by 10.2%, in 2016, it fell by 3.2%, in 2017, it increased by 13.92%, 2018, it fell by 4.4%, 2019, it fell by 2.2%, meaning that after five years, it was down by 7.3%.
JPY
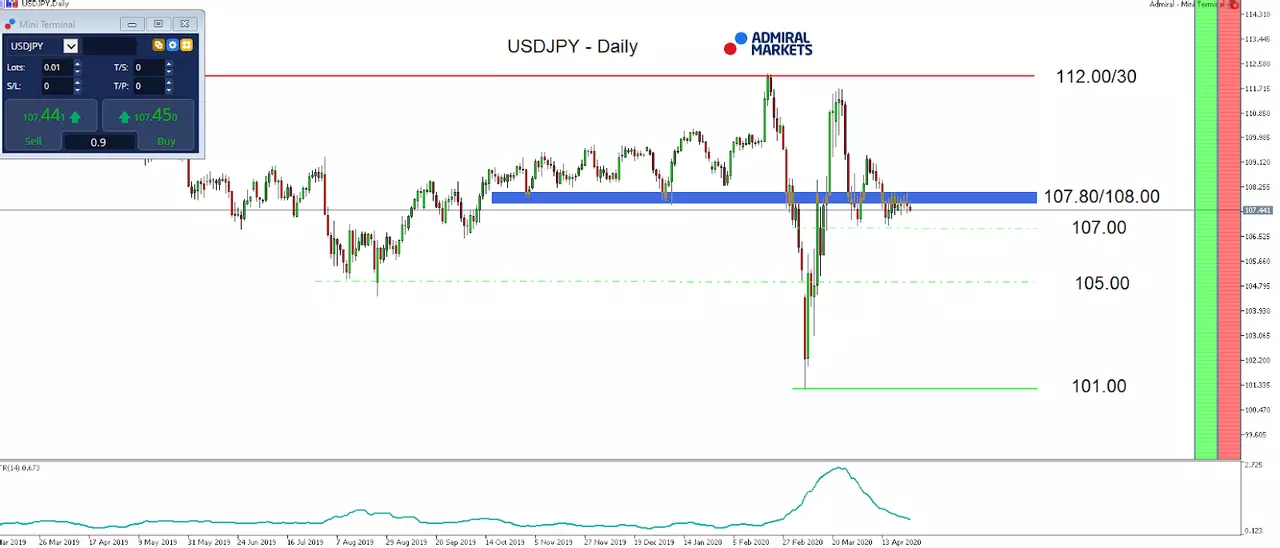
Despite recent volatility in global oil markets, volatility in FX markets stayed relatively low, especially in the USD/JPY.
That said, our outlook for the currency pair hasn't substantially changed.
Technically the currency pair stays choppy, but in our opinion with an overall bearish touch.
Our main point for this bearishness has been the expected pressure on 10-year-US Treasury yields which indeed continued and thus left the USD/JPY testing the short-term relevant region of support around 107.00.
A sustainable break wasn't seen yet, but if we get to see one in the days to come, a test of the region around 105.00 and even a push lower seems a realistic option.
That may especially play out once the voice of a bailout of the badly hit US oil industry by the turbulences in the oil market recently, grow louder.
Donald Trump tweeted already last Tuesday, that he […]instructed the Secretary of Energy and Secretary of the Treasury to formulate a plan which will make funds available so that these very important companies and jobs will be secured long into the future.[…]
That in mind makes it very likely that the Fed will rather sooner than later take monetary action again to deliver the needed financing of such a bailout package.
Source: Admiral Markets MT5 with MT5-SE Add-on USDJPY Daily chart (between March 4, 2019, to April 24, 2020). Accessed: April 24, 2020, at 10:00pm GMT
In 2015, the value of the USD/JPY increased by 0.5%, in 2016, it fell by 2.8%, in 2017, it fell by 3.6%, in 2018, it fell by 2.7%, in 2019, it fell by 0.85%, meaning that after five years, it was down by 9.2%.
Gold
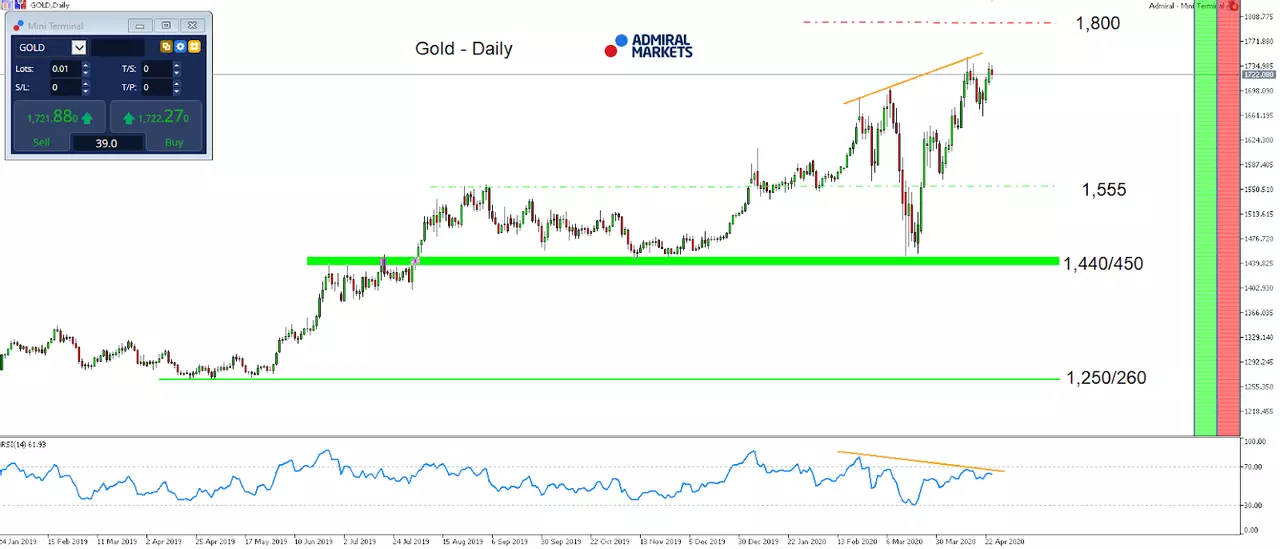
When looking at Gold, the overall picture hasn't changed, the yellow continues to trade around 1,700 USD.
That may surprise, given the recent dramatic developments in oil markets with a massive drop and the May contract of WTI Crude Oil futures falling into negative territory before its expiration.
Especially when looking at the reason for the developments in oil which find its reason in the missing storage capacity for oil, Gold traders become attentive: roughly speaking, the situation in Gold is very similar to the one in Oil with the main difference, that in case of oil we talk about a "storage issue" (no demand, enormous supply), while in case of Gold we talk about a "supply issue".
Therefore, let's have a look at the developments on April 20 again, were total gold deliveries on COMEX exceeded 3,000,000 ounces. To put things into perspective: this demand for physical Gold delivery exceeds the usual demand by three times.
And while the parabolic drop in the WTI May Oil Future on the downside was mainly due to no Bids being seen any more in the order book, the same could occur with offers in the Gold order book with no one willing to take the other side of a Gold buyer since the Short seller could guarantee to be able to deliver physical Gold at expiration.
The potential result? The exact opposite of what you witnessed Monday in NYMEX crude oil: Gold going parabolic on the upside.
While it is very difficult to say if such a development will really play out that way and if, when it will occur, we'd nevertheless keep it in mind and want to emphasize again that Long engagements in Gold remain to be favoured, not only from a risk-reward perspective, but also from a purely technical perspective as long as we trade above 1,440/450 USD.
Still, the still given potential bearish divergence in the RSI(14) on the daily time-frame pointing to some diminishing bullish momentum and leaves the break to new highs with a grain of salt, increasing the likelihood of a near-term correction with a potential first target around 1,650 USD.
Source: Admiral Markets MT5 with MT5SE Add-on Gold Daily chart (between 24 January 2019 to 24 April 2020). Accessed: 24 April 2020 at 10:00 PM GMT - Please note: Past performance is not a reliable indicator of future results, or future performance.
In 2015, the value of Gold fell by 10.4%, in 2016 it increased by 8.1%, in 2017 it increased by 13.1%, in 2018, it fell by 1.6%, in 2019, it increased by 18.9%, meaning that after five years, it was up by 28%.
Discover the world's #1 multi-asset platform
Admiral Markets offers professional traders the ability to trade with a custom, upgraded version of MetaTrader 5, allowing you to experience trading at a significantly higher, more rewarding level. Experience benefits such as the addition of the Market Heat Map, so you can compare various currency pairs to see which ones might be lucrative investments, access real-time trading data, and so much more. Click the banner below to start your FREE download of MT5 Supreme Edition!

Disclaimer: The given data provides additional information regarding all analysis, estimates, prognosis, forecasts or other similar assessments or information (hereinafter "Analysis") published on the website of Admiral Markets. Before making any investment decisions please pay close attention to the following:
- This is a marketing communication. The analysis is published for informative purposes only and are in no way to be construed as investment advice or recommendation. It has not been prepared in accordance with legal requirements designed to promote the independence of investment research, and that it is not subject to any prohibition on dealing ahead of the dissemination of investment research.
- Any investment decision is made by each client alone whereas Admiral Markets shall not be responsible for any loss or damage arising from any such decision, whether or not based on the Analysis.
- Each of the Analysis is prepared by an independent analyst (Jens Klatt, Professional Trader and Analyst, hereinafter "Author") based on the Author's personal estimations.
- To ensure that the interests of the clients would be protected and objectivity of the Analysis would not be damaged Admiral Markets has established relevant internal procedures for prevention and management of conflicts of interest.
- Whilst every reasonable effort is taken to ensure that all sources of the Analysis are reliable and that all information is presented, as much as possible, in an understandable, timely, precise and complete manner, Admiral Markets does not guarantee the accuracy or completeness of any information contained within the Analysis. The presented figures refer that refer to any past performance is not a reliable indicator of future results.
- The contents of the Analysis should not be construed as an express or implied promise, guarantee or implication by Admiral Markets that the client shall profit from the strategies therein or that losses in connection therewith may or shall be limited.
- Any kind of previous or modeled performance of financial instruments indicated within the Publication should not be construed as an express or implied promise, guarantee or implication by Admiral Markets for any future performance. The value of the financial instrument may both increase and decrease and the preservation of the asset value is not guaranteed.
- The projections included in the Analysis may be subject to additional fees, taxes or other charges, depending on the subject of the Publication. The price list applicable to the services provided by Admiral Markets is publicly available from the website of Admiral Markets.
- Leveraged products (including contracts for difference) are speculative in nature and may result in losses or profit. Before you start trading, you should make sure that you understand all the risks.

