What is a Bull Market? Definition, Trading & Investing Strategies
Did you know that at the beginning of 2021, the market had just completed its longest-ever bull market run in history?
From the post-2008 financial recession to the post-pandemic period of 2020, the US100 posted gains of more than 800%, with some individual stocks like Amazon posting gains of more than 5,000%!
Of course, not all markets performed that well but it does highlight the importance of knowing when you are in a bull market and the strategies to capitalise from it. Read on to learn more! ▼▼▼

In this article, you will learn:
✅ The definition of what is a bull market?
✅ The difference between bull and bear markets.
✅ How to answer the question ‘are we in a bear or bull market’ right now.
✅ Trading and investing strategies to capitalise on the unique characteristics of a bull market.
✅ How to open an Invest.MT5 account with a minimum of just €1 and access low commissions from just $0.01 on US stocks and ETFs for true bull market investing.
✅ How to open a Trade.MT5 account to trade stocks, ETFs (exchange traded funds), indices, currencies and commodities via Contracts for Difference (CFDs) which allows you to potentially profit from bull and bear markets.
✅ How to receive actionable trading and investing ideas in real-time market conditions and on thousands of different markets using the exclusive Admirals Supreme Edition platform which is FREE to download!
✅ And much, much more!
What is a bull market?
Simply put, a bull market is a period of time in which a market is experiencing a rise in its price. So, what does a bull market mean? Essentially, it means that buyers are in control of the market and are the more dominant player, with very few sellers.
▶️ The U.S Securities and Exchange Commission define a bull market as “A time when stock prices are rising and market sentiment is optimistic. Generally, a bull market occurs when there is a rise of 20% or more in a broad market index over at least a two-month period.”
Bull markets are preferred by most investors as the majority of fund managers and pension portfolio managers are ‘long-only.’ This means that they are restricted to buying assets that will rise in price and is just one reason why bull markets can actually last so long.
A bull market can actually form on any type of financial security such as stocks, indices, commodities, currencies, and others. Having access to a range of instruments can be useful to help diversify risk in bull markets. With the MetaTrader 5 trading platform provided by Admirals you can view real-time prices of thousands of instruments across different asset classes.
Click on the banner below to start your FREE download today: ▼▼▼

What is the difference between bull and bear markets?
Bull markets are periods of time when a financial asset is appreciating in value with rising prices. Bear markets are periods of time when a financial asset is depreciating in value with falling prices. The U.S Securities and Exchange Commission defines a bear market as a fall by “20% or more over at least a two-month period.” Essentially, the opposite of a bull market is a bear market.
Higher prices in a bull market actually serve as a self-fulfilling prophecy as it attracts more investors who also want to capitalise on prices going up. This fuels further optimism, attracting even more people and further pushing prices higher.
In a bear market, that opposite holds true. Falling prices fuel even more pessimism causing sharp, sustained declines in an asset. People tend to panic more when prices are falling and usually make irrational decisions. This causes bear markets to exhibit very small rallies of optimism. The most well-known bear markets were the 2000 tech bubble, 2008 credit crunch and 2020 coronavirus pandemic of which the last two are shown in the chart below.

Source: Admirals MetaTrader 5, SP500, Weekly - Data range: from 22 May 2005 to 1 Feb 2021, accessed on 1 Feb 2021 at 13:30 GMT. Please note: Past performance is not a reliable indicator of future results.
You can learn more about how to trade the S&P stock market index in the ‘How to Trade the US Stock Market’ article.
Bull market history
There have been a variety of bull markets in history that have all lasted for different times. Some bull markets are secular which means they can last between five and 25 years. The housing boom from 2002 to 2007 - also known as the housing bubble - was a bull market that developed after the US Federal Reserve cut interest rates to spur investment. When the stock market peaked in 2007, it marked the beginning of a recession and the start of a bear market.
However, the longest bull market run in history was the period between 2009 and March 2020, as shown in the chart below. The record-breaking bull run lasted nearly 11 years with the S&P 500 stock market index gaining more than 400% over that period of time - and individual stocks performing even better. In fact, many analysts say this was the biggest wealth creation event of our time as the gains for the stock market amounted to nearly $20 trillion.

Source: Admirals MetaTrader 5, SP500, Weekly - Data range: from 22 May 2005 to 1 Feb 2021, accessed on 1 Feb 2021 at 13:35 GMT. Please note: Past performance is not a reliable indicator of future results.
The bull market ended in March 2020 during the coronavirus pandemic where from the 19 February 2020 to 23 March 2020 the S&P 500 stock market index dropped 33.9%. This was a short lived bear market which actually turned into the beginning of a bull market from the lows made during March 2020. The bull market was confirmed when the index surged to a record high on 18 August 2020.

Source: CNBC, 2 February 2021
This also means that from the end of 2020, the stock market is in a current bull market. Therefore, learning how to identify the key characteristics of bull runs is one of the first steps towards capitalising from it. Before we look at some possible trading and investing strategies for this situation, let’s have a look at how you can know if we are in a bull market and the key characteristics of them.
Did you know that you can stay up to date with all the latest market news and trading opportunities in the Admirals Spotlight webinar series? In this live series, three times a week, three different traders talk through the markets with you and highlight where the potential opportunities are!
Be sure to register for your FREE spot today, by clicking on the banner below: ▼▼▼

How do you know if we are in a bull market?
A bull market has similar characteristics of the expansion phase in the economic cycle. This is the most desired place for investors as it typically reflects business and companies making steady profits with low unemployment. As this helps consumers to spend and invest more, the stock market typically sees higher returns during this period of time.
Some of the key characteristics which define a bull market include:
☑️ A rising stock market with at least a 20% increase over two months or more. As prices rise this encourages more investors to keep buying, further fuelling the bull market run up.
☑️ Falling unemployment. As optimism increases and as companies receive more funds from shareholders they typically expand operations and hire more people bringing the unemployment rate lower.
☑️ A fundamentally-fuelled rally. Typically, bull markets develop due to accommodative monetary policy from central banks. For example, the longest bull market in history from 2009 to March 2020 was fuelled by record low-interest rates and cheap money.
Traders and investors can also use technical analysis to help confirm the potential of a bull market. For example, technical indicators such as moving averages, which are used widely by traders and investors, help to find the long-term average of price and can confirm long-term trends.

Source: Admirals MetaTrader 5, SP500, Weekly - Data range: from 22 May 2005 to 1 Feb 2021, accessed on 1 Feb 2021 at 13:40 GMT. Please note: Past performance is not a reliable indicator of future results.
In the long-term weekly chart of the S&P 500 stock market index above, the price activity in-between the two vertical green lines show the longest bull run in history. While it started in 2009, it was around 2012 when the 50-period (red), 100-period (green) and 200-period (blue) exponential moving averages all started to move higher and separate away from each other.
This was the beginning of a long-term trend towards the upside and they have stayed in the same order since. This is why moving averages are widely used among investors. Not only can they provide potential levels for entry - as seen by the multiple bounces off of them historically - but also to stick with the trend as well.
You can learn more about moving averages in this 45-minute video by a professional trader showing you why moving averages are so popular, their pros and cons and the various ways you can use them in your trading.
Bull market trading and investing strategies
There are a variety of trading and investing strategies traders could employ in bull market conditions. Let’s have a look at a few of the different styles.
Buy and hold investing in bull markets
The most common style of investing in a bull run is ‘buy and hold.’ This is simply where investors would buy an asset and hold on for as long as possible. Buy and hold investors would typically hold investments for a minimum of several months but most likely years. This is because a bull market typically happens at the same time as the expansion phase in the business and economic cycle.
Investors could further refine their choice of investments, however. By using sector rotation, investors can capitalise on the rise in the broader stock market as well as any additional fuel by in-demand sectors. For example, in the expansion phase, sectors such as real estate, consumer discretionary and technology tend to perform well.
You can learn more about stock sectors in the '11 Sectors of the Stock Market You Need to Know' article.

Source: Admirals MetaTrader 5, #IYR, Weekly - Data range: from 21 May 2006 to 1 Feb 2021, accessed on 1 Feb 2021 at 14:40 GMT. Please note: Past performance is not a reliable indicator of future results.
The weekly price chart above shows the historical performance of the iShares US Real Estate ETF (exchange traded fund). This fund aims to give investors exposure to the US real estate companies and REITs (real estate investment trusts) which invest in real estate directly.
During the longest-ever bull run from 2009 to 2020 the ETF has also experienced a solid uptrend with the 50-period, 100-period and 200-period exponential moving averages all in alignment.
The below weekly chart is of the Technology Select Sector SPDR Fund which aims to give investors exposure to the companies listed in the S&P 500 index involved in technology hardware, storage, software, semiconductors, IT services and more.
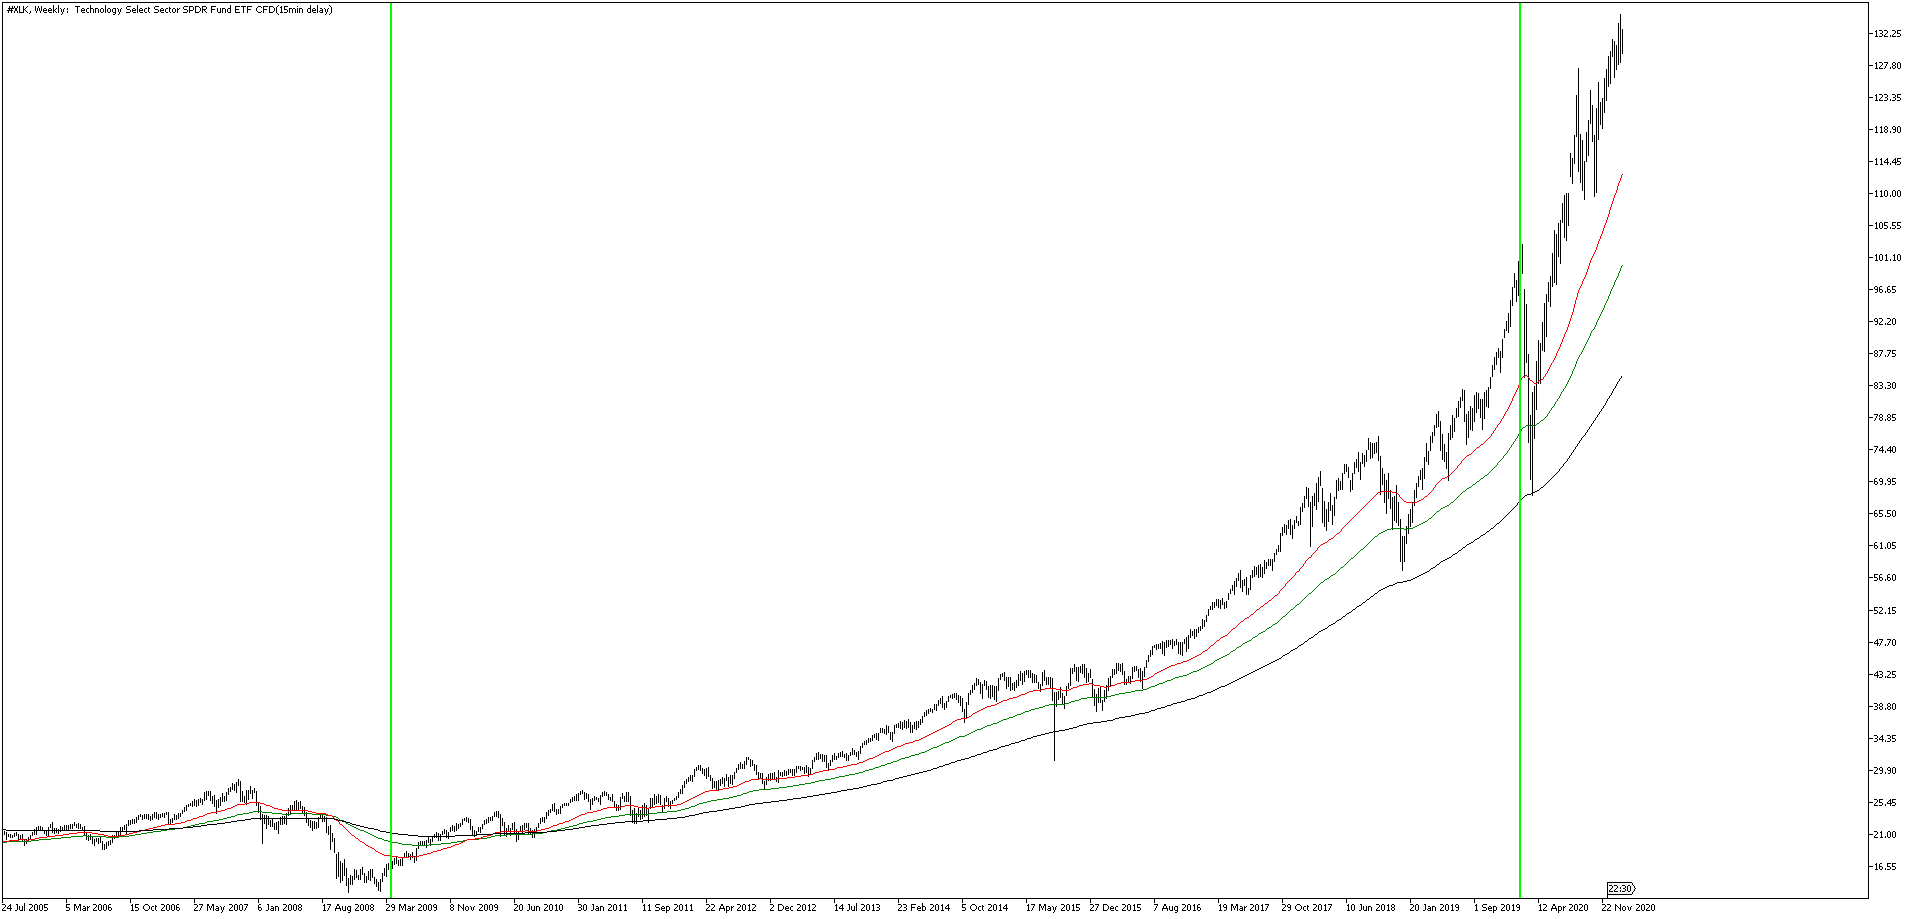
Source: Admirals MetaTrader 5, #XLK, Weekly - Data range: from 24 Jul 2005 to 1 Feb 2021, accessed on 1 Feb 2021 at 15:40 GMT. Please note: Past performance is not a reliable indicator of future results.
In the above chart, it’s clear to see how much smoother the trend has been during the bull market run from 2009 to 2020, in-between the green lines. By analysing the sector, investors can find which companies may outperform during a bull market run.
Fortunately, with the Admirals Invest.MT5 account you can invest in both stocks and ETFs from 15 of the largest stock exchanges around the world!
Did you know that you can open an account with only a €1 minimum deposit, enjoy free access to real-time prices and invest with low commissions starting from just $0.01 per share for US stocks and low minimum commissions of just $1?
To get started, click on the banner below: ▼▼▼

Swing trading bull markets
Swing trading is a method where a trader will buy or sell securities and hold the trades for several days and in some cases several weeks. This style is known as trend-following and can be useful in bull markets which exhibit more trend-like characteristics.
Typically, swing traders will use a combination of technical analysis and fundamental analysis to make trading decisions. Some of the most commonly used indicators for swing trading include the Stochastic Oscillator and Relative Strength Index (RSI).

Source: Admirals MetaTrader 5, #XLK, Weekly - Data range: from 22 Apr 2007 to 1 Feb 2021, accessed on 1 Feb 2021 at 16:40 GMT. Please note: Past performance is not a reliable indicator of future results.
For example, in the chart above of the Technology Sector Fund SPDR ETF during the early stages of the bull market run from 2009, all three moving averages crossed and moved higher confirming the bull trend from late 2010.
Swing traders would then typically use indicators like the Stochastic Oscillator to look for oversold market conditions. These conditions are generally considered to be when the Stochastic lines (red and blue) or below the 20 level, or the bottom horizontal line in the indicator window.
As swing traders would typically hold trades for several days or weeks, they may consider using Contracts for Difference (CFDs) to do so. This is because CFDs allow traders to speculate on price moving up or down while using leverage. This means you can potentially control a larger position with a smaller deposit.
Learn more today by clicking on the banner below to open an account: ▼▼▼

Day trading bull markets
Day traders love bull runs as it provides strong, directional moves during the day. The day trading style involves buying and selling securities within a single trading day and being flat at the end of the day. Day traders would typically trade on lower time frame charts such as the one-hour or fifteen-minute chart.
While day trading is one of the more popular methods of trading bull markets it is also the most challenging for beginner traders. This is because in bull runs, markets tend to move very fast, especially on the lower timeframes. Analysing the market and making trading decisions in a very short space of time does require some practice.
Day traders may choose to focus on high-quality stocks within strong performing sectors within a bull run. However, another option is to trade the overall stock market index using CFDs which allows the ability to trade outside the traditional stock market opening hours making the symbol less prone to extreme gaps.

Source: Admirals MetaTrader 5, US100, Monthly - Data range: from 1 Jun 2005 to 2 Feb 2021, accessed on 2 Feb 2021 at 16:40 GMT. Please note: Past performance is not a reliable indicator of future results.
For example, above is the long-term, monthly price chart of the US100 stock market index CFD which clearly shows a long-term bull run. The US100 index measures the performance of the largest 100 stocks listed on the Nasdaq exchange and tends to be technology focused.
As technology stocks tend to be the most in demand, the index acts as a sector in itself. This combination of bullish factors can be ideal for day traders who are looking for strong, directional moves throughout the day. While not every day will be trending and offer the right characteristics, the 15-minute chart below of the US100 Index CFD provided by Admirals does show a strong bullish period between the 1st and 2nd of February 2021.

Source: Admirals MetaTrader 5, US100, M15 - Data range: from 29 Jan 2021 to 2 Feb 2021, accessed on 2 Feb 2021 at 17:40 GMT. Please note: Past performance is not a reliable indicator of future results.
In the above 15-minute chart, the uptrend in price is confirmed by the 20-period (blue), 50-period (red) and 100-period (green) exponential moving averages all moving upwards. This confirms the intraday bullishness. Traders may then use technical trading oscillators like the Stochastic Oscillator to identify oversold conditions below the 20 level for possible areas to enter long positions.
How to trade a bull market
To trade a bull market on an asset class of your choosing, follow the steps below:
☑️ Open your MetaTrader 5 trading platform provided by Admirals. Alternatively, start your free download here.
☑️ Once you are on the platform, select View from the top menu to open the Market Watch window.
☑️ In the Market Watch window, right-click and then select Symbols. Here you can search from the +3,000 instruments available to trade on via Admirals. Start typing the name of the instrument and a selection of instruments will appear.
☑️ Press OK to add the symbol to your Market Watch list. Then, drag the symbol onto the chart to view historical and live prices of it.
☑️ To open a trading ticket, right-click on the chart and select Trading and then New Order. A trading ticket will open up for you to input your own entry, stop loss and take profit levels as well as your position size.

A screenshot showing the MetaTrader 5 trading platform provided by Admirals with a trading ticket open on the chart.
Deciding whether we are in a bear or bull market requires broad analysis of the market conditions, as well as technical analysis of the overall stock market index. When in a current bull market it can be difficult to ask the question: when will the bull market end?
One unique trading and investing tool that can help with making these decisions is the Technical Insight Lookup Indicator. This provides actionable, real-time trading and investing ideas on a variety of different asset classes covering stocks, ETFs, indices, commodities, currencies, and more!
For example, the image below shows a search for the S&P 500 Index in the indicator window from the upgraded version of the MetaTrader 5 trading platform provided by Admirals.
It provides a list of actionable technical events for the short-term, intermediate-term and long-term:

A screenshot showing an example of searching for ‘S&P 500 Index’ in the Technical Insight Lookup indicator from the MetaTrader 5 Supreme Edition platform provided by Admirals.
You can get this indicator completely FREE by upgrading your MetaTrader 5 trading platform to the Admirals Supreme Edition! You also receive a ton of other features and indicators to supercharge your trading!
To start your FREE download, simply click the banner below: ▼▼▼

Why trade and invest in a bull market with Admirals?
✔️ Trade and invest with a well-established company authorised and regulated by the UK Financial Conduct Authority (FCA).
✔️ Access multiple asset classes, including more than 3,000 stocks and ETFs!
✔️ Supercharge your MetaTrader 5 trading platform completely FREE by upgrading to the Supreme Edition platform to access the Technical Insight Lookup indicator.
✔️ Open an Invest.MT5 investing account to buy stocks, the best shares and ETFs from 15 of the largest stock exchanges in the world.
✔️ Open a Trade.MT5 trading account to trade via CFDs to potentially profit from rising and falling markets across stocks, ETFs, indices, commodities, currencies and more!
Did you know that you can actually test all of these services and features completely free by opening a demo trading account?
This means you can buy and sell in a virtual environment until you are ready to go live!
Click on the banner below to open your demo account today! ▼▼▼

About Admirals
Admirals is a multi-award winning, globally regulated Forex and CFD broker, offering trading on over 8,000 financial instruments via the world's most popular trading platforms: MetaTrader 4 and MetaTrader 5. Start trading today!
This material does not contain and should not be construed as containing investment advice, investment recommendations, an offer of or recommendation for any transactions in financial instruments. Please note that such trading analysis is not a reliable indicator for any current or future performance, as circumstances may change over time. Before making any investment decisions, you should seek advice from independent financial advisors to ensure you understand the risks.
Other articles you may find interesting:
- Trading Risk Management: Top 10 Forex Risk Management Tips
- Overview of the Best MT5 Indicators
- How to Start Forex Trading Guide 2026