74% of retail investor accounts lose money when trading CFDs with this provider.
Investments involve risks and are not suitable for all investors. CFDs are complex instruments and come with a high risk of losing money rapidly due to leverage.
74% of retail investor accounts lose money when trading CFDs with this provider.
You should consider whether you understand how CFDs work and whether you can afford to take the high risk of losing your money.
Weekly Wave Analysis EUR/USD, GBP/USD, USD/JPY 14 August 2017
Weekly Wave Analysis EUR/USD, GBP/USD, USD/JPY 14 August 2017
August 14, 2017 02:00
Hello trader,
Please find here below this week's wave analysis on the EUR/USD, GBP/USD and USD/JPY daily, weekly and monthly charts. More education, analytics, articles, and webinars can be found daily on Admiral Markets. https://admiralmarkets.com/analytics/
EUR/USD
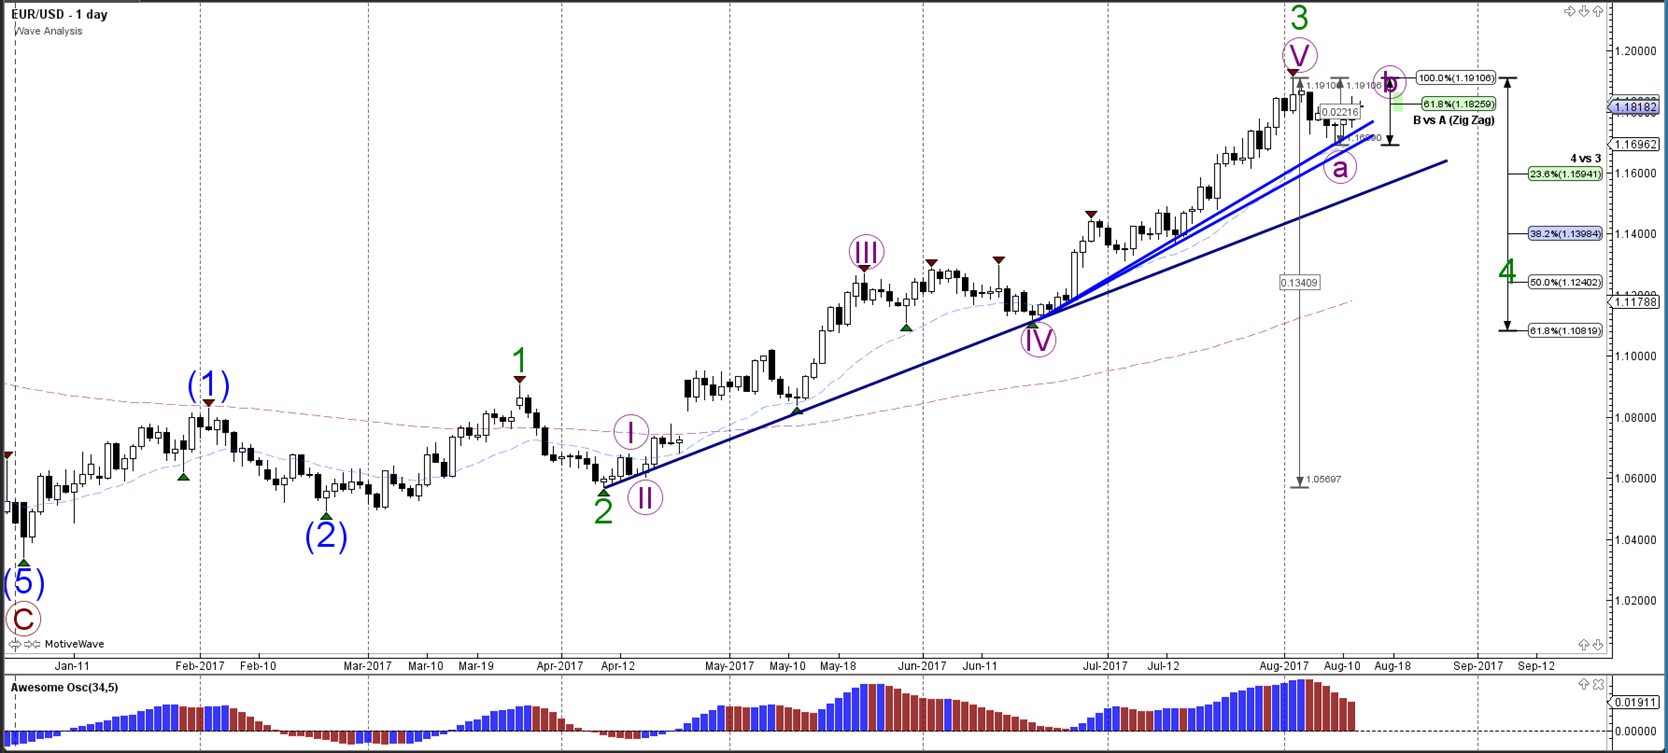
The EUR/USD indeed created a larger correction, as expected in last week's long-term wave analysis. The correction could expand further if price stays below the 100% Fibonacci level of wave B vs A, which could create an ABC within wave 4 (green).
Daily chart:
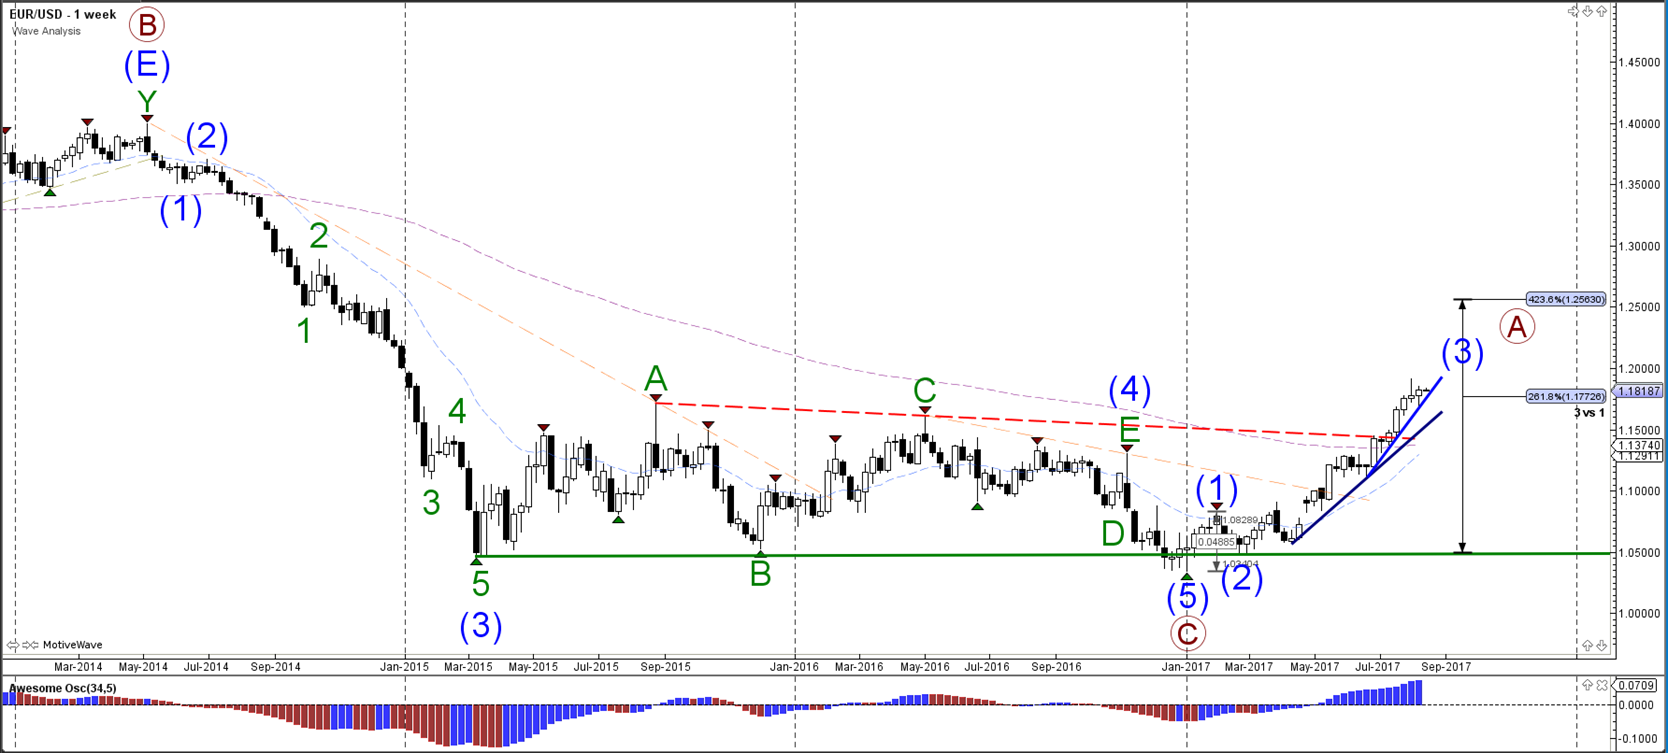
The EUR/USD bullish break above resistance (dotted red) is part of a wave 3 (blue) momentum.
Weekly chart:
The EUR/USD bullish momentum could be part of a wave A (brown). The strong bullish momentum seems to indicate that the bearish wave 5 (blue) of wave C (brown) is most likely completed.
Monthly chart:
USD/JPY
The USD/JPY broke below the support trend line (dotted blue) and could be a in wave C (brown).
Daily chart:
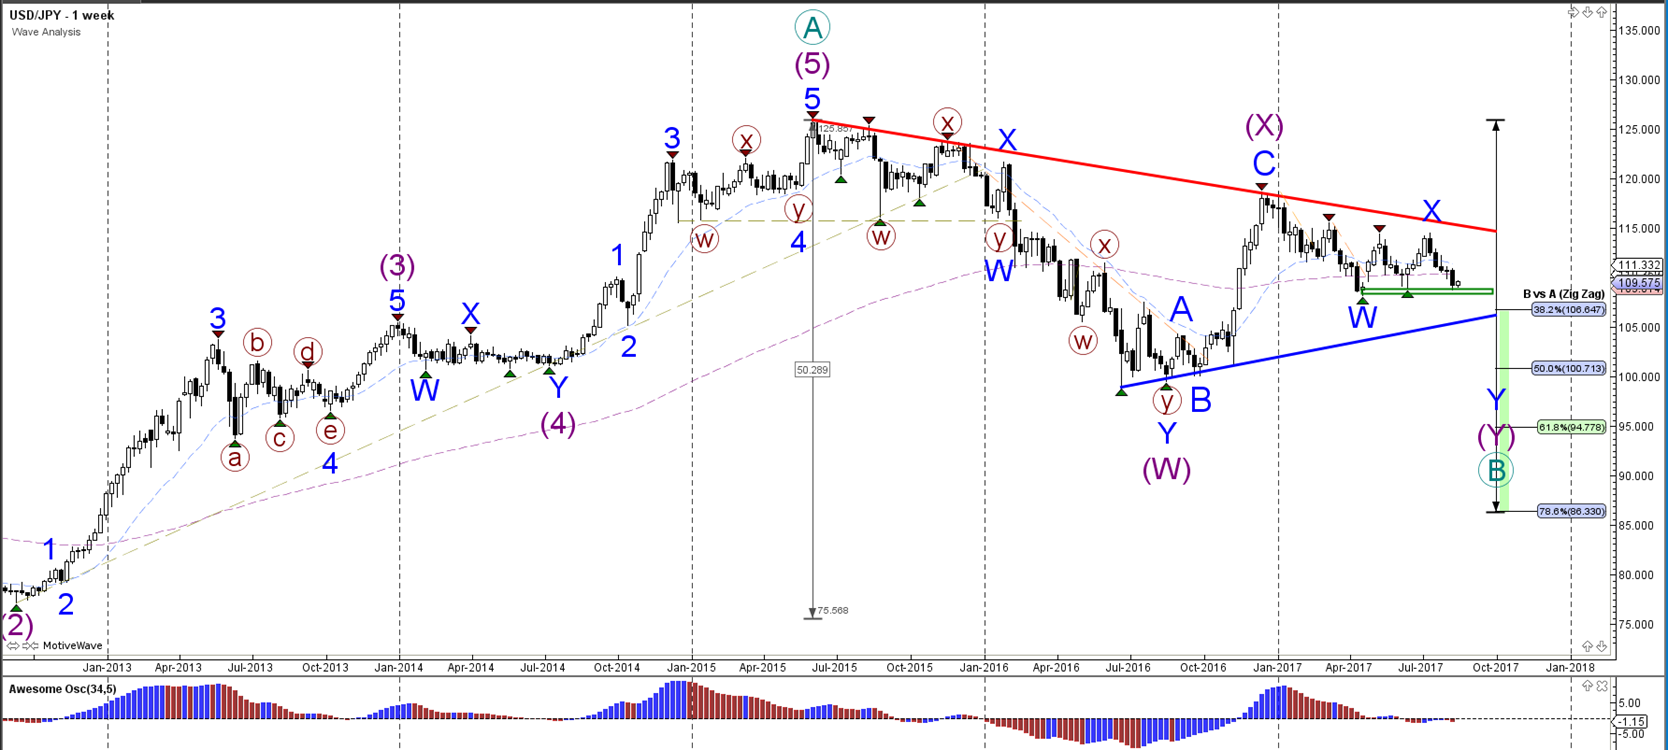
The USD/JPY is retracing lower via a WXY (blue) correction to the Fib levels of wave B (green) or the support trend line (green). A break above the resistance trend line (red) could change the market structure and indicate a bullish trend.
Weekly chart:
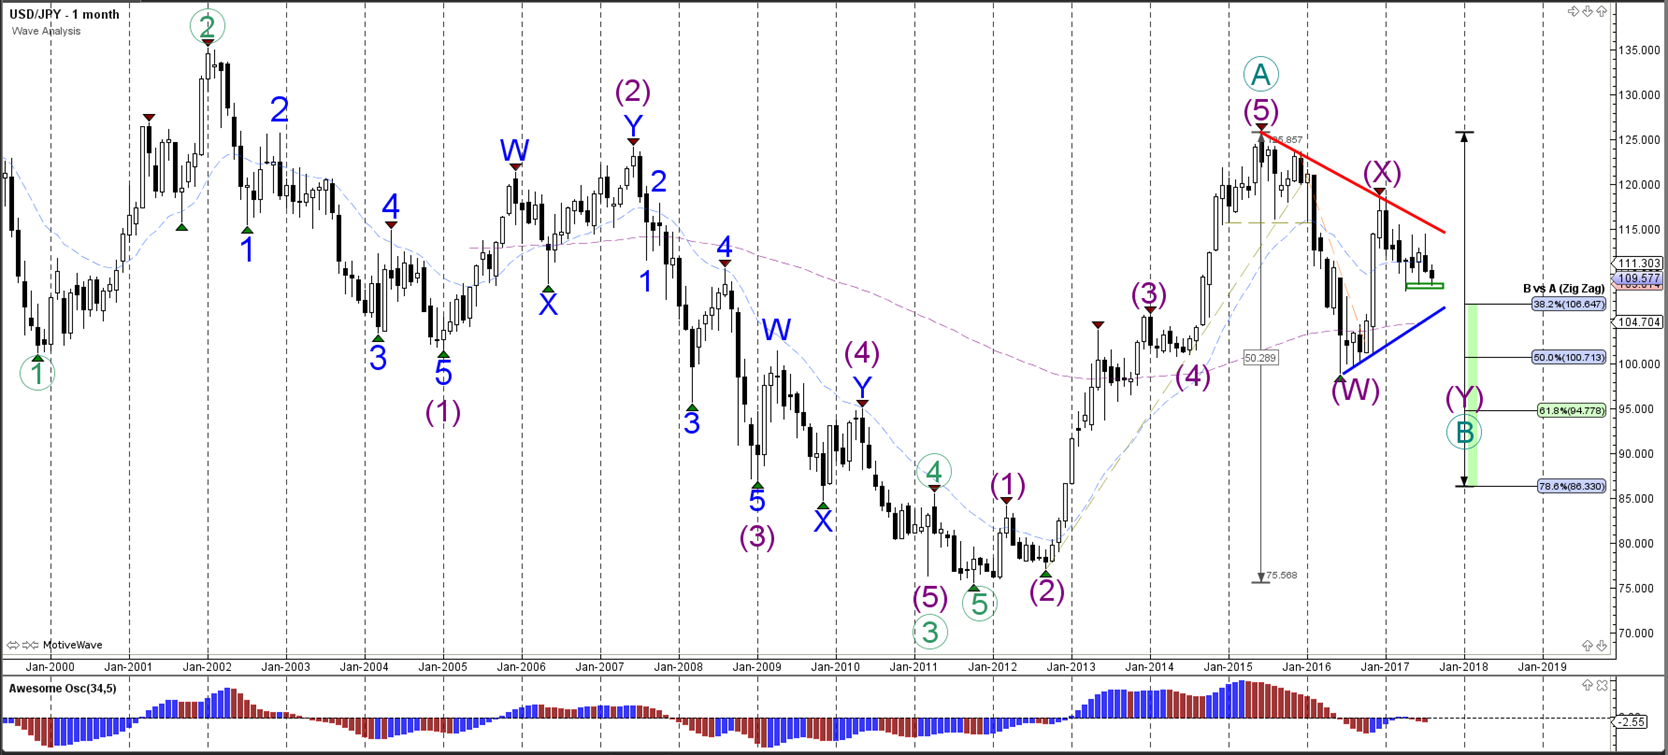
The USD/JPY is most likely in a wave B (green) correction at the moment. A retest of the lower Fibs like the 61.8% Fib would confirm this wave structure whereas break above resistance (red) would invalidate it and make a bullish variant more suitable.
Monthly chart:
GBP/USD
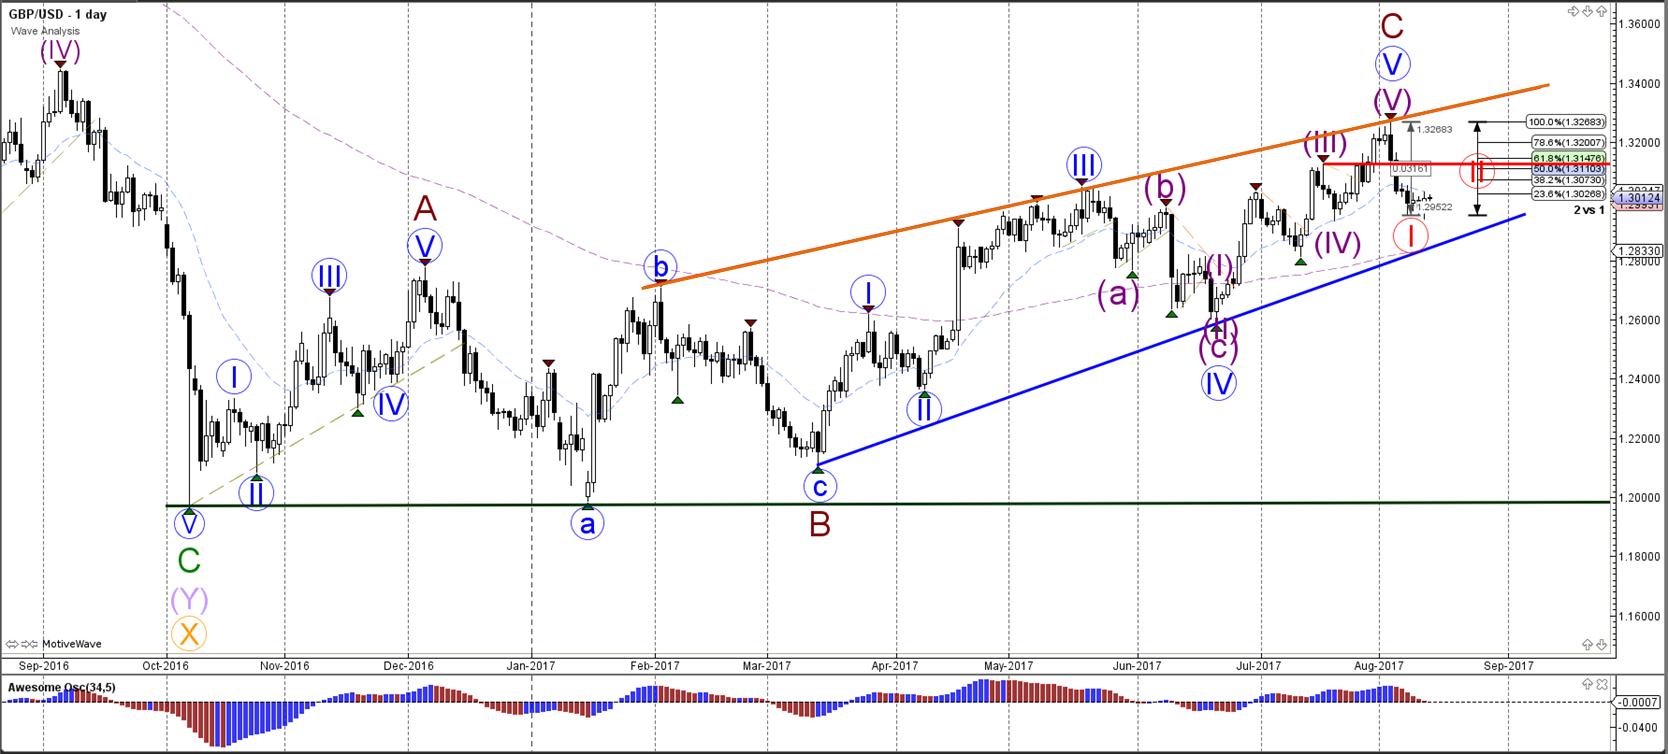
The GBP/USD is probably building a wave 1-2 (red) wave structure and could complete a potential head and shoulders chart pattern at the resistance level (red).
Daily chart:
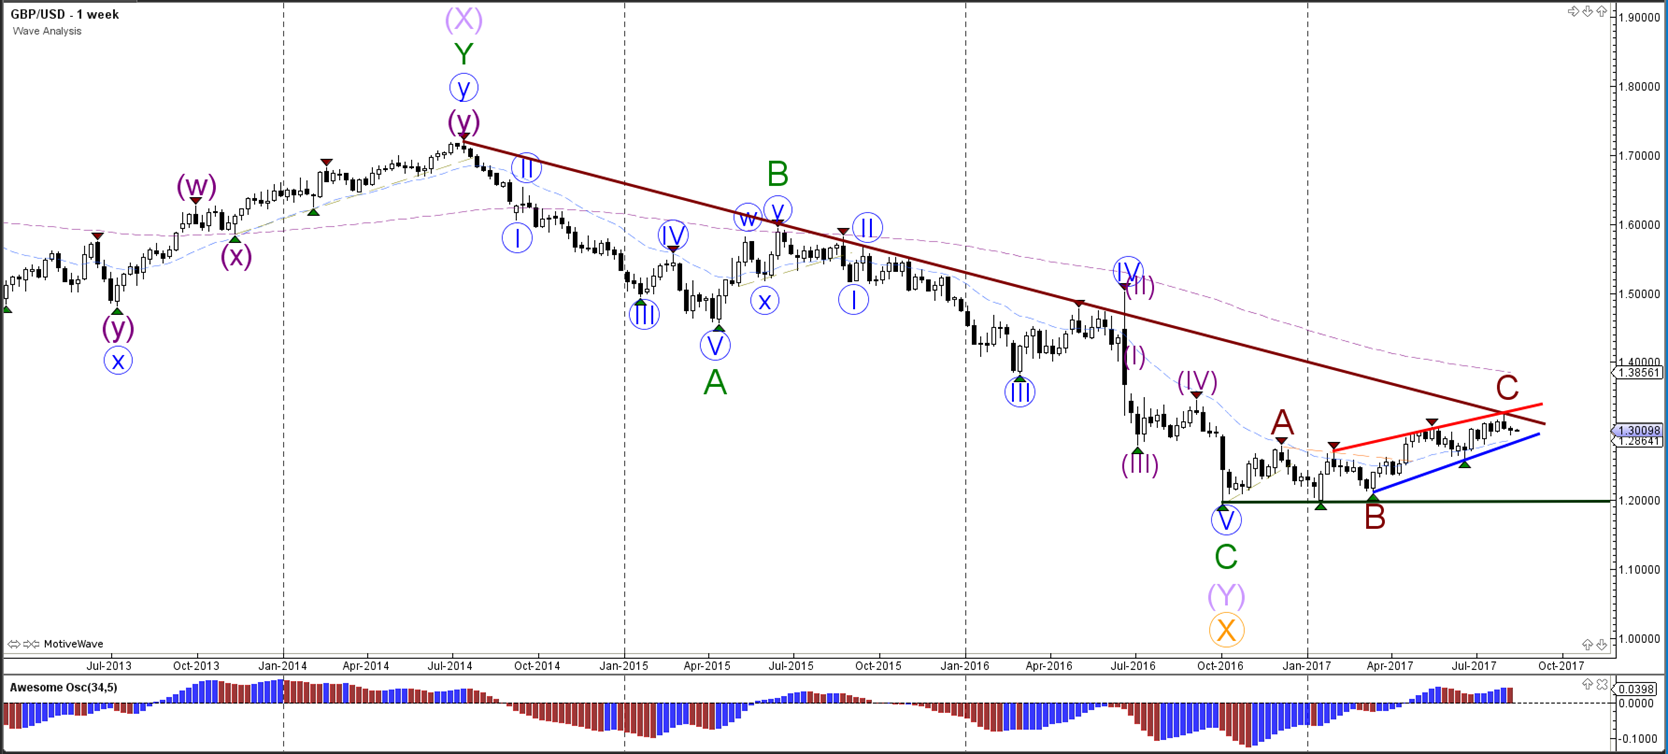
The GBP/USD seems to be completing an ABC (brown) correction at the resistance trend lines (brown/red).
Weekly chart:
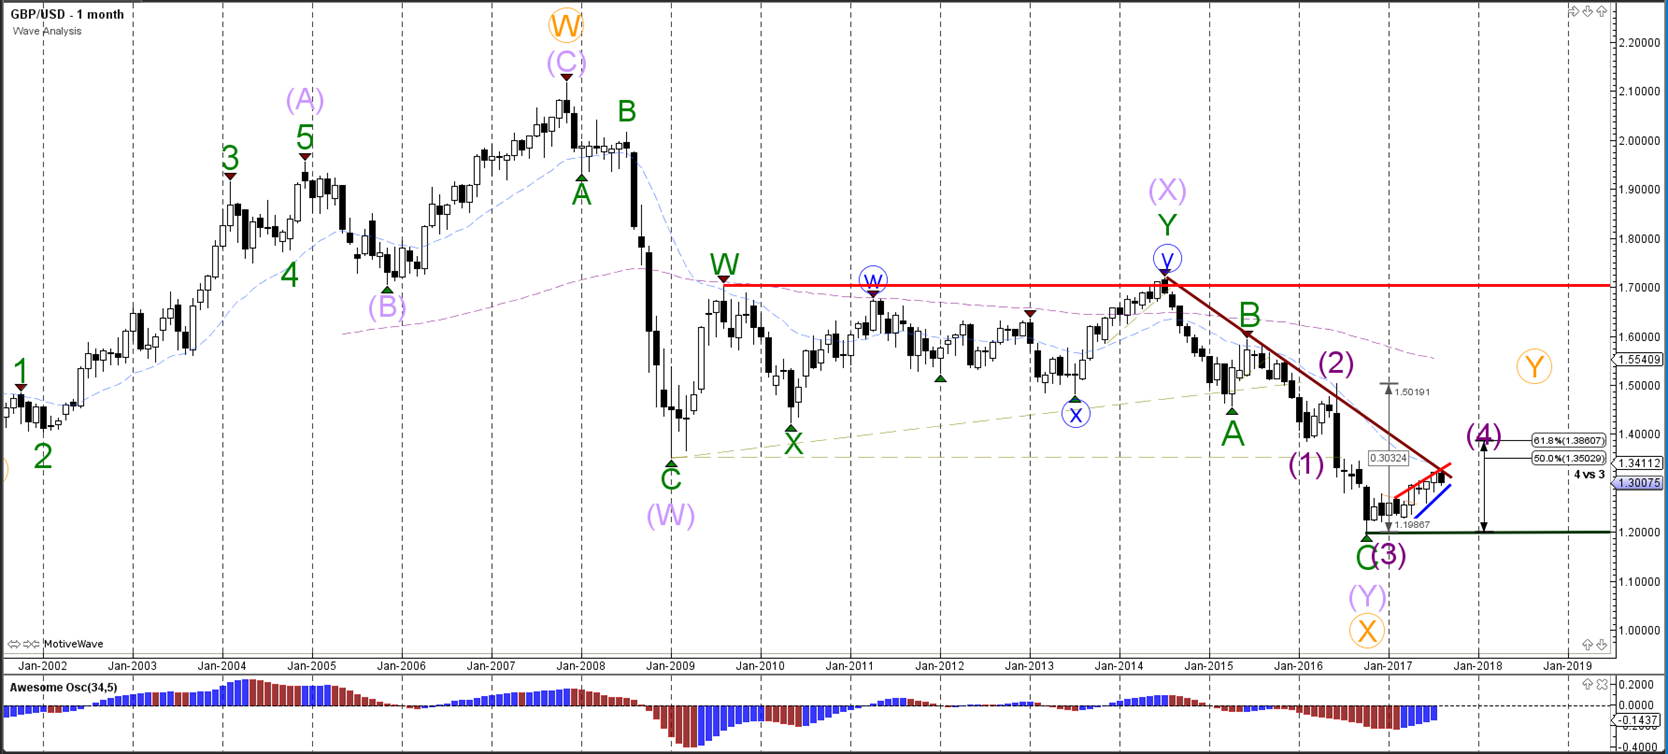
The GBP/USD could bounce at the resistance trend line (brown) and test the support lines (green/blue).
Monthly chart:
Follow @ChrisSvorcik on twitter for latest market updates.
Connect with Chris Svorcik on Facebook for latest market updates.