USD/JPY Triangle Pattern Visible at 110 and 61.8% Golden Ratio
USD/JPY
4 hour

The USD/JPY bounced at the golden ratio Fib of 61.8% level and it seems likely that the wave C (brown) has been completed once price breaks above the smaller resistance trend line (orange). A break above or below the small contracting triangle chart pattern (green/orange) could play a key role in a push towards the 78.6% Fib or next resistance (red).
1 hour

The USD/JPY could however first build a wave 4 (orange) correction and a wave 5 (orange) continuation before completing wave C (brown).
EUR/USD
4 hour
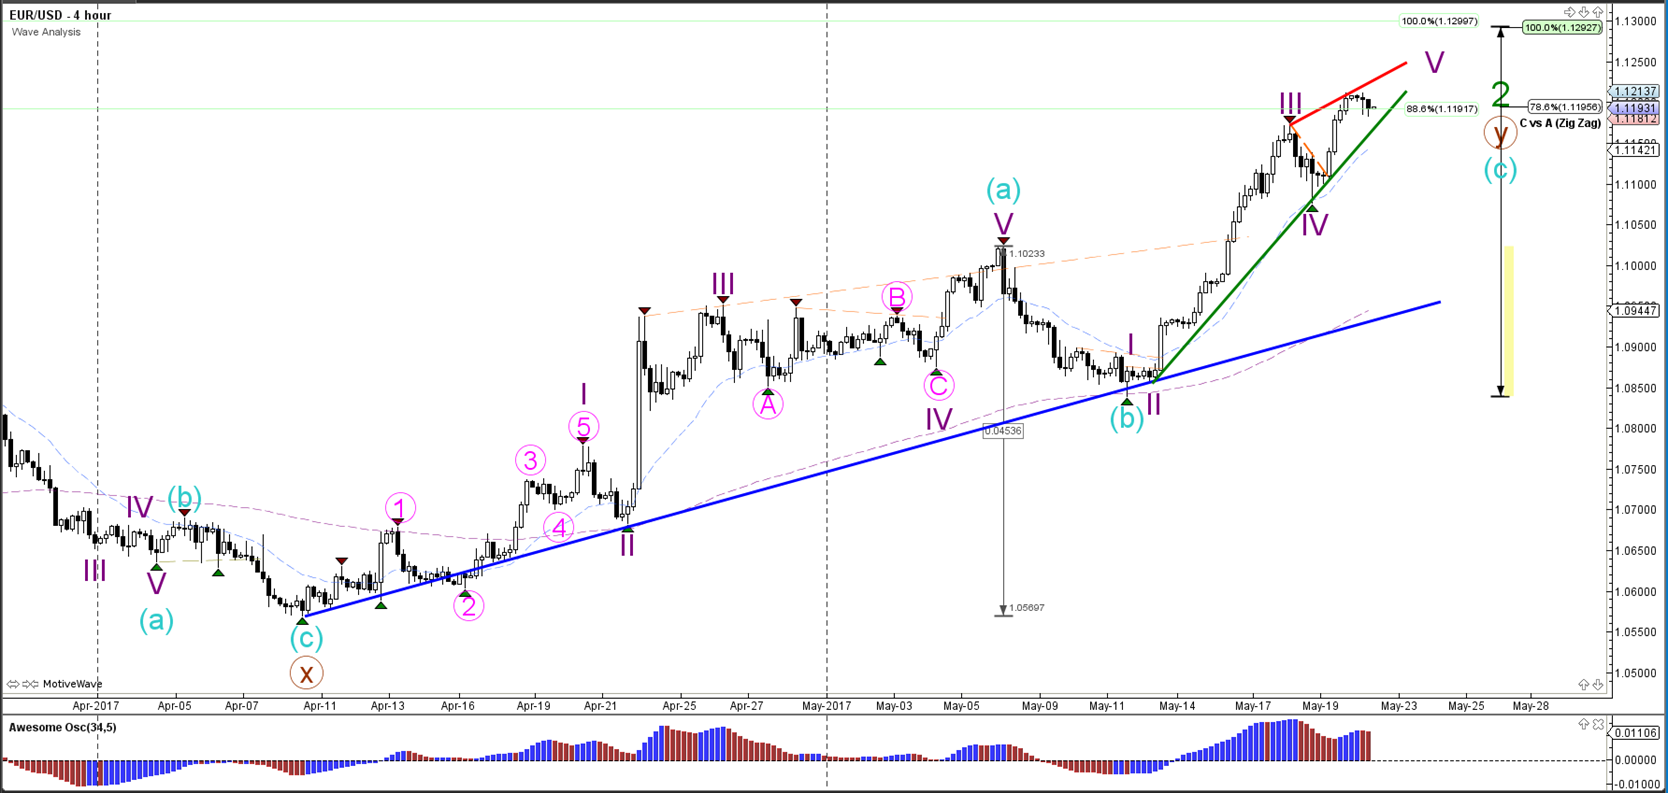
The EUR/USD indeed started and completed a wave 4 (purple) correction as expected last week. Price is now developing a bullish continuation within wave 5 (purple), which could complete a wave C (blue). A break above 1.13 invalidates the wave 2 (green) correction.
1 hour
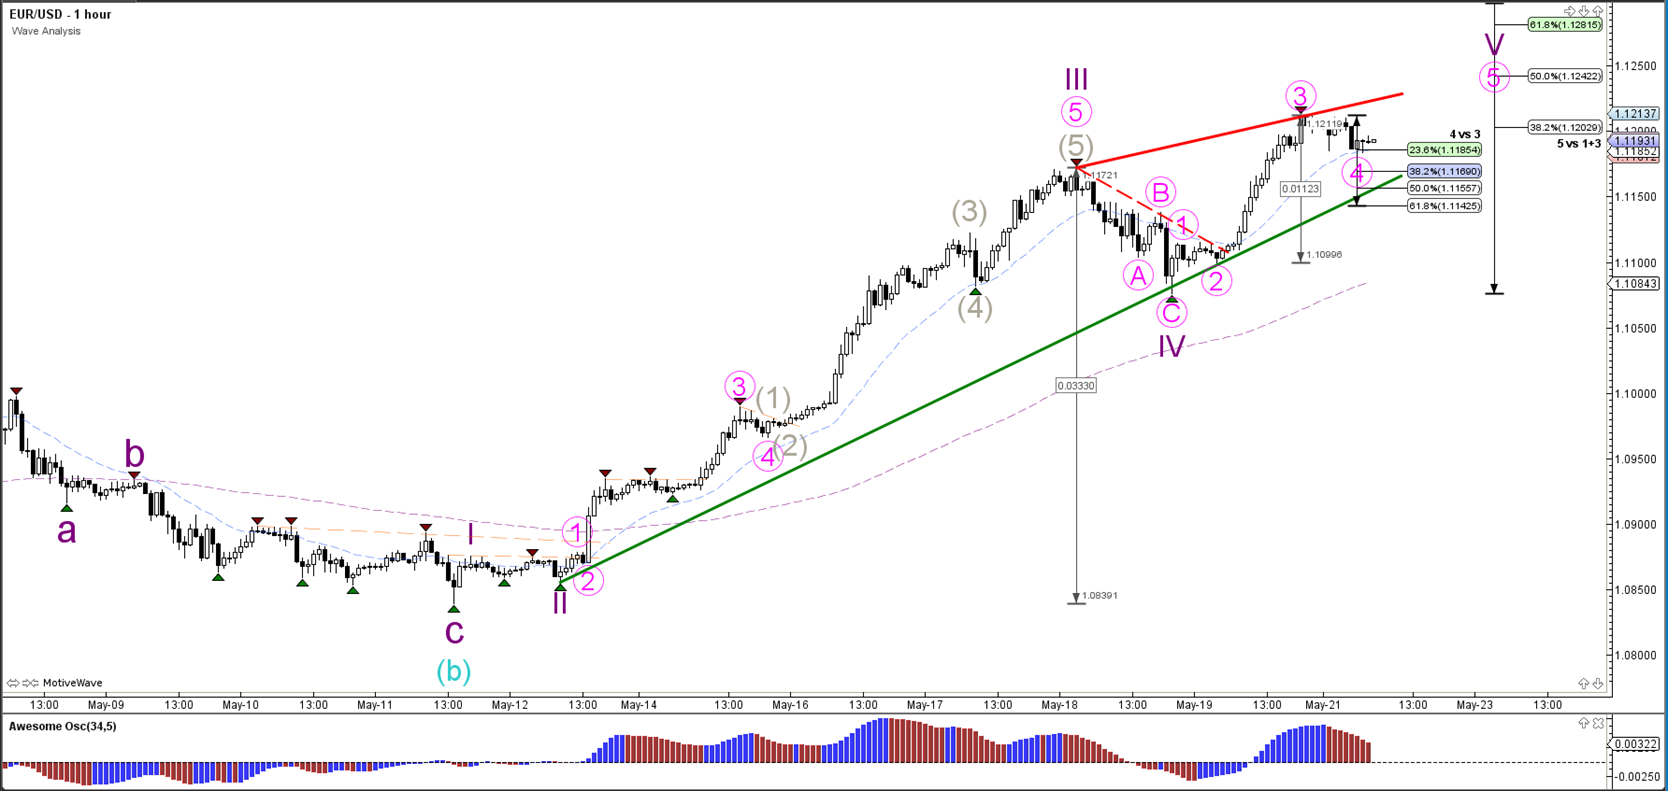
The EUR/USD bounced at the Fibonacci levels of wave 4 (purple) and then broke above the resistance trend line (dotted red). A new 5 wave (pink) formation is most likely occurring within wave 5 (purple). The current pause could be a wave 4 (pink) as long as price stays above 61.8% Fib of wave 4.
GBP/USD
4 hour
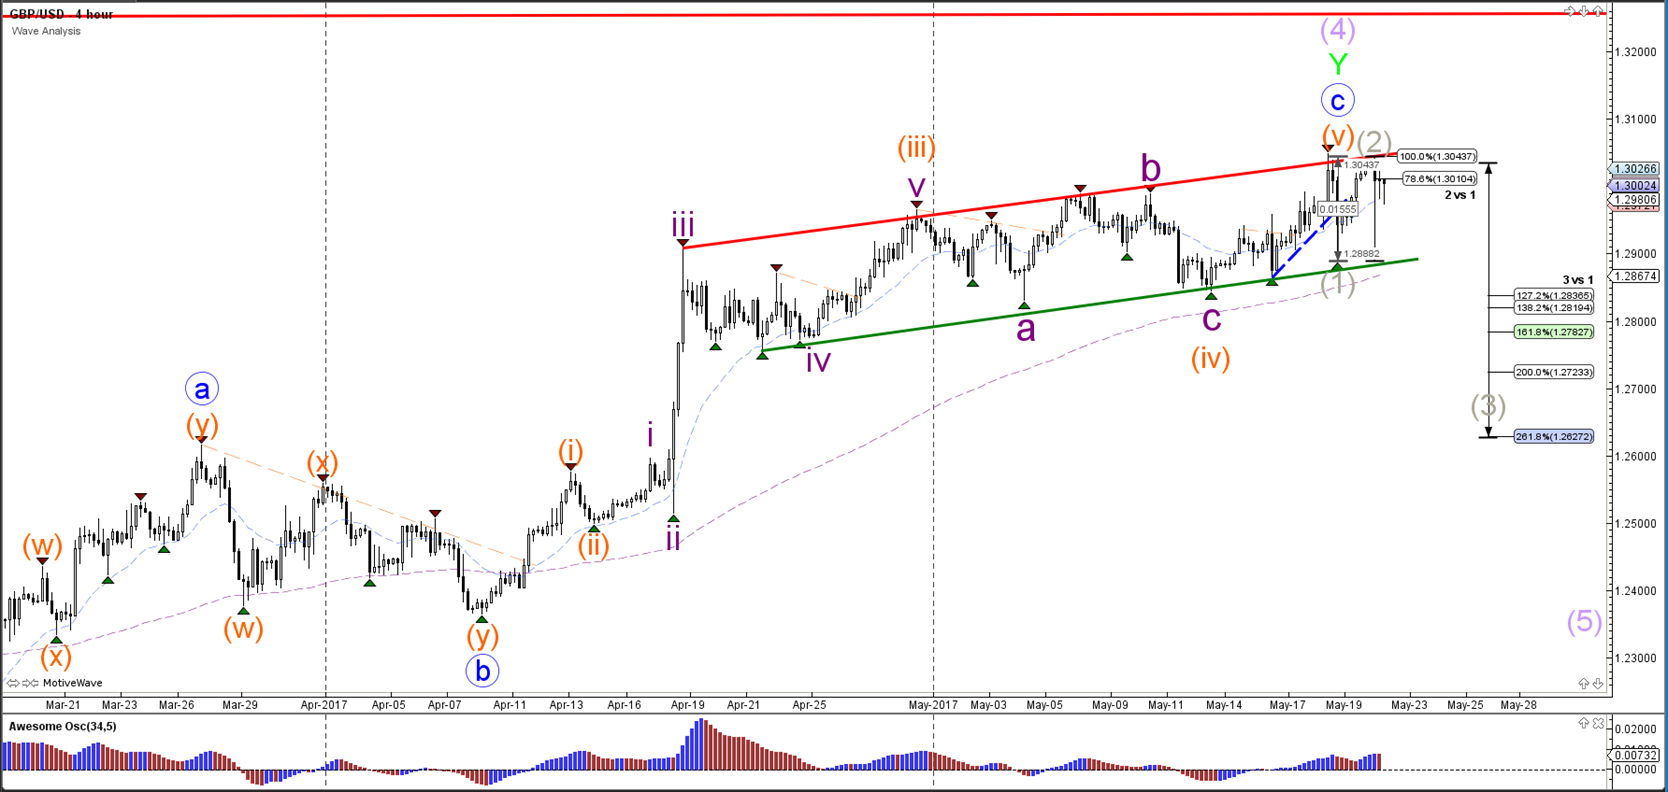
The GBP/USD could be building a wave 1-2 (grey) but this depends on whether price is able to break below the channel. A break above the 100% level indicates the invalidation of wave 2 and the potential for an uptrend continuation.
1 hour
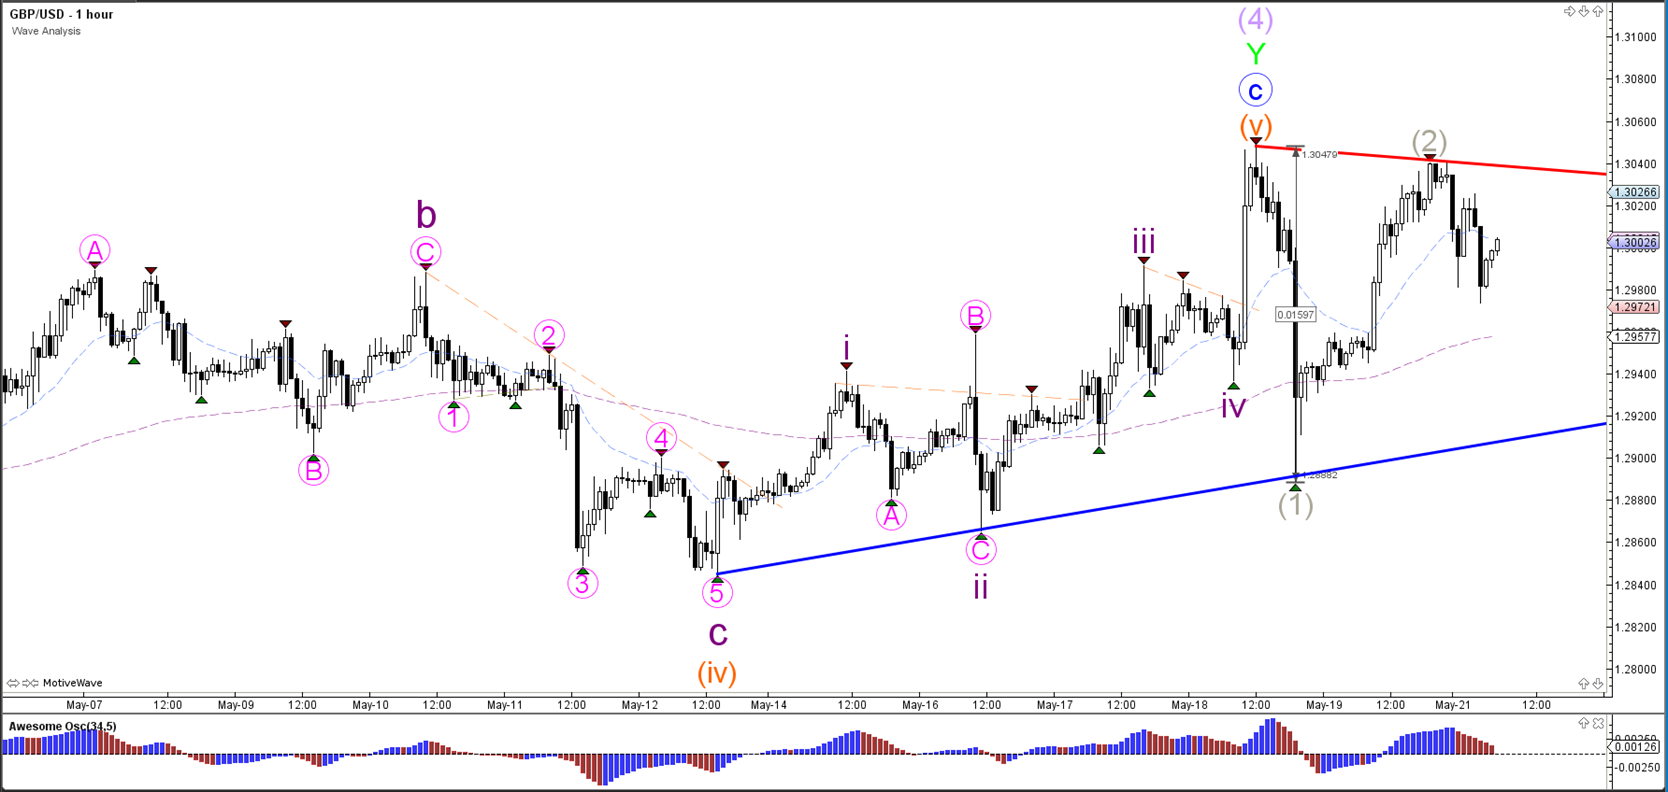
The GBP/USD break above the resistance (red) invalidates wave 2 (grey) whereas a break below the support (blue) could indicate a bearish breakout.
Follow @ChrisSvorcik on twitter for latest market updates.
Connect with Chris Svorcik on Facebook for latest market updates.