USD/JPY Approaches Critical Decision Zone at 114
USD/JPY
4 hour
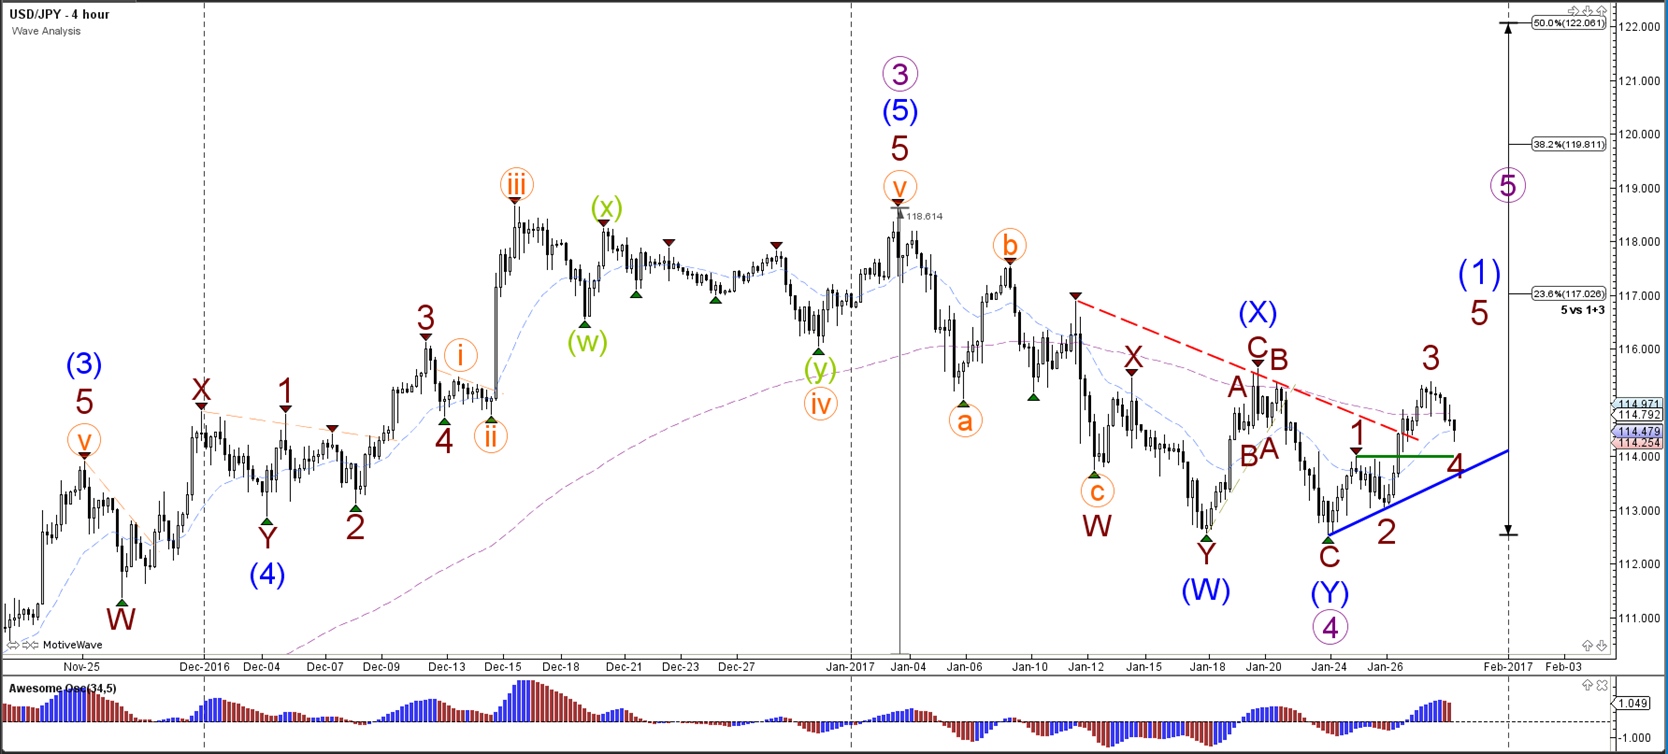
The USD/JPY broke above the resistance of the bearish trend line (dotted red). This could signal the completion of wave 4 (purple) and the start of the wave 5 (purple).
1 hour

The wave 4 (brown) retracement is invalidated if price pushes below the 61.8% Fibonacci level of wave 4 vs 3 and the previous top of wave 1 (brown). A bearish breakout (red arrow) could occur below the support level (blue) whereas a bullish breakout (green arrow) could occur above the resistance trend line (red).
EUR/USD
4 hour
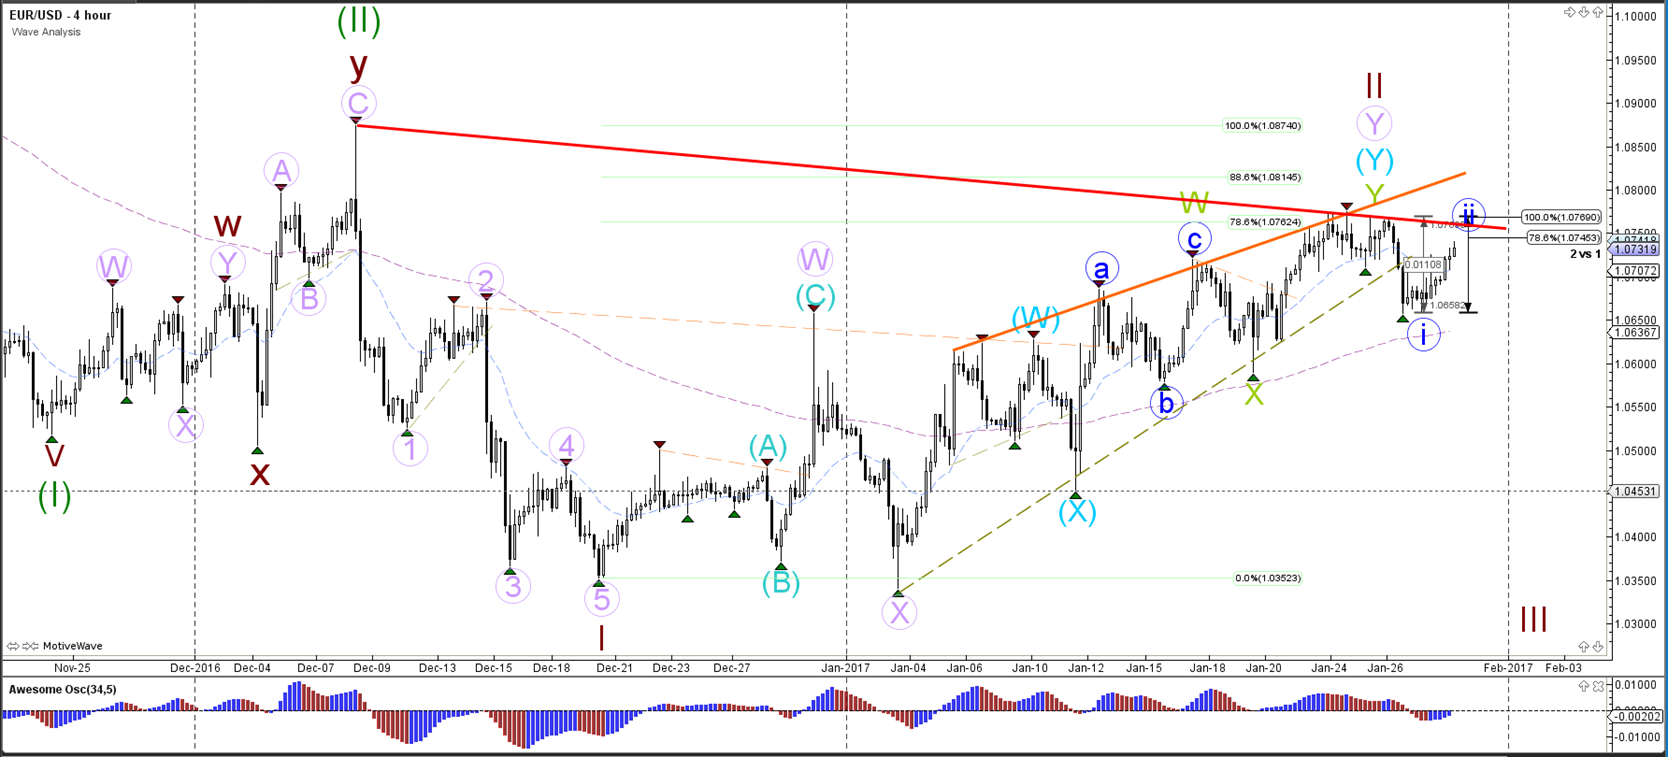
The EUR/USD showed a bearish turn at the 78.6% Fibonacci level of wave 2 vs 1 (brown). A break above the resistance trend line (red) could indicate a larger correction towards the 88.6% Fibonacci level.
1 hour
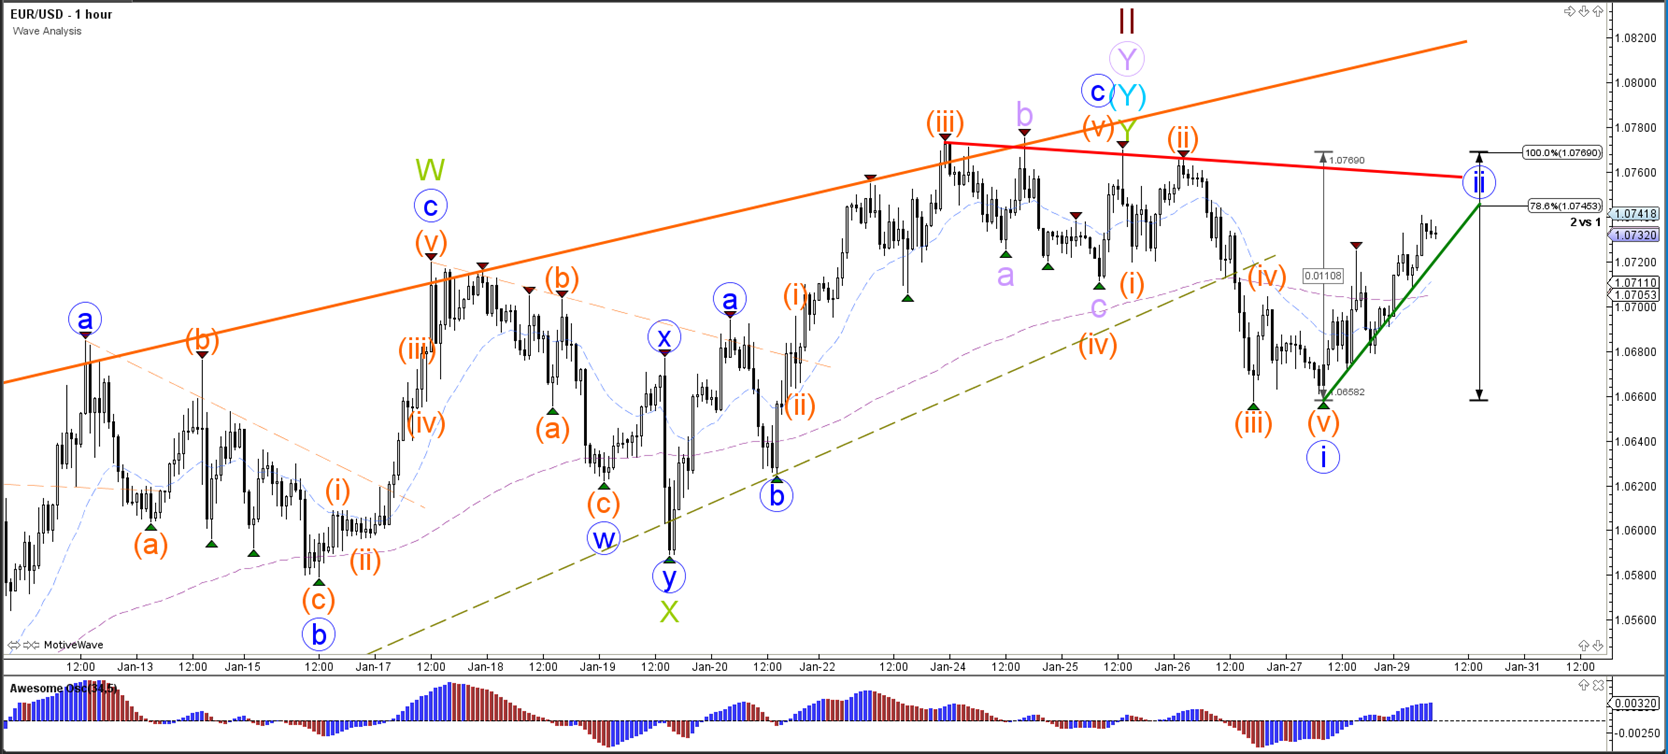
The EUR/USD bearish reaction could be a wave 1 (blue) but a break above the 100% Fibonacci level of wave 2 vs 1 invalidates this wave count.
GBP/USD
4 hour
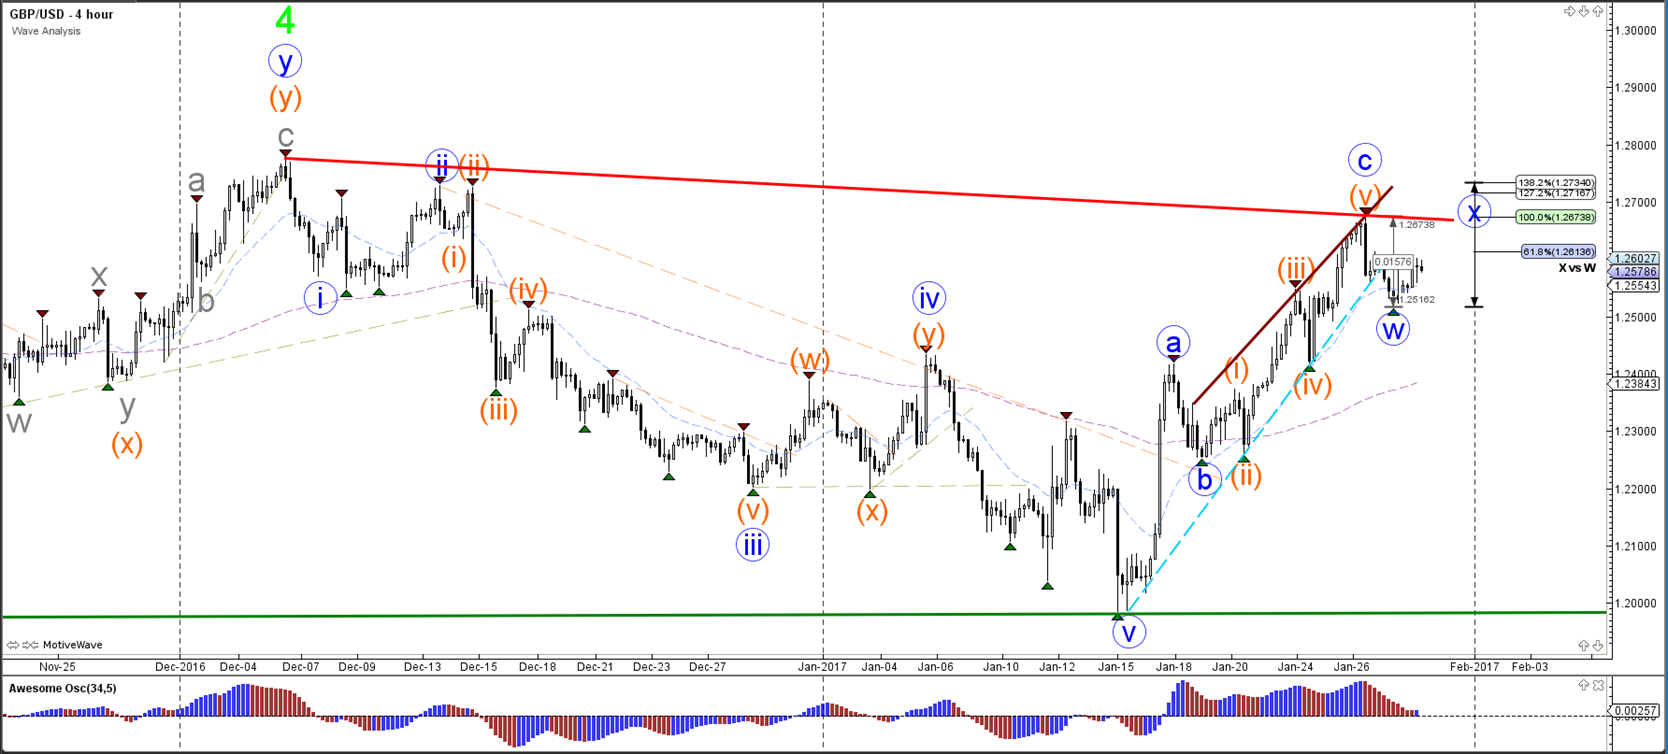
The GBP/USD seems to have completed an ABC zigzag (blue) and at the moment seems to be expanding a complex correction (wave W blue).
1 hour
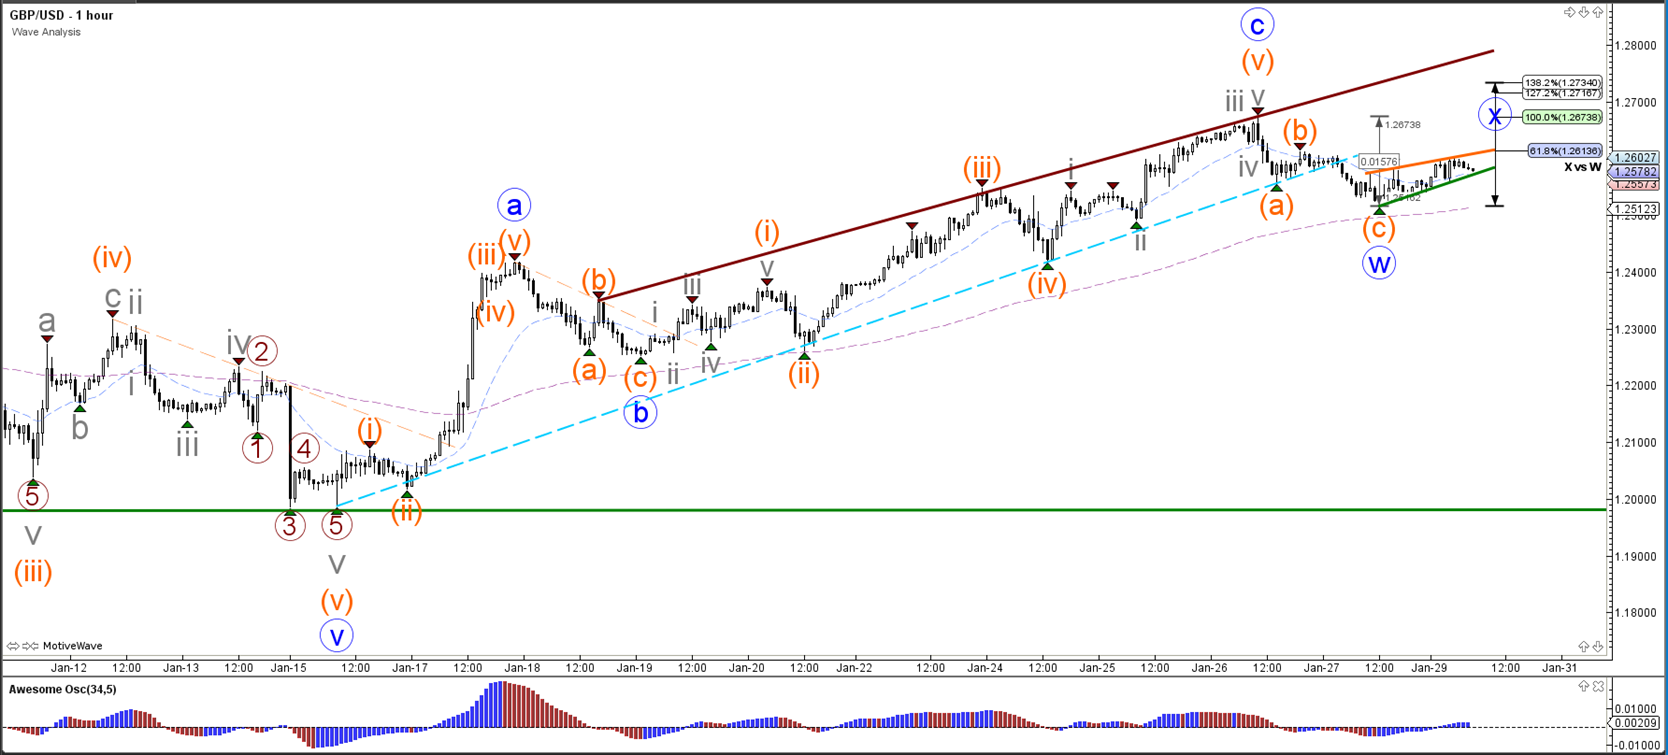
The GBP/USD built an ABC zigzag (orange) within a potential larger correction (WXY blue).
Follow @ChrisSvorcik on twitter for latest market updates