USD Bullish Momentum in Between Fibs and Trend lines
USD/JPY
4 hour
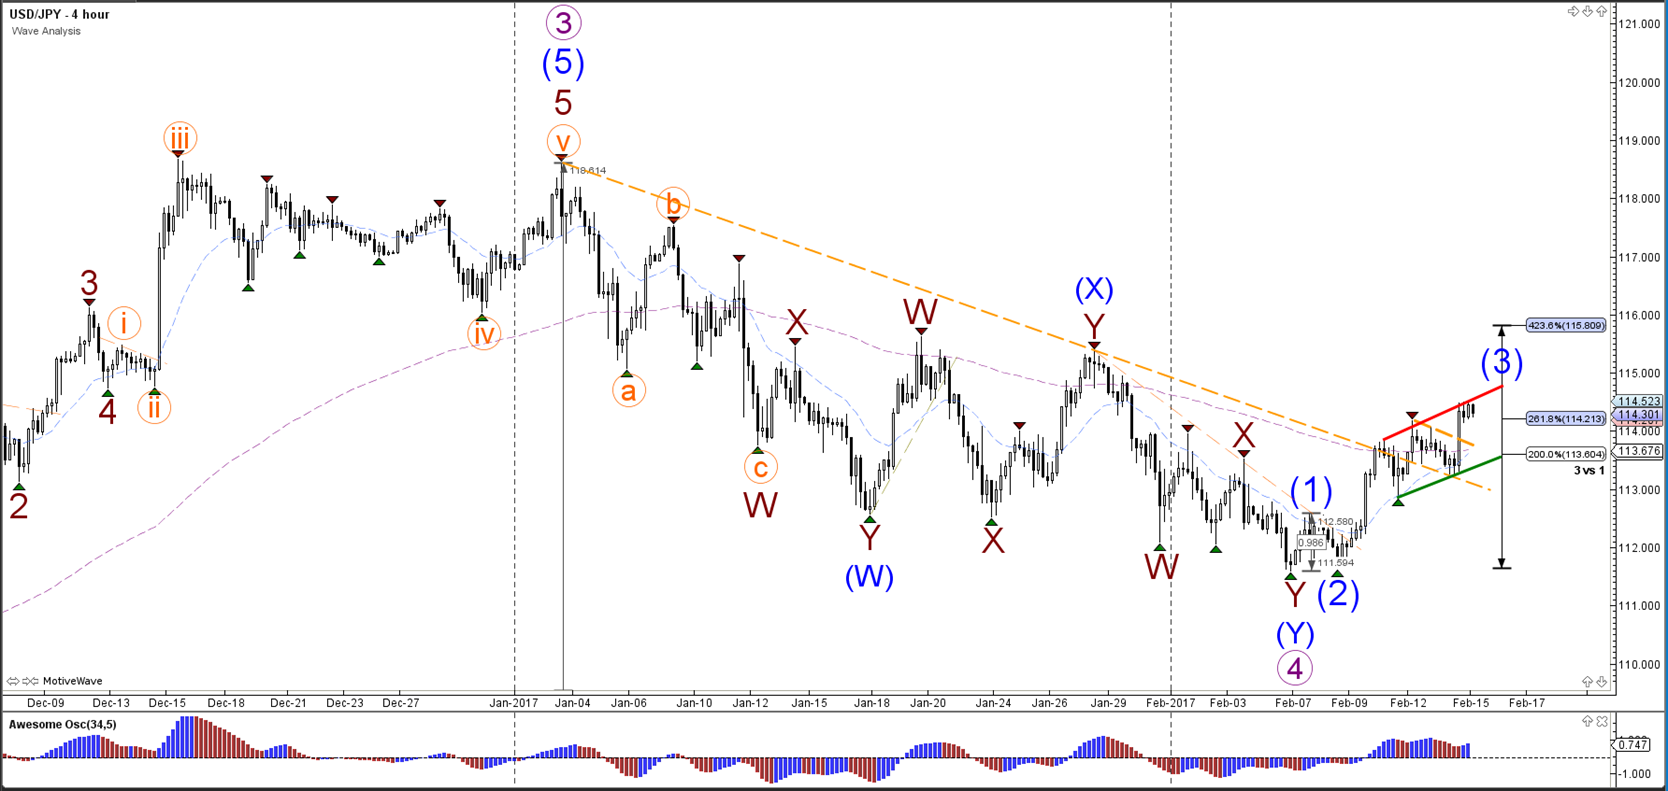
The USD/JPY has broken multiple resistance levels (dotted orange) and is continuing with its uptrend within wave 3 (blue). A bullish channel (red/green) is visible at the moment: a break above resistance (red) could see an acceleration of the trend whereas a failure to break could see price retest the bottom of the channel.
1 hour

The USD/JPY needs to break above resistance (red) and the top to expand the channel and extend the wave 3 (orange). The Fibonacci levels could as support if price fails to break resistance (red) and breaks below the small correction (purple).
EUR/USD
4 hour
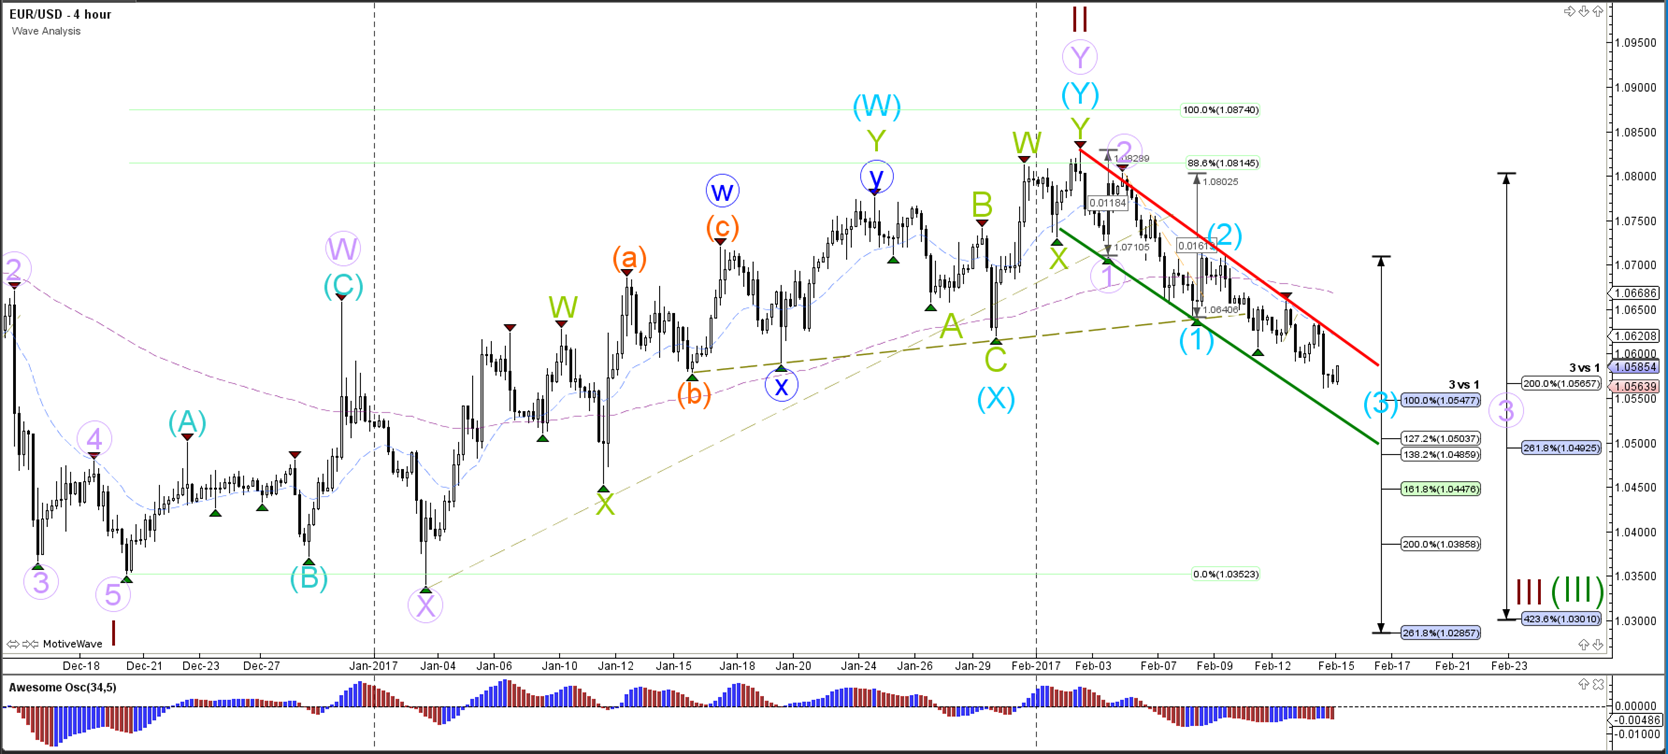
The EUR/USD turned at the resistance (red) of the bearish channel to post a new lower low, which keeps the wave 3 (blue) momentum alive. Price will not to break below the 100% Fibonacci target of wave 3 vs 1 to increase the chances of a wave 3 (blue) developing.
1 hour
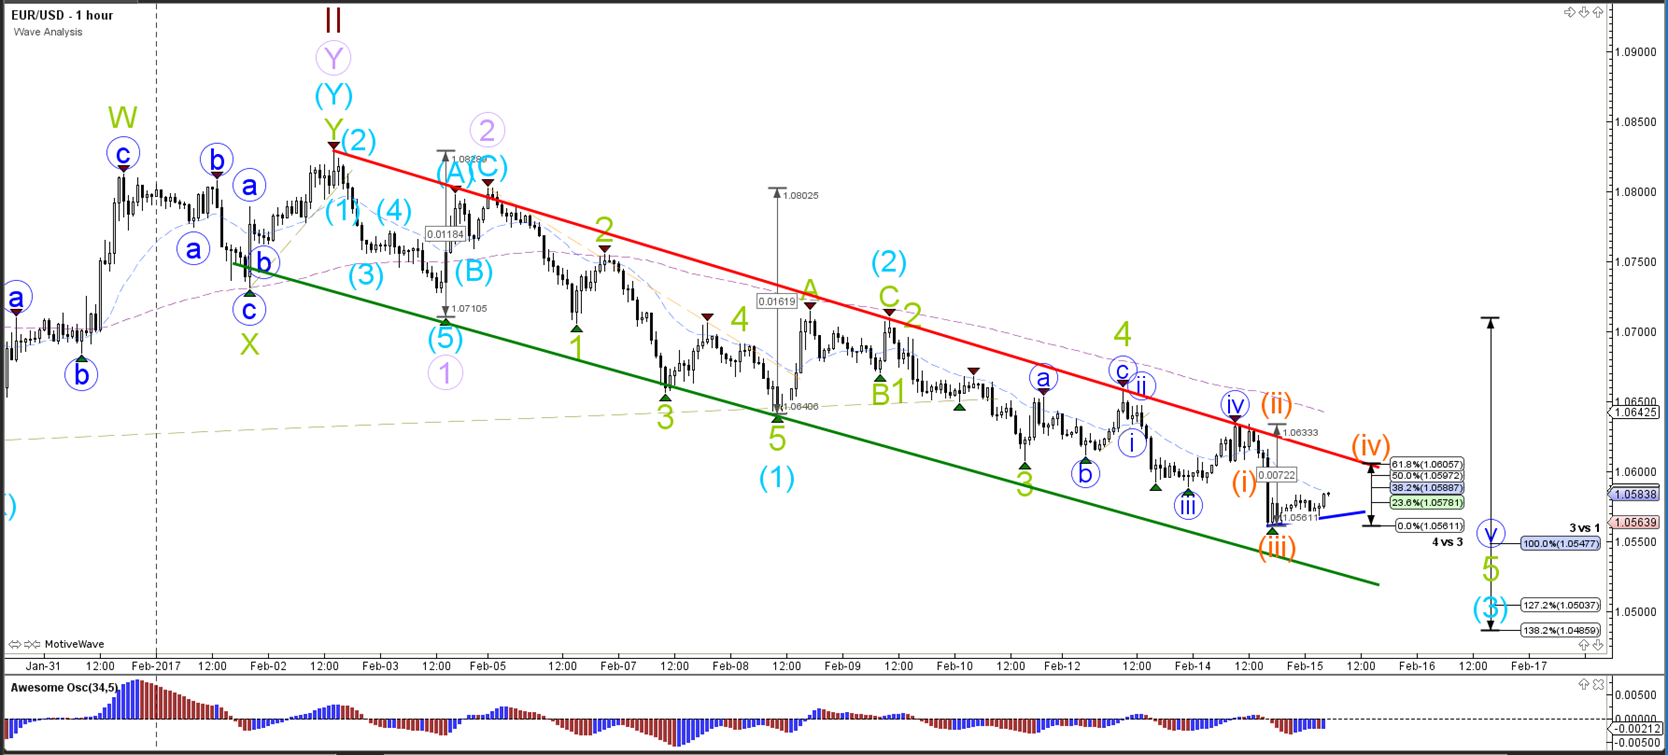
The EUR/USD completed a pullback for a wave 4 (blue) and is building a new bearish wave 5 (blue). A 5 wave extension (orange) seems to be taking place within that wave 5 (blue). A bullish retracement that stays below the 61.8% Fibonacci level of wave 4 vs 3 and the resistance of the bearish channel could see a continuation of the bearish trend. A break above that point invalidates the wave 4 (orange).
GBP/USD
4 hour
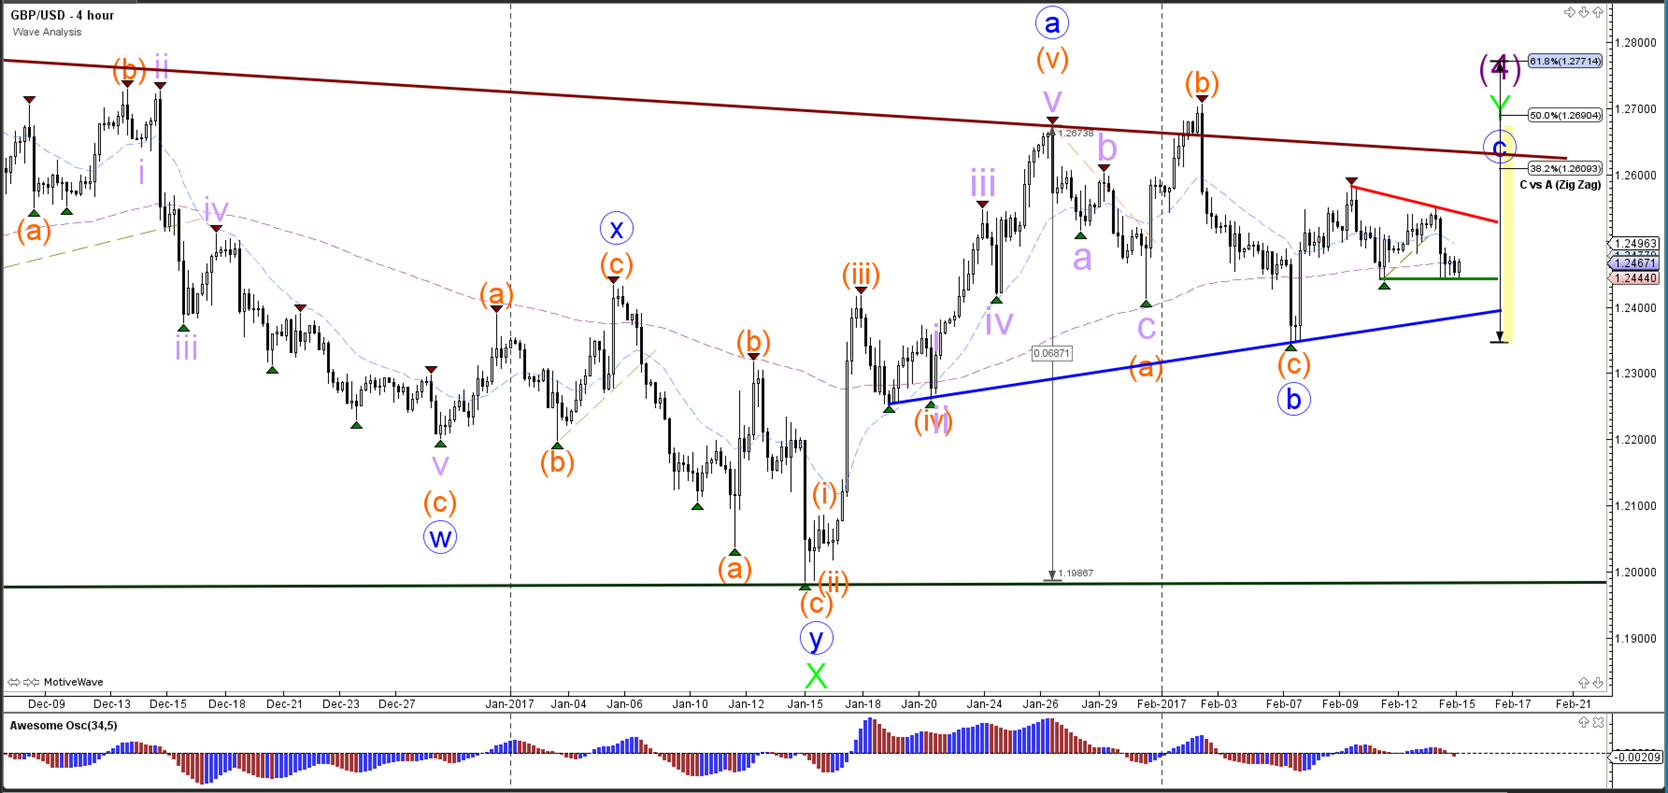
The GBP/USD failed to show a bullish breakout yesterday and is expanding the correction. The support (green) and resistance (red) trend lines indicate the key decision zones within a larger triangle (dark red/blue/dark rgeen).
1 hour
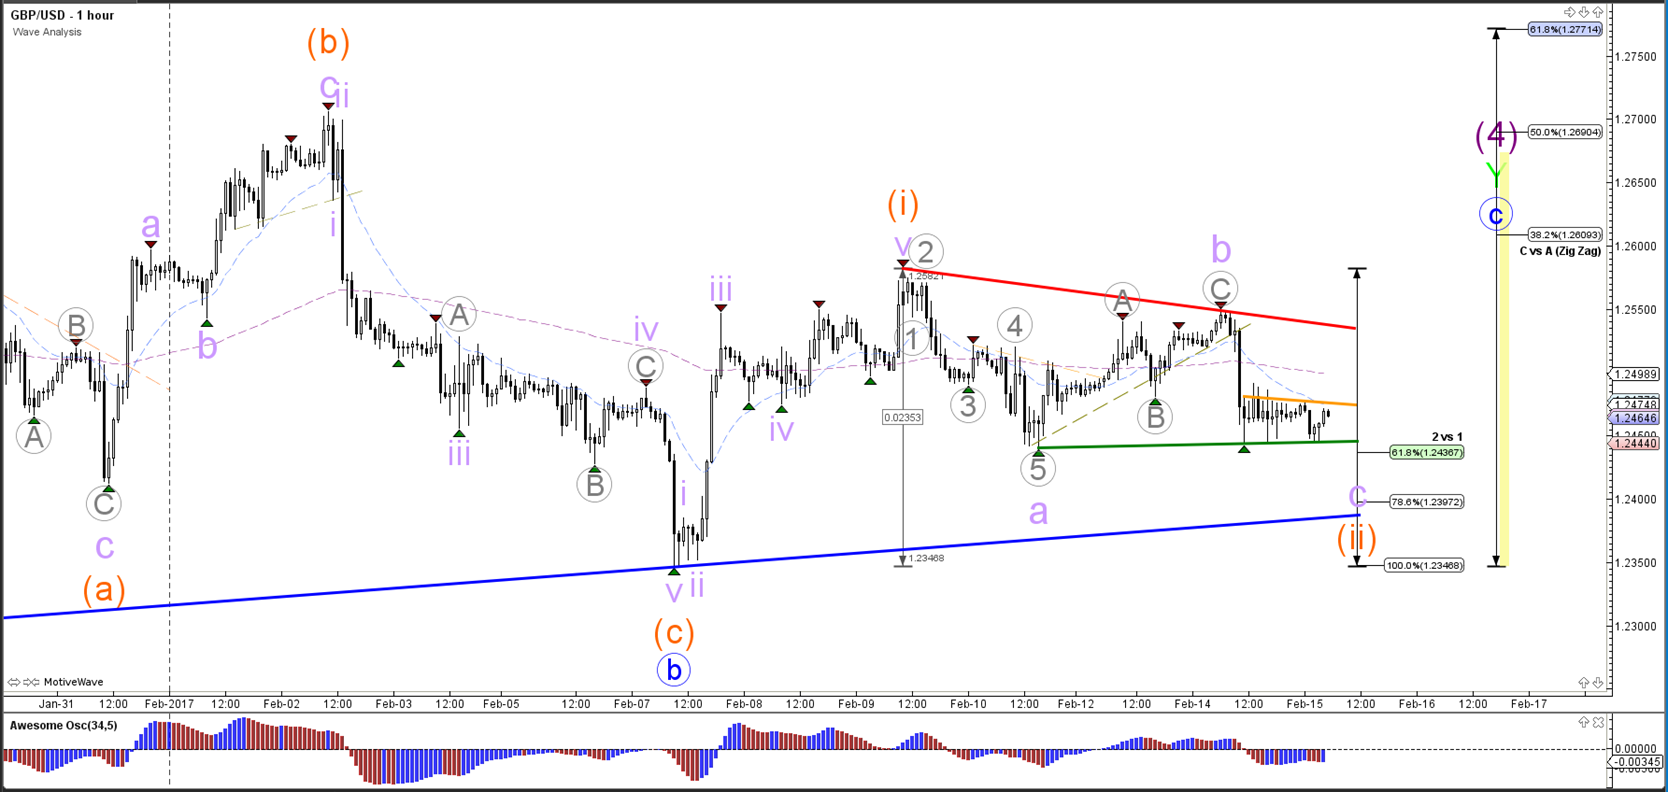
The GBP/USD failure to break the top of wave 1 (orange) indicates that price built an ABC (grey) zigzag within wave B (purple). Price seems to be building a larger correction (purple ABC) within a wave 2 (orange) which becomes invalided with a break below the 100% Fib level of wave 2 vs 1.
Follow @ChrisSvorcik on twitter for latest market updates
