Video conferencing darling Zoom presents its results from the year of the pandemic

It’s been almost a year since the beginning of the pandemic. As we mentioned yesterday, the tourism sector has been one of the great victims, while one of the big winners, alongside e-commerce, has been the popular communications and video chat company Zoom Video Communications.
This platform has grown exponentially as many companies transition their employees into a remote work policy in order to avoid contagion, and this platform became popular among the general public as a tool for communication while home.
During yesterday's trading day, the company based in San José in California, announced its results for 2020, highlighting an increase in income of 326%, and improving its prospects for 2021.
Specifically, Zoom reported earnings per share of $1.22 on earnings of $882.49 billion versus expected earnings of $0.7913 per share on earnings of $ 811 billion expected by market consensus, so these results were clearly very positive.
These results were announced after the close of the markets, causing today's pre-opening to anticipate a rise of 8%, adding to the increases of more than 9% of the day yesterday.
Technically speaking, if we look at the daily chart, we can see that since March 1, 2020 the price has experienced a sharp rise from the level close to $ 100 per share where it was at that time until reaching its historical maximum of $588.66 per share on October 19.
From that moment, the price began to correct that has led it to face its 200-session moving average, falling back to the zone of $ 325 per share with a fall of more than $ 260 per share.
Currently, the price is trading close to $410 per share, struggling to recover and maintain its 18 session average. Following these good results, the price could face its medium-term downtrend line in red. Overcoming this level could open the doors to a new bullish rally, although the price should face up to 4 levels of resistance to try to reach its all-time highs.
As long as the price does not break down to its 200-session moving average and the previous low zone represented by the red band, the feeling will continue to be bullish, otherwise, the loss of these levels could cause an even greater correction.
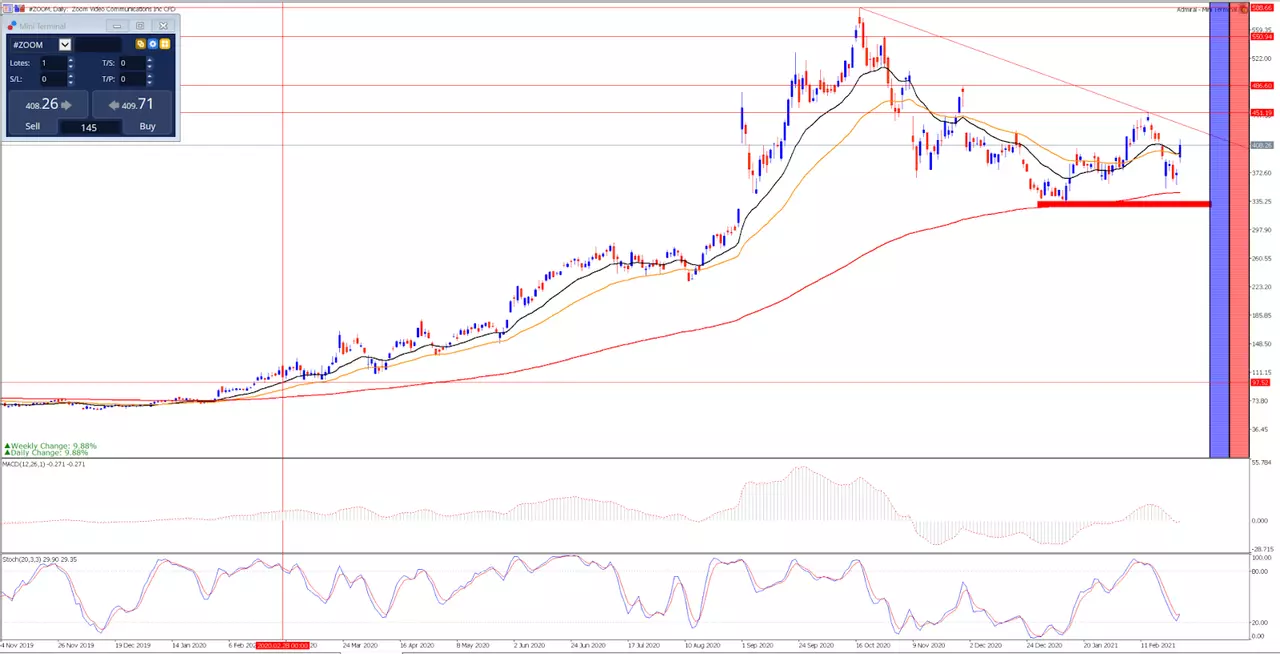
Source: Daily Zoom chart of the Admiral Markets MetaTrader 5 platform from November 4, 2019 to March 2, 2021. Taken on March 2 at 12:00 CET. Note: Past performance is not a reliable indicator of future results, or future performance.
Price evolution of the last 2 years:
- 2020: 395.77%
- 2019: -6.11%
With the Admiral Markets Trade.MT5 account, you can trade Contracts for Differences (CFDs) of Zoom and more than 3000 stocks! CFDs allow traders to try to profit from the bull and bear markets, as well as the use of leverage. Click on the following banner to open an account today:
INFORMATION ABOUT ANALYTICAL MATERIALS:
The given data provides additional information regarding all analysis, estimates, prognosis, forecasts, market reviews, weekly outlooks or other similar assessments or information (hereinafter “Analysis”) published on the websites of Admiral Markets investment firms operating under the Admiral Markets trademark (hereinafter “Admiral Markets”) Before making any investment decisions please pay close attention to the following:
- This is a marketing communication. The content is published for informative purposes only and is in no way to be construed as investment advice or recommendation. It has not been prepared in accordance with legal requirements designed to promote the independence of investment research, and that it is not subject to any prohibition on dealing ahead of the dissemination of investment research.
- Any investment decision is made by each client alone whereas Admiral Markets shall not be responsible for any loss or damage arising from any such decision, whether or not based on the content.
- With view to protecting the interests of our clients and the objectivity of the Analysis, Admiral Markets has established relevant internal procedures for prevention and management of conflicts of interest.
- The Analysis is prepared by an independent analyst, Roberto Rojas (analyst), (hereinafter “Author”) based on their personal estimations.
- Whilst every reasonable effort is taken to ensure that all sources of the content are reliable and that all information is presented, as much as possible, in an understandable, timely, precise and complete manner, Admiral Markets does not guarantee the accuracy or completeness of any information contained within the Analysis.
- Any kind of past or modeled performance of financial instruments indicated within the content should not be construed as an express or implied promise, guarantee or implication by Admiral Markets for any future performance. The value of the financial instrument may both increase and decrease and the preservation of the asset value is not guaranteed.
- Leveraged products (including contracts for difference) are speculative in nature and may result in losses or profit. Before you start trading, please ensure that you fully understand the risks involved.

