How to Trade JPMorgan After Q3 2025 Performance

Founded over two centuries ago and headquartered in New York City, JPMorgan Chase & Co. (NYSE: JPM) stands as one of the most influential financial institutions globally. The bank operates across Consumer & Community Banking, Commercial and Investment Banking, and Asset & Wealth Management.
In its latest earnings cycle, JPMorgan reported its third-quarter results. Below, we’ll take a closer look at the numbers and what analysts are forecasting for the stock.
This material is for informational purposes only and not financial advice. Consult a financial advisor before making investment decisions.
JPMorgan’s Q3 2025 Performance Summary

- The Invest.MT5 account allows you to buy real stocks and shares from some of the largest stock exchanges in the world.
- Risk Warning: Past performance is not a reliable indicator of future results or future performance. All trading is high risk, and you can lose more than you risk on a trade. Never invest more than you can afford to lose as some trades will lose and some trades will win. Start small to understand your own risk tolerance levels or practice on a demo account first to build your knowledge before investing.
- Trading is not suitable for everyone. Trading is highly speculative and carries a significant risk of loss. While it offers potential opportunities, it also involves high volatility, and leveraged trading can amplify both gains and losses. Retail investors should fully understand these risks before trading.
Key Takeaways
- JPMorgan reported net income of US$14.4 billion, a 12% year-on-year (YoY) increase, with earnings per share rising to US$5.07 from US$4.37 a year earlier.
- Net interest income (NII) rose 2% YoY to US$24.1 billion, driven by higher revolving balances in Card Services and increased wholesale deposit balances. However, NII excluding Markets (Fixed Income and Equity Markets) was flat at US$23.4 billion, as lower rates and margin pressures limited growth.
- Non-interest revenue (NIR) jumped 16% to US$23 billion, driven by investment-banking fees and payments activity.
- Segment-wise performance:
- Consumer & Community Banking (CCB): Net income US$5.0 billion, up 24% YoY.
- Commercial & Investment Bank (CIB): Net income US$6.9 billion, up 21% YoY; revenues up 17%.
- Asset & Wealth Management (AWM): Net income US$1.7 billion, up 23% YoY; Asset Under Management (AUM) stood at US$4.6 trillion, an 18% increase YoY, while total client assets reached US$6.8 trillion, up 20% YoY.
- Credit costs totalled US$3.4 billion, reflecting both actual loan losses and reserves. Net charge-offs were US$2.6 billion, up US$506 million YoY, mainly driven by the Wholesale and Card Services segments. The firm also built US$810 million in reserves, with US$608 million allocated to Consumer loans and $205 million to Wholesale loans.
- Chairman and CEO of JPMorgan, Jamie Dimon, highlighted the bank’s strong operating momentum, but also cautioned about ongoing risks, stating: “However, there continues to be a heightened degree of uncertainty stemming from complex geopolitical conditions, tariffs and trade uncertainty, elevated asset prices and the risk of sticky inflation. As always, we hope for the best, but these complex forces reinforce why we prepare the Firm for a wide range of scenarios.”
Source: JPMorgan’s Quarterly Earnings Report and Investor Presentation
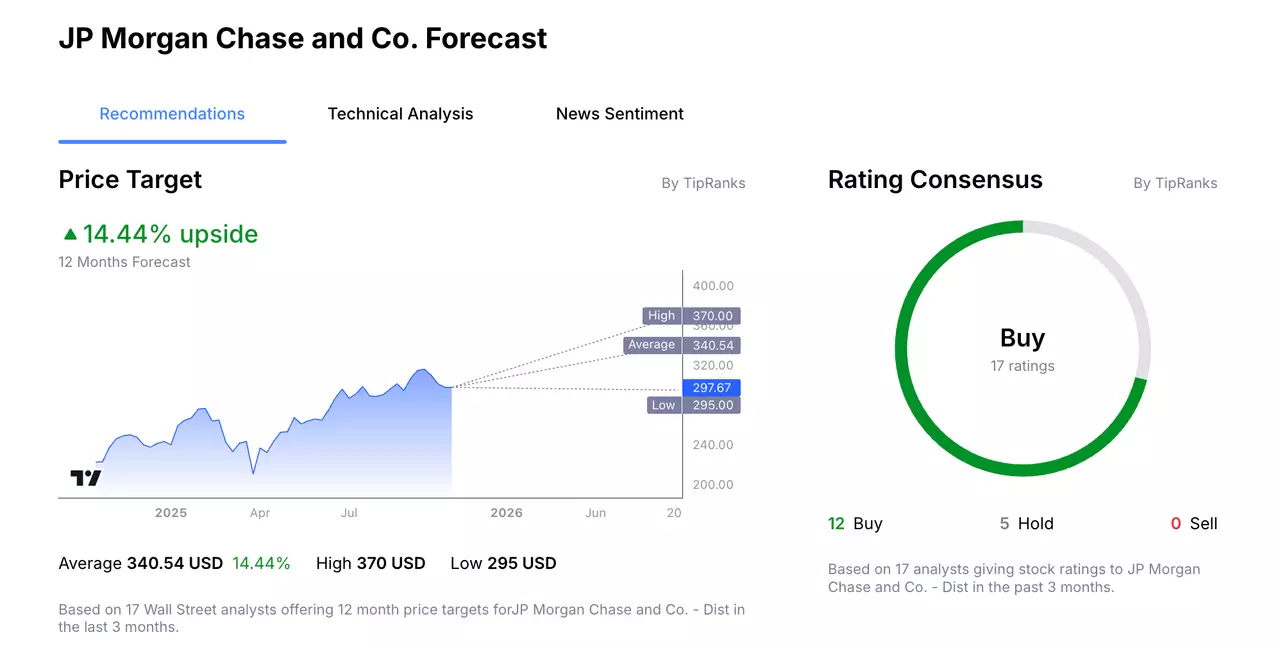
JPMorgan’s 12-Month Analyst Stock Price Forecast
According to 17 Wall Street analysts, polled by TipRanks, offering a 12-month stock price forecast for JPMorgan over the past 3 months:
- Buy Ratings: 12
- Hold Ratings: 5
- Sell Ratings: 0
- Average Price Target: $340.54
- High Price Target: $370
- Low Price Target: $295
Trading Strategy Example: JPMorgan
The following trading examples are for educational purposes only and do not constitute investment advice. Investors should conduct independent research before making trading decisions. An example trading idea for the JPMorgan’s share price could be as follows:
- Open an account with Admirals and complete the onboarding process to access the dashboard.
- Click on Trade or Invest on one of your live or demo accounts to open the web platform.
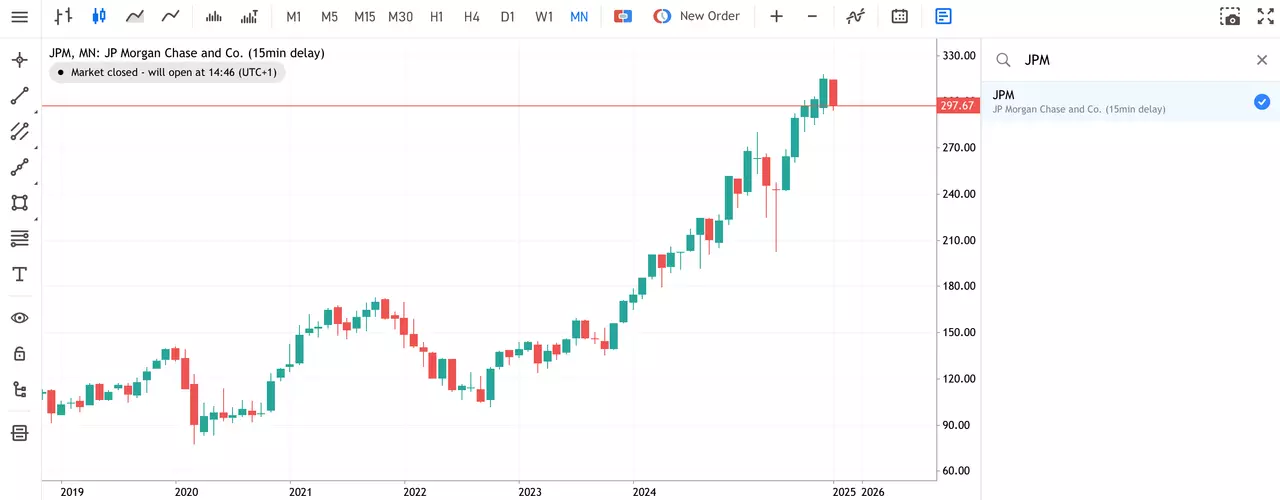
- Search for your stock in the search window at the top.
- Input your entry, stop-loss and take profit levels in the trading ticket.
Do You See the JPMorgan Stock Price Moving Differently?
If you believe there is a higher chance the share price of JPMorgan will move lower, then you can also trade short using CFDs (Contracts for Difference). However, these have higher associated risks and are not suitable for all investors. Learn more about CFDs in this How to Trade CFDs article.
The given data provides additional information regarding all analysis, estimates, prognosis, forecasts, market reviews, weekly outlooks or other similar assessments or information (hereinafter “Analysis”) published on the websites of Admirals investment firms operating under the Admirals trademark (hereinafter “Admirals”) Before making any investment decisions please pay close attention to the following:
How to Buy JPMorgan Stock in 4 Steps
Remember that markets are volatile, and JPMorgan’s stock price will fluctuate and may even trend lower. Its Q3 2025 results highlight strong earnings growth and continued momentum across all its segments. However, macroeconomic uncertainty including geopolitical tensions and sticky inflation remain headwinds for the bank. Even though the stock is trading near its all-time highs, it may see pullbacks as investors react to factors such as changing interest rates or broader market volatility.