How to Trade TD SYNNEX After Fiscal Q3 Earnings


TD SYNNEX is a global technology distributor and solutions provider which connects IT manufacturers with more than 150,000 customers across over 100 countries. Its portfolio spans areas including cloud computing, cybersecurity, data centres and artificial intelligence (AI).
On 24 September, TD SYNNEX reported record results for its fiscal third quarter, with revenue and earnings coming above the company’s previous outlook. Revenue jumped almost 38% year on year, whilst non-GAAP diluted earnings per share rose almost 59%.
The company also highlighted growing enterprise AI adoption and continued investment in data center infrastructure as potential drivers of future demand. However, despite strong growth, gross margin declined compared with the same period last year. Keep reading to find out more and learn what analysts are predicting for TD SYNNEX stock.
The information in this article is provided for educational purposes only and does not constitute financial advice. Consult a financial advisor before making investment decisions.
- The Invest.MT5 Account allows you to buy real stocks and shares from some of the largest stock exchanges in the world.
- Risk Warning: Past performance is not a reliable indicator of future results or future performance. All trading is high risk, and you can lose more than you risk on a trade. Never invest more than you can afford to lose as some trades will lose and some trades will win. Start small to understand your own risk tolerance levels or practice on a demo account first to build your knowledge before investing.
- Trading is not suitable for everyone. Trading is highly speculative and carries a significant risk of loss. While it offers potential opportunities, it also involves high volatility, and leveraged trading can amplify both gains and losses. Retail investors should fully understand these risks before trading.

TD SYNNEX Fiscal Q3 Performance Summary
-
Revenue jumped 37.7% year on year to a record $21.56 billion, up from $15.65 billion a year earlier and well above the company’s previous outlook of $18.2 billion to $19.0 billion
-
Non-GAAP gross billings rose 40.0% to $31.83 billion, compared with $22.73 billion in the same quarter last year.
-
Operating income surged 67.6% to $643 million, up from $384 million a year earlier, whilst operating margin increased to 2.98% from 2.45%.
-
-
On a non-GAAP basis, operating income increased 55.1% to $736 million, whilst non-GAAP operating margin improved to 3.42% from 3.03%.
-
-
Net income climbed 83.5% to $416 million, compared with $227 million in fiscal Q3 2025. Diluted earnings per share (EPS) rose 89.1% to $5.18.
-
-
Non-GAAP diluted EPS increased 58.7% to $5.68, above the company’s previous guidance of $4.25 to $4.75.
-
-
Gross profit increased 26.2% to $1.43 billion, although gross margin declined to 6.61% from 7.22% a year earlier.
-
CEO Patrick Zammit said that both the company’s Distribution and Hyve businesses performed above expectations, whilst highlighting the progression of enterprise AI from experimentation towards broader production deployments.
-
-
Management also pointed to continued data centre modernisation and growing AI-related requirements in areas such as security, governance and compliance as potential sources of future demand.
-
-
TD SYNNEX returned $139 million to shareholders during the quarter, consisting of approximately $100 million in share repurchases and $38 million in dividends. The company also declared a quarterly dividend of $0.48 per share, up 9% year on year.
-
For its fiscal fourth quarter, TD SYNNEX provided the following outlook:
-
-
Revenue between $21.8 billion and $22.6 billion.
-
-
-
Non-GAAP gross billings between $31.4 billion and $32.4 billion.
-
-
-
Net income between $368 million and $408 million.
-
-
-
Non-GAAP diluted EPS between $5.65 and $6.15.
-
TD SYNNEX 12-Month Analyst Stock Price Forecast
According to 7 Wall Street analysts, polled by TipRanks, offering a 12-month stock price forecast for TD SYNNEX over the past 3 months:
- Buy Ratings: 6
- Hold Ratings: 1
- Sell Ratings: 0
- Average Price Target: $338.57
- High Price Target: $379.00
- Low Price Target: $287.00
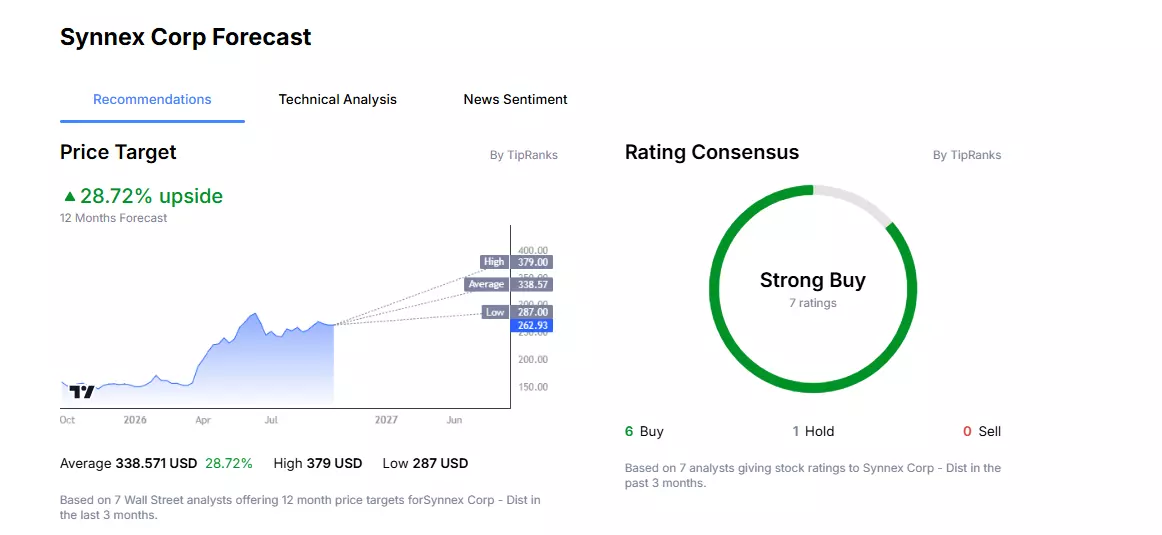
Source: Admirals Stock List Macroscope - Synnex Corp. Date captured: 28 September 2026. Past performance is not a reliable indicator of future results.
Trading Strategy Example: TD SYNNEX
The following trading examples are for educational purposes only and do not constitute investment advice. Investors should conduct independent research before making trading decisions. An example trading idea for TD SYNNEX could be as follows:
Two key considerations to keep in mind here are AI infrastructure demand and margins.
TD SYNNEX’s fiscal Q3 results highlighted the strength of demand across its technology ecosystem, with revenue rising 37.7% year on year to $21.56 billion. Management also highlighted continued data center modernization and the progression of enterprise AI from experimentation towards broader production deployments. Continued investment in AI infrastructure could therefore support demand across TD SYNNEX’s portfolio.
However, investors should also keep an eye on profitability. Despite the strong increase in revenue, gross margin declined to 6.61% from 7.22% in the same quarter last year. Technology distribution is typically a high-volume, low-margin business, meaning that continued revenue growth may not necessarily translate into proportional profit growth if margins remain under pressure.
There were positive signs further down the income statement, with operating income increasing 67.6% and operating margin improving from 2.45% to 2.98%. Going forward, the interaction between strong AI-related demand and TD SYNNEX’s ability to maintain margins could be an important factor for the stock.
How to Buy TD SYNNEX Stock in 4 Steps
- Open an account with Admirals and complete the onboarding process to access the dashboard.
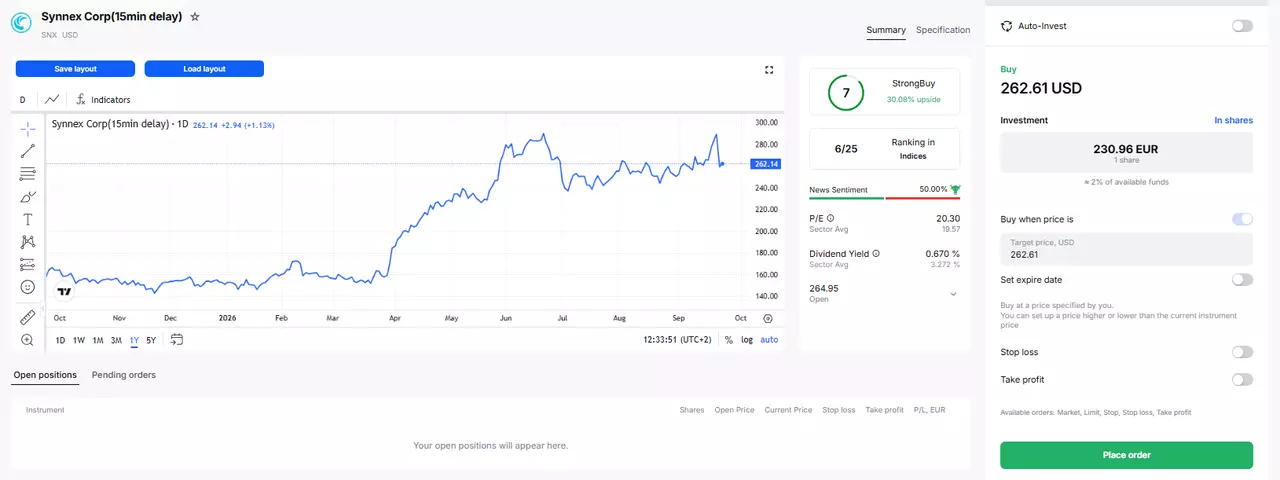
- Click on Trade or Invest on one of your live or demo accounts to open the Admirals Platform.
- Search for TD SYNNEX using its ticker symbol, SNX.
- Select your position size and place your order, whilst considering your individual risk tolerance and investment objectives.

Do You See the TD SYNNEX Stock Price Moving Differently?
If you believe there is a higher chance that the share price of TD SYNNEX will move lower, then you can also trade short using CFDs (Contracts for Difference). However, these have higher associated risks and are not suitable for all investors.
Learn more about CFDs in our How to Trade CFDs article.
The given data provides additional information regarding all analysis, estimates, prognosis, forecasts, market reviews, weekly outlooks or other similar assessments or information (hereinafter “Analysis”) published on the websites of Admirals investment firms operating under the Admirals trademark (hereinafter “Admirals”) Before making any investment decisions please pay close attention to the following: