Oracle releases mixed quarterly results
The market’s attention today will mainly be focused on 2 events: the release of the latest US inflation data and Apple's annual ‘Keynote’ event, which starts at 18:00 BST. During this Keynote the company is expected to present, amongst other things, the new iPhone 13, Apple Watch Series 7 and the new AirPods.
While we wait for the important inflation data and the news coming from Apple, we will focus our attention on the results presented yesterday on Wall Street. Specifically, the results for the first fiscal quarter of the technology giant Oracle, which covers the months from May to August.
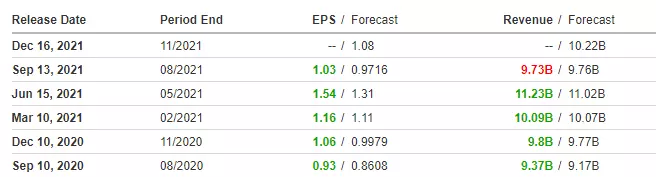
Oracle presented mixed results after the market close, in which earnings per share exceeded market expectations whilst revenue fell short for the first time in a year. Specifically, Oracle posted earnings per share of $1.03 and revenues of $9.73 billion versus the expected figures of $0.97 per share and $9.76 billion of revenue.
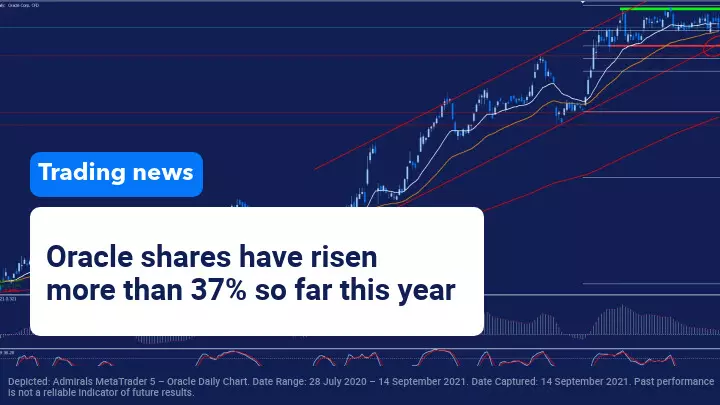
Oracle has experienced a strong increase of 37.41% in the stock market so far this year, thus outperforming its Benchmark and continuing the increases of last year through an important bullish channel that began at the beginning of the year and led it to set a high of 91.78 dollars per share in August.
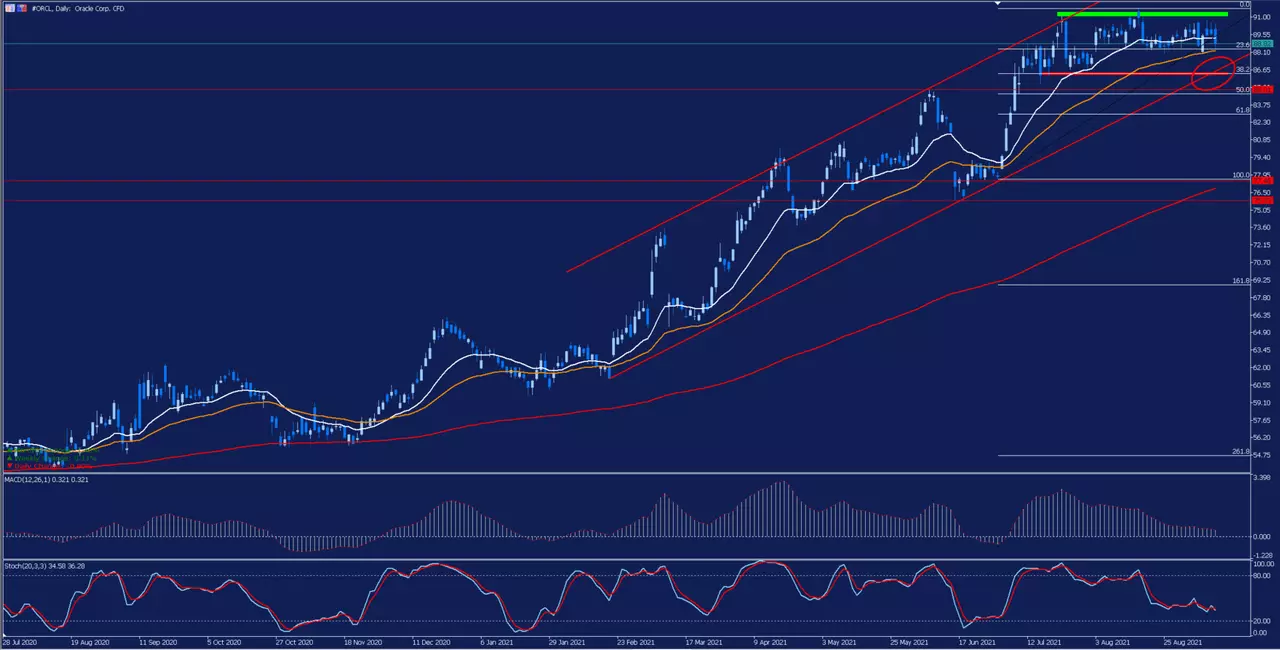
If we look at the daily chart, we can see that since the end of July, the price seems to have entered a sideways consolidation movement between the green and red bands that act as resistance and support levels respectively. Currently, the price is fighting to maintain its 18-session moving average in white and the important level of the 23.6% Fibonacci retracement that acts as the first support level. However, after yesterday's results, it is possible that the price will lose this level during today's session, due to the fact that, during the pre-opening, it is trading in negative territory, exceeding 1% at times.
The loss of this first support level opens the possibility for the price to perform a bearish impulse to its main support level - which is represented by the red circle in the area of the red band, the lower band of the bullish channel and the 38.2% Fibonacci retracement level. The loss of this important support level would open the door to a further price correction, endangering the current bullish trend.
This support level is very important and the price could form a bullish bounce at this point, although as long as it is not able to overcome its current resistance level we cannot expect a significant upward move.
Evolution of the last five years:
- 2020: 22.10%
- 2019: 17.34%
- 2018: -4.51%
- 2017: 22.96%
- 2016: 5.26%
With a Trade.MT5 account from Admirals, you can trade Contracts for Difference (CFDs) on Oracle and over 3,000 other shares! CFDs allow traders to attempt to profit from both rising and falling prices, whilst also benefiting from the use of leverage. Click the banner below to open an account today:

INFORMATION ABOUT ANALYTICAL MATERIALS:
The given data provides additional information regarding all analysis, estimates, prognosis, forecasts, market reviews, weekly outlooks or other similar assessments or information (hereinafter “Analysis”) published on the websites of Admirals investment firms operating under the Admirals trademark (hereinafter “Admirals”) Before making any investment decisions please pay close attention to the following:
- This is a marketing communication. The content is published for informative purposes only and is in no way to be construed as investment advice or recommendation. It has not been prepared in accordance with legal requirements designed to promote the independence of investment research, and that it is not subject to any prohibition on dealing ahead of the dissemination of investment research.
- Any investment decision is made by each client alone whereas Admirals shall not be responsible for any loss or damage arising from any such decision, whether or not based on the content.
- With view to protecting the interests of our clients and the objectivity of the Analysis, Admirals has established relevant internal procedures for prevention and management of conflicts of interest.
- The Analysis is prepared by an independent analyst Roberto Rojas, Freelance Contributor (hereinafter "Author") based on personal estimations.
- Whilst every reasonable effort is taken to ensure that all sources of the content are reliable and that all information is presented, as much as possible, in an understandable, timely, precise and complete manner, Admirals does not guarantee the accuracy or completeness of any information contained within the Analysis.
- Any kind of past or modelled performance of financial instruments indicated within the content should not be construed as an express or implied promise, guarantee or implication by Admirals for any future performance. The value of the financial instrument may both increase and decrease and the preservation of the asset value is not guaranteed.
- Leveraged products (including contracts for difference) are speculative in nature and may result in losses or profit. Before you start trading, please ensure that you fully understand the risks involved.

