Inditex presents its quarterly results in a day full of macroeconomic data
Yesterday, the market’s attention was focused on the release of important inflation data from the United States, which showed a slight easing as the monthly figure grew by 0.3%, 10% less than expected. The year-on-year CPI also came in 10% below what was expected at 5.3%.
Today's session has also seen the release of CPI data for the UK, France and Italy. The CPI in the UK was reported higher than had been expected by analysts, whilst in France and Italy, CPI has remained respectively in line or slightly better than what was forecast.
From China, we have also seen the release of various macroeconomic data that once again show a slowdown in the economy.
Specifically, we have learned that both the industrial production index and retail sales in China have been worse than expected after being reported at 5.3% and 2.5% against the 5.8% and 7% expected respectively. It is worth noting that this data was not only worse than expected, but also significantly lower than the previous month's figure for the second consecutive month.
This slowdown in the economy is partly explained by the problems derived from the spread of the Delta variant and by uncertainty generated by the growth of inflation and the possible start of tapering.
For the moment, this poor macro data is not being reflected in corporate earnings, as we have seen in recent weeks, and today's session saw this reflected again in the quarterly results of textile giant Inditex.
The group – which includes brands such as Zara, Stradivarius, Pull & Bear, Oysho and Bershka – reported that during the first half of the year it recorded a net profit of 1,272 million euros. This is in stark contrast to the loss of 195 million euros it reported during the same period of time last year, after recording an increase in sales of 49% to those recorded in 2020.
These results confirm the recovery of this company after the good results of the first quarter, especially after it obtained a profit of 850 million euros during the second quarter thanks to strong online sales.
If we look at the daily chart, we can see that, although the long-term trend remains bullish, in recent weeks this company is moving in a range between 28.5 and 30.20 euros per share, thus making a consolidation move after the declines made during the months of June and July after setting annual highs.
These positive results could be the catalyst for a possible upward momentum, if the price is finally able to overcome its current resistance level. Although, the reality is that we cannot rule out the possibility of a further setback since, if the outlook for the future of the economy continues to deteriorate, sales could be negatively affected over the coming months, so we should remain cautious if the price loses its current support levels.
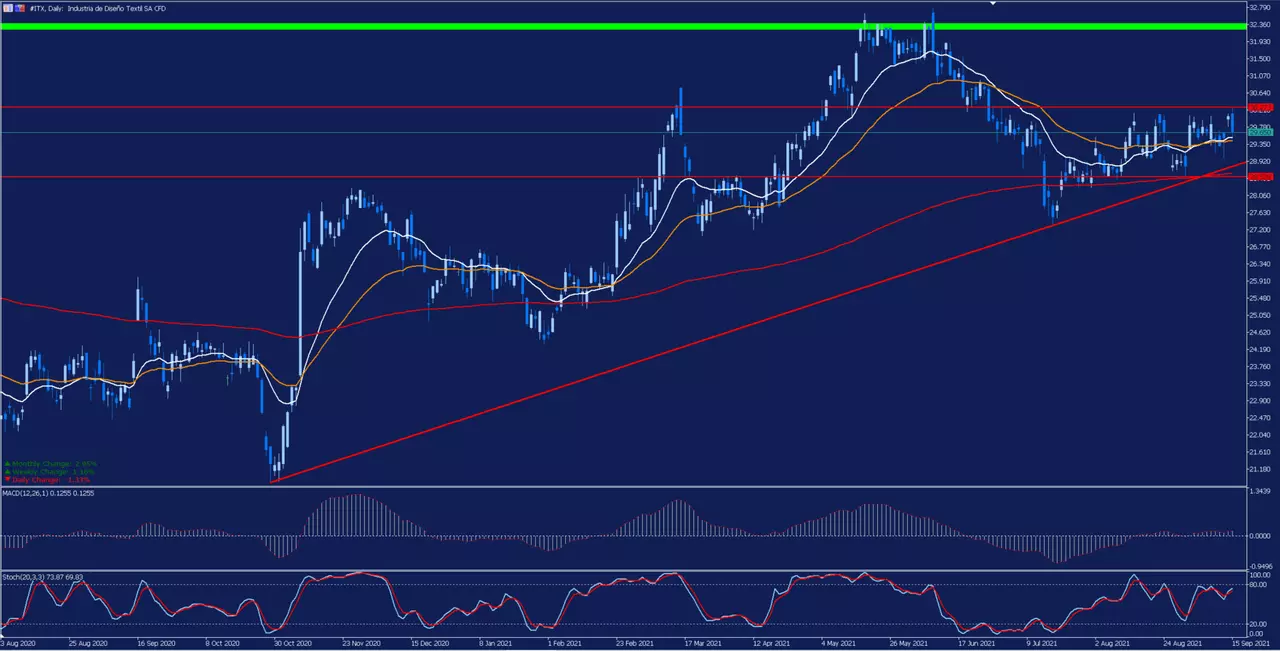
Depicted: Admirals MetaTrader 5 – Inditex Daily Chart. Date Range: 3 August 2020 – 15 September 2021. Date Captured: 15 September 2021. Past performance is not a reliable indicator of future results.
Evolution of the last five years:
- 2020: -17.20%
- 2019: 40.71%
- 2018: -23.05%
- 2017: -10.44%
- 2016: 2.33%
With the Trade.MT5 account from Admirals, you can trade Contracts for Difference (CFDs) on Inditex and more than 3,000 other shares from around the world! With CFDs, traders can attempt to profit from both rising and falling prices, whilst also benefiting from the use of leverage. Click the banner below in order to open an account today:

INFORMATION ABOUT ANALYTICAL MATERIALS:
The given data provides additional information regarding all analysis, estimates, prognosis, forecasts, market reviews, weekly outlooks or other similar assessments or information (hereinafter “Analysis”) published on the websites of Admirals investment firms operating under the Admirals trademark (hereinafter “Admirals”) Before making any investment decisions please pay close attention to the following:
1. This is a marketing communication. The content is published for informative purposes only and is in no way to be construed as investment advice or recommendation. It has not been prepared in accordance with legal requirements designed to promote the independence of investment research, and that it is not subject to any prohibition on dealing ahead of the dissemination of investment research.
2. Any investment decision is made by each client alone whereas Admirals shall not be responsible for any loss or damage arising from any such decision, whether or not based on the content.
3. With view to protecting the interests of our clients and the objectivity of the Analysis, Admirals has established relevant internal procedures for prevention and management of conflicts of interest.
4. The Analysis is prepared by an independent analyst Roberto Rivero, Freelance Contributor (hereinafter "Author") based on personal estimations.
5. Whilst every reasonable effort is taken to ensure that all sources of the content are reliable and that all information is presented, as much as possible, in an understandable, timely, precise and complete manner, Admirals does not guarantee the accuracy or completeness of any information contained within the Analysis.
6. Any kind of past or modelled performance of financial instruments indicated within the content should not be construed as an express or implied promise, guarantee or implication by Admirals for any future performance. The value of the financial instrument may both increase and decrease and the preservation of the asset value is not guaranteed.
7. Leveraged products (including contracts for difference) are speculative in nature and may result in losses or profit. Before you start trading, please ensure that you fully understand the risks involved.