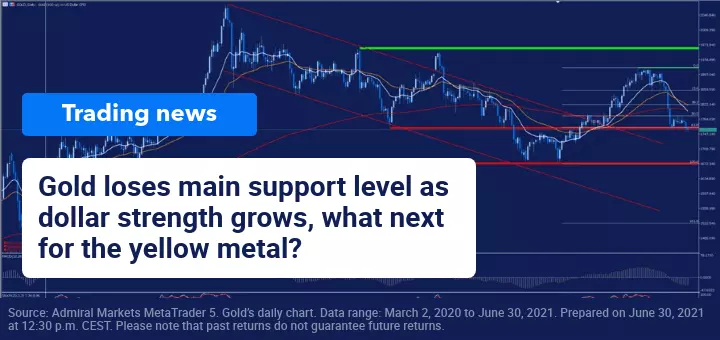
Gold loses its main support level
If we look at the stock market and the main US indices, we can see how, during the last few sessions, it seems that for the moment the market is willing to buy the version of the Federal Reserve in relation to inflation. For the moment this situation seems somewhat transient, although as we could see in the press conference of last June 17 by Jerome Powell, if the economic recovery continues with the current pace, the Fed would be willing to assess the possibility of starting tapering in the next meetings. However, the market consensus does not expect any announcement or reaction until after the annual symposium in Jackson Hole next August.
Last week, in our analysis of commodities, we commented that, following such words, the rumours increased in relation to a possible tapering, with gold being the big loser, after the strong rebound of the dollar before the possible change in the current monetary policy.
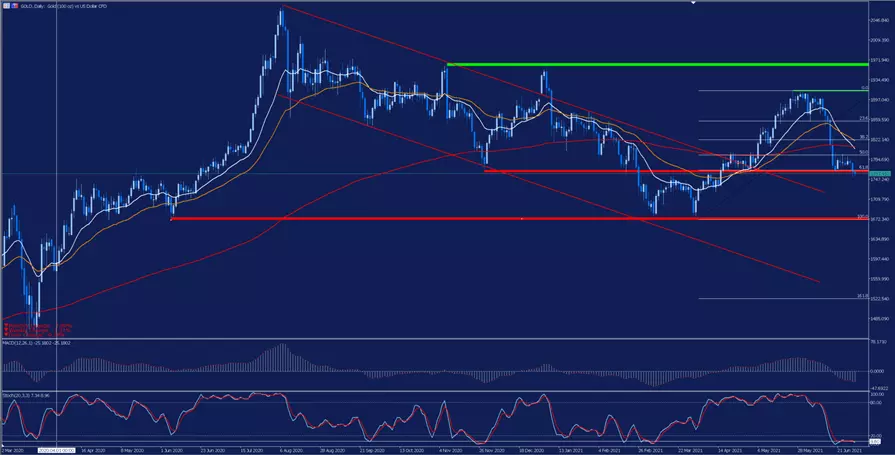
This strength of the dollar has endangered the upward structure that gold had been following, after confirming the formation of a triple ground in the red at the end of last March. This was where a new upward momentum began, which led it to break up the bearish channel that it had been following since its historical highs. If we look at the daily chart, we can see how, during yesterday's session, gold lost its main support level in the coincident zone of its 61.8% fibonacci retracement level and the red band.
This breakout is being confirmed during today's session and is driving gold to trade around $1,750 per ounce. After the failure in the rebound attempt during the past week, there has been a downward crossover of its moving averages of 18 and 200 sessions, thus confirming the bearish break of this support level while the MACD continues to gather strength in negative territory despite the oversold that we can observe in the stochastic indicator.
In the coming sessions, we will have to be attentive to a possible pullback of the price and see if it is able to recover and maintain the lost support levels, since a failure in this attempt could open the doors to a further correction to its next level of support at the annual lows.
Evolution in the last 5 years:
- 2020: 21.86%
- 2019: 15.45%
- 2018: -3.22%
- 2017: 12.75%
- 2016: 10.12%
With the Admirals Trade.MT5 account, you can trade Gold Contracts for Differences (CFDs) and more than 3000 stocks! CFDs allow traders to try to profit from the bull and bear markets, as well as the use of leverage. Click on the following banner to open an account today:
INFORMATION ABOUT ANALYTICAL MATERIALS:
The given data provides additional information regarding all analysis, estimates, prognosis, forecasts, market reviews, weekly outlooks or other similar assessments or information (hereinafter “Analysis”) published on the websites of Admiral Markets investment firms operating under the Admiral Markets trademark (hereinafter “Admiral Markets”) Before making any investment decisions please pay close attention to the following:
- This is a marketing communication. The content is published for informative purposes only and is in no way to be construed as investment advice or recommendation. It has not been prepared in accordance with legal requirements designed to promote the independence of investment research, and that it is not subject to any prohibition on dealing ahead of the dissemination of investment research.
- Any investment decision is made by each client alone whereas Admiral Markets shall not be responsible for any loss or damage arising from any such decision, whether or not based on the content.
- With view to protecting the interests of our clients and the objectivity of the Analysis, Admiral Markets has established relevant internal procedures for prevention and management of conflicts of interest.
- The Analysis is prepared by an independent analyst, Roberto Rojas (analyst), (hereinafter “Author”) based on their personal estimations.
- Whilst every reasonable effort is taken to ensure that all sources of the content are reliable and that all information is presented, as much as possible, in an understandable, timely, precise and complete manner, Admiral Markets does not guarantee the accuracy or completeness of any information contained within the Analysis.
- Any kind of past or modeled performance of financial instruments indicated within the content should not be construed as an express or implied promise, guarantee or implication by Admiral Markets for any future performance. The value of the financial instrument may both increase and decrease and the preservation of the asset value is not guaranteed.
- Leveraged products (including contracts for difference) are speculative in nature and may result in losses or profit. Before you start trading, please ensure that you fully understand the risks involved.

