Powell rebuffs V-shaped recovery optimists – DAX30 to have a leg below 10,000 points?
Source: Economic Events Calendar May 19 – 22, 2020 - Admiral Markets' Forex Calendar
DAX30 CFD
The technical picture in the DAX remains unclear: the German index failed to recapture 11,000 points, but didn't take on significant bearish momentum either, keeping the German index in a range between 10,200 and 11,200 points.
While we could certainly argue that given the dark fundamental picture and the solid performance of the DAX30 price-action-wise could be interpreted as positive, we still don't consider the time right, especially from a risk-reward perspective in terms of DAX long-engagements.
While Fed chairman Powell told the US congress last week on Wednesday that the Fed will continue to use tools to their fullest until the current crisis has passed, he also noted that the recovery may take time to gather momentum or to put it differently: a V-shaped recovery in the US (but also globally) seems off the table.
And with expected earnings for the S&P 500 being 28% down from their peak and 13% below realized earnings which is way less than during previous recessions and can only be justified by a massive V-shaped recovery in earnings in 2021, US Equities, but also Equities in general and thus the German DAX, seem overvalued and a next sharper leg lower stays a serious option.
That said, we are still careful in terms of DAX30 CFD long engagements, even though short-term and technically we stay positive as long as the German index trades above 10,200 points:
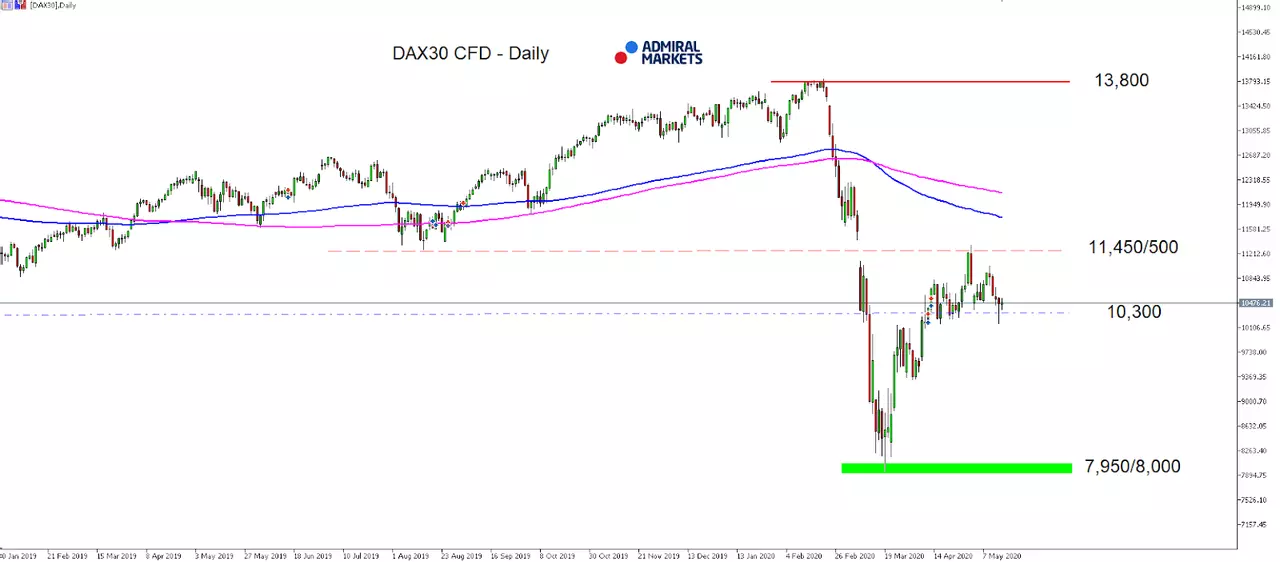
Source: Admiral Markets MT5 with MT5-SE Add-on DAX30 CFD Daily chart (between January 30, 2019, to May 15, 2020). Accessed: May 15, 2020, at 10:00pm GMT - Please note: Past performance is not a reliable indicator of future results, or future performance.
In 2015, the value of the DAX30 CFD increased by 9.56%, in 2016, it increased by 6.87%, in 2017, it increased by 12.51%, in 2018, it fell by 18.26%, in 2019, it increased by 26.44% meaning that after five years, it was up by 34.2%.
Check out Admiral Markets' most competitive conditions on the DAX30 CFD and start trading on the DAX30 CFD with a low 0.8 point spread offering during the main Xetra trading hours!
US Dollar
And again: when looking at the USD Index Future, the picture hasn't significantly changed over the last few days.
In fact, the USD Index Future kept on stabilising around 100.00 points and not seeing much of volatility after Fed chairman Jay Powell gave his assessment of the current US economic situation and the taken measures of the Fed to counter the economic downturn driven by the 'Corona lockdown'.
What's certainly of interest is that Powell respectively the Fed don't seem to have any plan in regards to negative rates, despite US president Trump tweets last week on Tuesday and the market has priced in negative fed funds in the futures market at the beginning of May for the first time ever with market participants obviously becoming more and more sceptical of the US economic outlook and seeing the necessity from the Fed to 'go negative' rather sooner than later.
That in mind leaves us sceptical for the US dollar and the only reason for the Greenback to present itself stable right now can clearly be found in the current Euro weakness.
And while we stay cautious in regards to US dollar long engagements, since we expect further monetary and fiscal stimulus from the US government and the Fed, we still see potential on the upside with a target around 105.00 points an option, with a potential driver, in addition to the current developments especially in the Euro, being found in Emerging markets with capital fleeing these markets and liquidity pouring back into the USD:
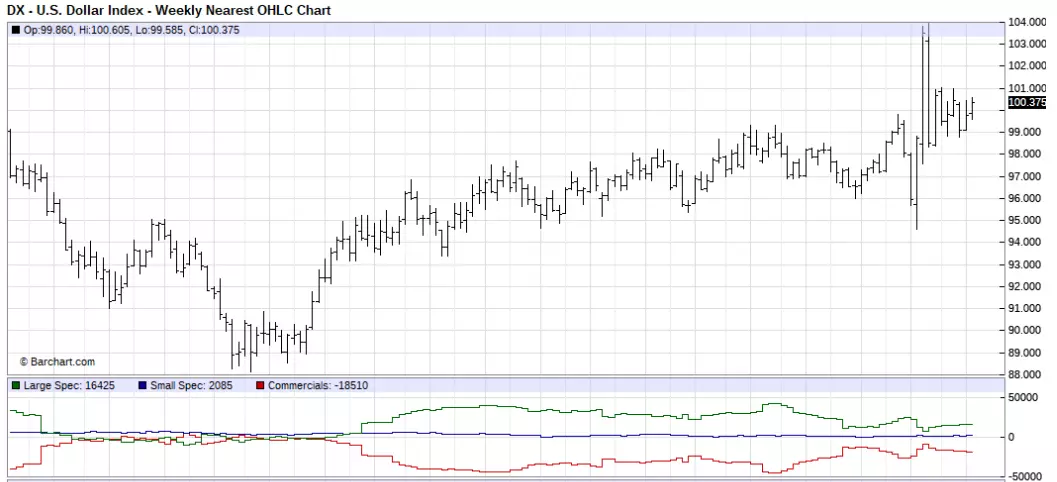
Source: Barchart - U.S Dollar Index - Weekly Nearest OHLC Chart (between July 2017 to May 2020). Accessed: May 15, 2020, at 10:00 PM GMT
Don't forget to register for the weekly "Trading Spotlight" webinar with presenters including Jens Klatt, every Monday, Wednesday and Friday at 2pm London time! It's your opportunity to follow Jens and others as they explore the weekly market outlook in detail, so don't miss out!
Euro
While the Euro presented itself stable (and choppy) against the US dollar over the last week of trading and the performance could be interpreted as quite strong after the German Constitutional Court ruling on May 5, we stay sceptical for the Euro.
A quick reminder: the German Constitutional Court ruled on May 5, that some ECB actions in regards to asset purchases respectively the QE are unconstitutional and thus not valid in Germany since the ECB decisions are not backed by the EU treaty.
While the European Central Bank was quick to react, arguing that it follows decisions taken by the European Court of Justice and not national courts, remaining fully committed to its inflation mandate, the GCC ruling sparked a legal minefield and has to some extent resulted in questions about the future of the eurozone, especially in regards to the expected economic downturn after the Corona lockdown and the so important PEPP program in this context which goes even a step further and buying also Greek bonds, not taking the rating of the issuing EU country into account.
That in mind and after the comments from German chancellor Merkel last Wednesday that the German government will respect the constitutional court's ruling on the ECB leaves the Euro vulnerable to upcoming uncertainty and leaves the current yearly lows around 1.0630 and making even a significant drop lower on the table, is probably a little under-priced into the currency in our opinion.
Technically, only recapturing 1.1000 would brighten the picture a little:
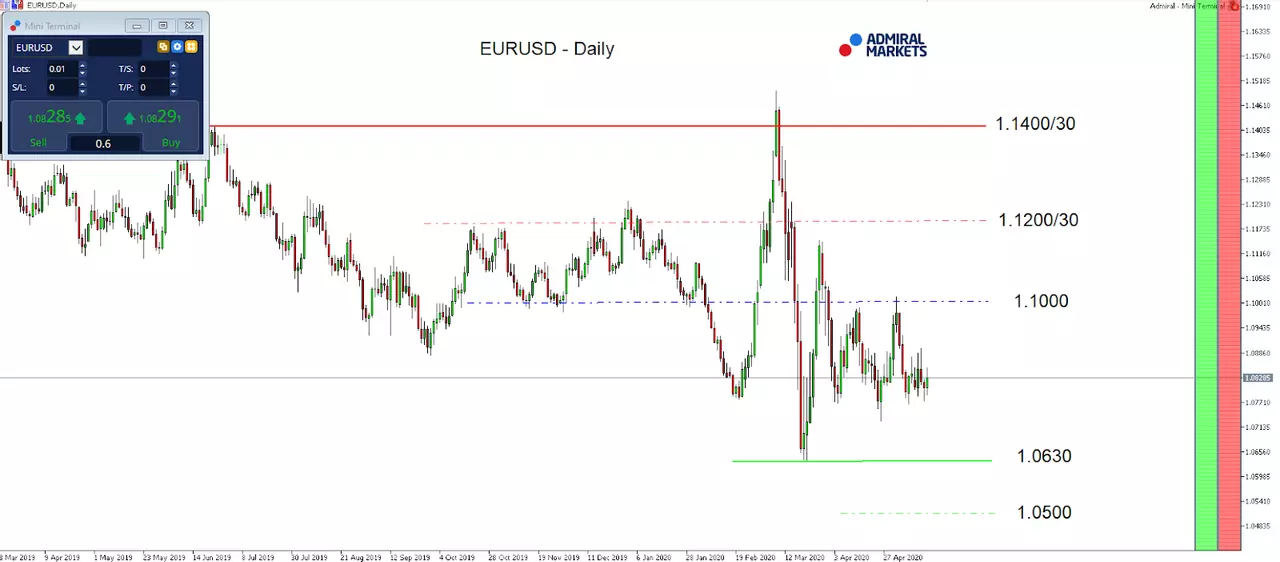
Source: Admiral Markets MT5 with MT5-SE Add-on EUR/USD Daily chart (between March 11, 2019, to May 15, 2020). Accessed: May 15, 2020, at 10:00pm GMT - Please note: Past performance is not a reliable indicator of future results, or future performance.
In 2015, the value of the EUR/USD fell by 10.2%, in 2016, it fell by 3.2%, in 2017, it increased by 13.92%, 2018, it fell by 4.4%, 2019, it fell by 2.2%, meaning that after five years, it was down by 7.3%.
JPY
While the USD/JPY started quite solid into the last week of trading, the currency pair gave back most of the gains with US yields showing that the bounce back above 0.70% wasn't sustainable.
While the overall picture for the USD/JPY hasn't thus changed, we stay with our overall bearish outlook on the USD/JPY currency pair.
That's especially true after the Fed chairman's appearance in front of the US congress.
While his remarks on his assessment of the current US economic situation and the taken measures of the Fed to counter the economic downturn driven by the 'Corona lockdown' didn't surprise, the comments on the Fed not having a plan in regards to negative rates, despite US president Trump tweets last week on Tuesday and the market has priced in negative fed funds in the futures market at the beginning of May for the first time ever, didn't trigger higher volatility either.
Still, we share the view and US economic scepticism in the near- to mid-term which corresponds with negative rates and also see the necessity from the Fed to 'go negative' rather sooner than later.
That in mind, a test of the region around 105.00 and even a push lower seems a realistic option in the coming days and weeks for the USD/JPY and as long as the currency pair does not recapture 109.00/50:
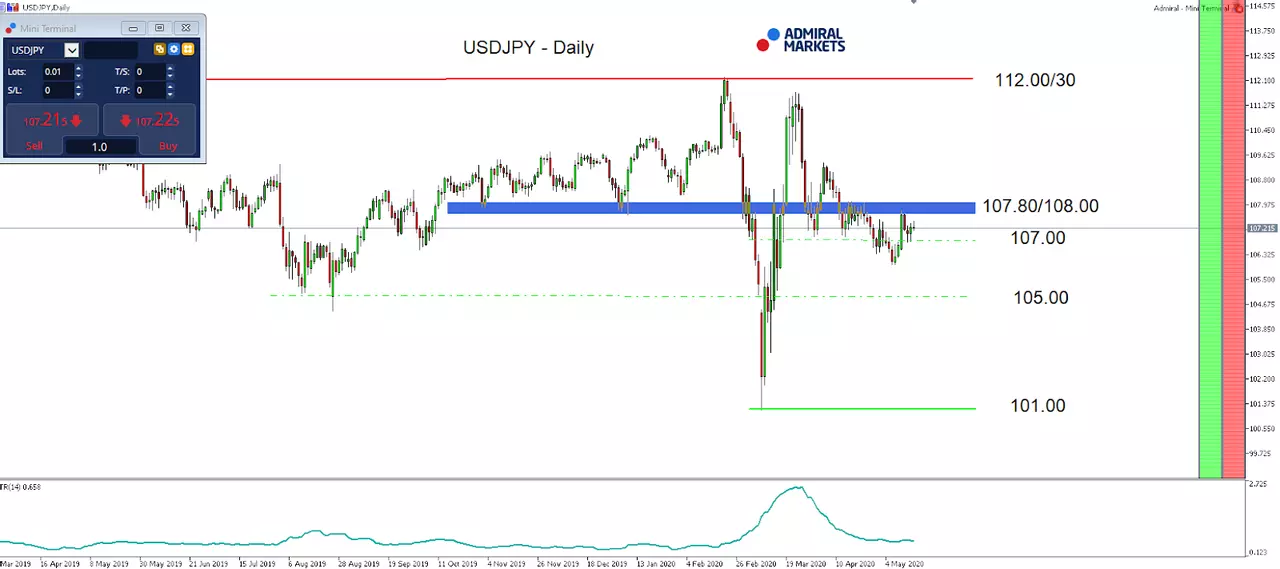
Source: Admiral Markets MT5 with MT5-SE Add-on USD/JPY Daily chart (between March 25, 2019, to May 15, 2020). Accessed: May 15, 2020, at 10:00pm GMT
In 2015, the value of the USD/JPY increased by 0.5%, in 2016, it fell by 2.8%, in 2017, it fell by 3.6%, in 2018, it fell by 2.7%, in 2019, it fell by 0.85%, meaning that after five years, it was down by 9.2%.
Gold
The picture in Gold hasn't changed over the last days, even though the yellow metal took 1,750 into its focus into the weekly close.
A potential driver higher was probably the testimony from Fed chairman Powell in front of the US congress last week on Wednesday.
While his remarks on his assessment of the current US economic situation and the taken measures of the Fed to counter the economic downturn driven by the 'Corona lockdown' didn't surprise, the comments on the Fed not having a plan in regards to negative rates, despite US president Trump tweets last week on Tuesday and the market has priced in negative fed funds in the futures market at the beginning of May for the first time ever, did not trigger a pullback, instead resulted in stronger demand into the second half of the week.
In fact, we share the view and US economic scepticism in the near- to mid-term which corresponds with negative rates and also see the necessity from the Fed to 'go negative' rather sooner than later.
That in mind, a sharp leg up stays on the table and brings the region around 1,750 USD back into focus in the days to come.
On the other hand, the bearish divergence in the RSI(14) on a daily time-frame (orange) is still a topic and would be confirmed with a break below 1,660 USD, making a deeper corrective move as low as 1,630/35 USD possible.
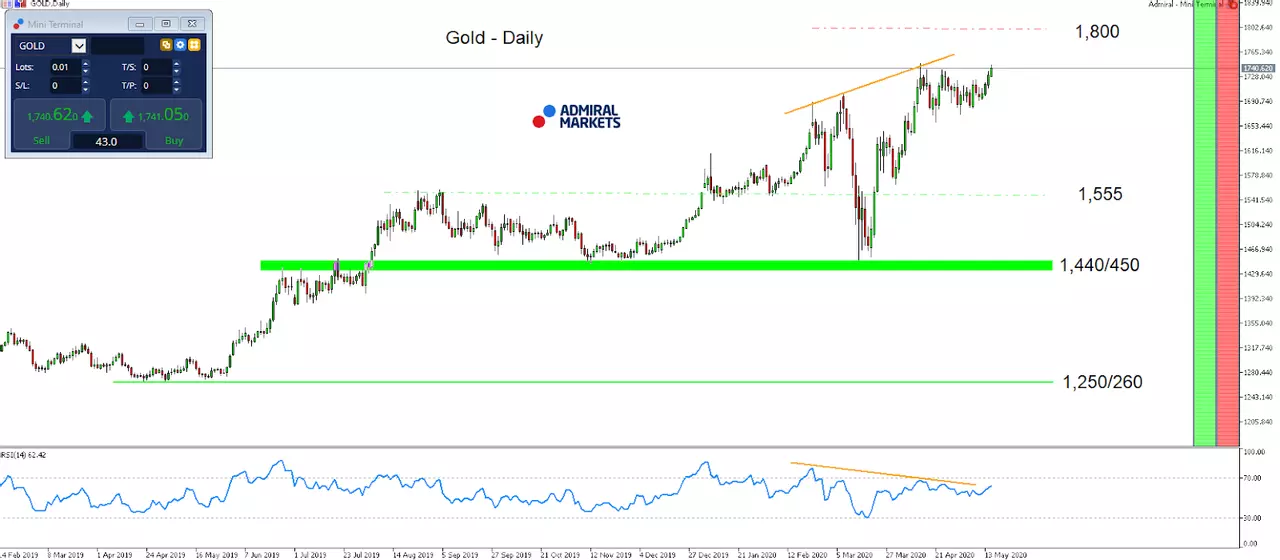
Source: Admiral Markets MT5 with MT5-SE Add-on Gold Daily chart (between February 14, 2019, to May 15, 2020). Accessed: May 15, 2020, at 10:00pm GMT - Please note: Past performance is not a reliable indicator of future results, or future performance.
In 2015, the value of Gold fell by 10.4%, in 2016, it increased by 8.1%, in 2017, it increased by 13.1%, in 2018, it fell by 1.6%, in 2019, it increased by 18.9%, meaning that after five years, it was up by 28%.
Discover the world's #1 multi-asset platform
Admiral Markets offers professional traders the ability to trade with a custom, upgraded version of MetaTrader 5, allowing you to experience trading at a significantly higher, more rewarding level. Experience benefits such as the addition of the Market Heat Map, so you can compare various currency pairs to see which ones might be lucrative investments, access real-time trading data, and so much more. Click the banner below to start your FREE download of MT5 Supreme Edition!

Disclaimer: The given data provides additional information regarding all analysis, estimates, prognosis, forecasts or other similar assessments or information (hereinafter "Analysis") published on the website of Admiral Markets. Before making any investment decisions please pay close attention to the following:
- This is a marketing communication. The analysis is published for informative purposes only and are in no way to be construed as investment advice or recommendation. It has not been prepared in accordance with legal requirements designed to promote the independence of investment research, and that it is not subject to any prohibition on dealing ahead of the dissemination of investment research.
- Any investment decision is made by each client alone whereas Admiral Markets shall not be responsible for any loss or damage arising from any such decision, whether or not based on the Analysis.
- Each of the Analysis is prepared by an independent analyst (Jens Klatt, Professional Trader and Analyst, hereinafter "Author") based on the Author's personal estimations.
- To ensure that the interests of the clients would be protected and objectivity of the Analysis would not be damaged Admiral Markets has established relevant internal procedures for prevention and management of conflicts of interest.
- Whilst every reasonable effort is taken to ensure that all sources of the Analysis are reliable and that all information is presented, as much as possible, in an understandable, timely, precise and complete manner, Admiral Markets does not guarantee the accuracy or completeness of any information contained within the Analysis. The presented figures refer that refer to any past performance is not a reliable indicator of future results.
- The contents of the Analysis should not be construed as an express or implied promise, guarantee or implication by Admiral Markets that the client shall profit from the strategies therein or that losses in connection therewith may or shall be limited.
- Any kind of previous or modeled performance of financial instruments indicated within the Publication should not be construed as an express or implied promise, guarantee or implication by Admiral Markets for any future performance. The value of the financial instrument may both increase and decrease and the preservation of the asset value is not guaranteed.
- The projections included in the Analysis may be subject to additional fees, taxes or other charges, depending on the subject of the Publication. The price list applicable to the services provided by Admiral Markets is publicly available from the website of Admiral Markets.
- Leveraged products (including contracts for difference) are speculative in nature and may result in losses or profit. Before you start trading, you should make sure that you understand all the risks.