Despite positive German GDP data, future expectations continue to deteriorate
While we are still waiting for the Jackson Hole symposium to begin today and for the different presentations to begin, as we mentioned in our analysis last Monday in relation to the weekly outlook, this week has been loaded with macro data from Germany, which have not been entirely positive. Let’s see below a summary of this data:
- During Monday’s session, we saw how the preliminary data of the PMI of the services and manufacturing sector for Germany had settled at 61.5 and 62.7 points respectively, while the market consensus predicted that these would reach 61.0 and 65.0 points, so we could already observe mixed results that showed a beginning of slowdown in the economy.
- On Tuesday, we learned the data corresponding to the German quarterly GDP. This figure was better than expected by the consensus of analysts after during the second quarter the German economy grew at a rate of 1.6%,leaving year-on-year GDP growth at two tenths above what was expected by the market consensus reaching 9.8%.
- On Wednesday, we learned about the data business expectations of Germany, the IFO index of business confidence in Germany and the current situation index in Germany. Of these 3 data, only the current situation data of Germany was positive after exceeding market expectations by reaching 101.4 points compared to the expected 100.8 points, so we can see that although now the situation is not bad, if we talk about the expectations for the future these are not so good. Specifically, both data were not only those expected by the market consensus, but were also worse than the previous month’s data for the second consecutive month.
- On the other hand, today Thursday we have known the GfK index of consumer climate for Germany for the month of September and this data has also been not only worse than the data of the previous month, but it has also been worse than expected by the market consensus after settling at -1.2 points compared to the -0.7 expected. It should be noted that this index measures the confidence of German consumers in economic activity in which it is attempted to predict the increase in consumer spending. This is also the second consecutive month in which this figure is negative.
Therefore, and taking into account all this data, we can appreciate once again that future sentiment is not entirely positive despite the economic recovery evidenced by the GDP of the second quarter and that both investors and consumers expect problems in the future. This could be explained by the problems that the Delta variant is generating and the problems that it is generating in the vaccines as we mentioned in our analysis yesterday and in the possible changes that the Central Banks may introduce, ending monetary stimuli and possible interest rate increases.
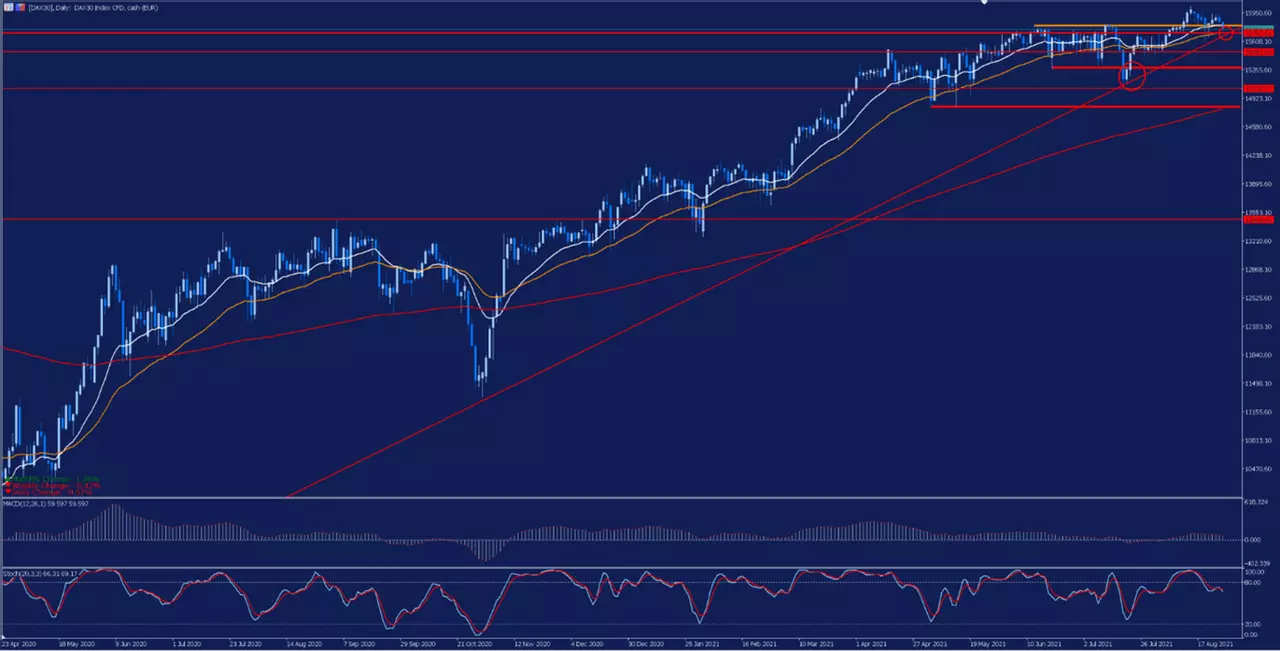
Technically speaking, if we look at the daily chart of the German DAX30, we can see that it is following a strong upward trend that has practically led it to mark historical highs after historical highs, although if we focus on the last weeks we can see some symptoms of exhaustion due to the accumulated over-bedding that we could observe in the stochastic indicator with a practically flat MACD indicator, although at the moment this has several and important support points being the last of them the coincident zone of its lows of last March and its average of 200 sessions represented by the lower red stripe.
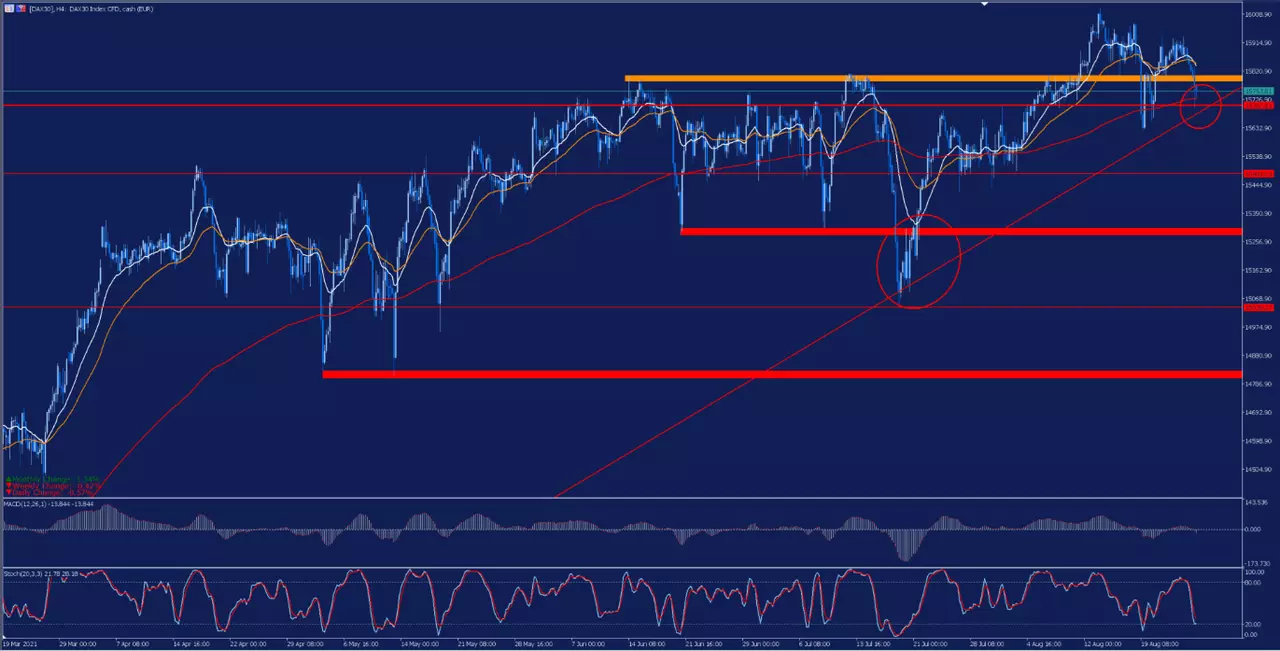
If we focus on the H4 chart, we can see that the price is currently at a significant support point in the coincident zone of its moving average of 200 in H4 (red), the resistance support level represented by the orange stripe and its long-term uptrend line as we can see in the upper red circle.
The loss of this important support level could trigger a further correction that should first face the level of 15,480 points. The loss of this level would open the door to further correction to the next important support level represented by the upper red stripe.
It is important that we follow the evolution of the price and the news not only from the Jackson Hole symposium, but also from the macroeconomic news that we will know in the coming weeks.
At the moment, although the data are not being entirely positive in relation to future expectations, we can not firmly affirm that the change in trend will occur imminently so if we maintain these support levels we can not rule out seeing new historical highs.
Evolution in the last 5 years:
- 2020: 3.6%
- 2019: 25.48%
- 2018: -18.26%
- 2017: 12.51%
- 2016: 6.87%
With the Admirals Trade.MT5 account, you can trade Contracts for Differences (CFDs) on the DAX30 and more than 3000 stocks! CFDs allow traders to try to profit from the bull and bear markets, as well as the use of leverage. Click on the following banner to open an account today:

INFORMATION ABOUT ANALYTICAL MATERIALS:
The given data provides additional information regarding all analysis, estimates, prognosis, forecasts, market reviews, weekly outlooks or other similar assessments or information (hereinafter “Analysis”) published on the websites of Admiral Markets investment firms operating under the Admiral Markets trademark (hereinafter “Admiral Markets”) Before making any investment decisions please pay close attention to the following:
- This is a marketing communication. The content is published for informative purposes only and is in no way to be construed as investment advice or recommendation. It has not been prepared in accordance with legal requirements designed to promote the independence of investment research, and that it is not subject to any prohibition on dealing ahead of the dissemination of investment research.
- Any investment decision is made by each client alone whereas Admiral Markets shall not be responsible for any loss or damage arising from any such decision, whether or not based on the content.
- With view to protecting the interests of our clients and the objectivity of the Analysis, Admiral Markets has established relevant internal procedures for prevention and management of conflicts of interest.
- The Analysis is prepared by an independent analyst, Roberto Rojas (analyst), (hereinafter “Author”) based on their personal estimations.
- Whilst every reasonable effort is taken to ensure that all sources of the content are reliable and that all information is presented, as much as possible, in an understandable, timely, precise and complete manner, Admiral Markets does not guarantee the accuracy or completeness of any information contained within the Analysis.
- Any kind of past or modeled performance of financial instruments indicated within the content should not be construed as an express or implied promise, guarantee or implication by Admiral Markets for any future performance. The value of the financial instrument may both increase and decrease and the preservation of the asset value is not guaranteed.
- Leveraged products (including contracts for difference) are speculative in nature and may result in losses or profit. Before you start trading, please ensure that you fully understand the risks involved.

