Coronavirus hits the DAX, breaking 12,000. Is 10,000 the next target?
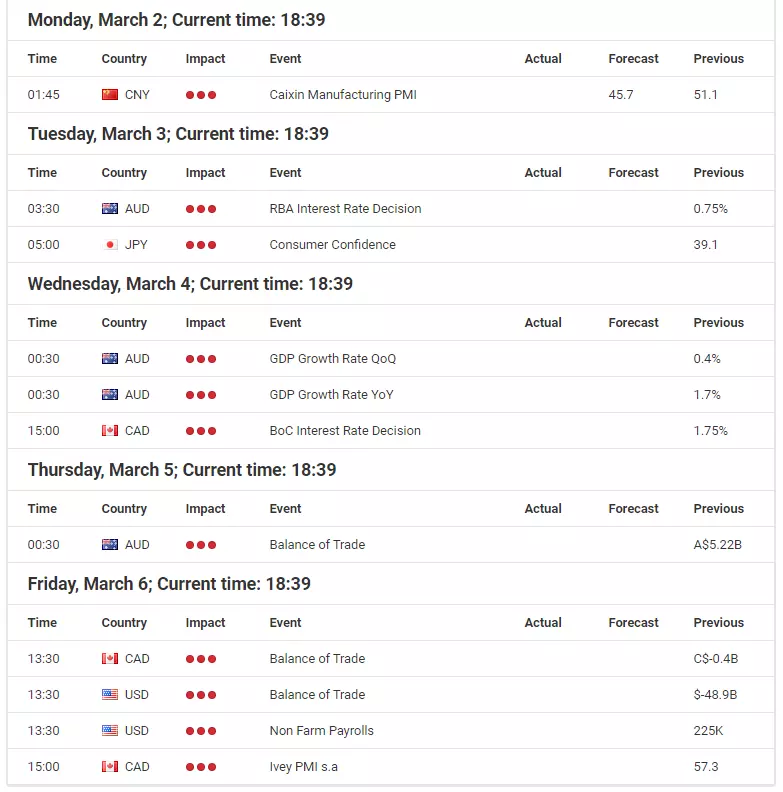
Source: Economic Events Calendar March 2 – 6, 2020 - Admiral Markets' Forex Calendar
DAX30 CFD
The tide has dramatically turned in Equities over the last trading week, as a massive risk-off hit the global financial markets due to new Coronavirus developments and clear signs of a widespread health crisis. 10-year US yields hit new all-time lows, and the DAX30 CFD broke below 12,000 points, technically negating the long sequence on a daily time-frame, and sustainably breaking below 12,900 points.
In general, we should expect volatility to stay elevated with the overall advantage being on the short-side in the days to come, since the worst is probably yet come after the US CDC said that it wants to prepare the American public for the possibility that their lives will be disrupted in the US with the Coronavirus spreading.
That said, it comes as no big surprise that governments around the globe are willing to fight the virus' spread, and dampen the negative effect that the Coronavirus may have on the global economic outlook.
But a monetary stimulus by itself, even if it comes with a surprising "emergency rate cut" from the Fed before its next meeting March 18, will unlikely be able to get "the job done," since central banks around the globe are already pumping massive amounts of money into economies since the Financial Crisis of around 10 years ago.
In addition to this, politicians need to act quickly and consider bigger government spending to fight not just the Coronavirus, but also a potential global economic downturn.
The longer such steps in the direction of government spending take, the more likely the break below the SMA(200) on a daily time-frame in the DAX30 CFD will prove sustainable, and we'll likely see further losses with a quick drop down to the region around 11,250 points as a target.
A sharp bounce, on the other hand, may also be short-lived, as the German index may find a strong zone of resistance and potential short-trigger around 12,900 points:
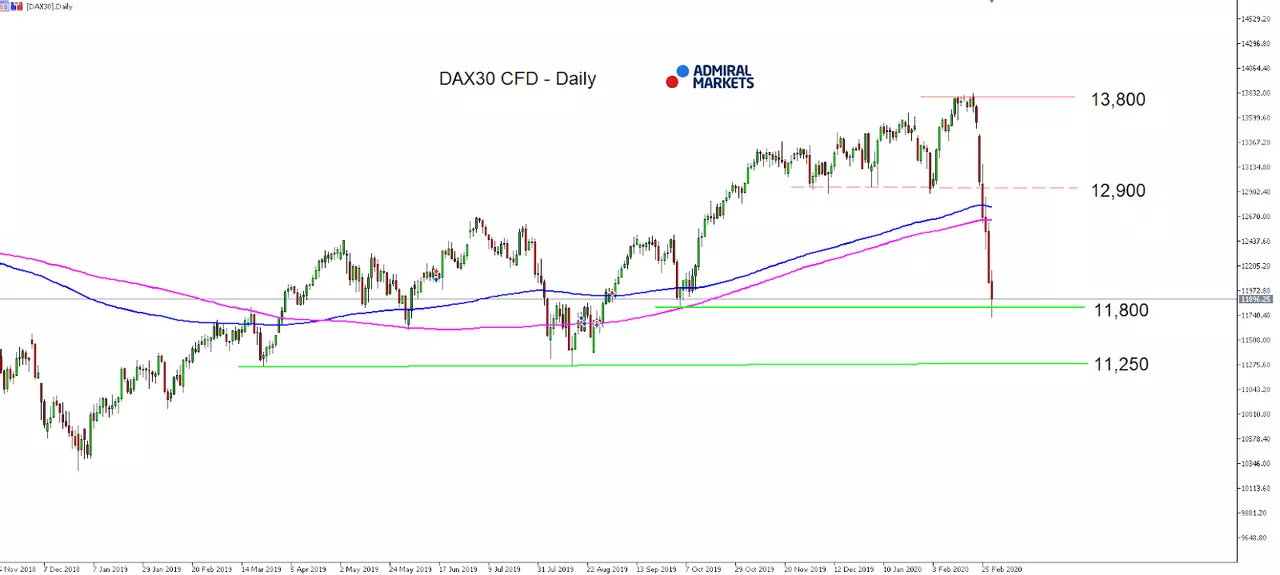
Source: Admiral Markets MT5 with MT5-SE Add-on DAX30 CFD Daily chart (between November 15, 2018, to February 28, 2020). Accessed: February 28, 2020, at 10:00pm GMT - Please note: Past performance is not a reliable indicator of future results, or future performance.
In 2015, the value of the DAX30 CFD increased by 9.56%, in 2016, it increased by 6.87%, in 2017, it increased by 12.51%, in 2018, it fell by 18.26%, in 2019, it increased by 26.44% meaning that after five years, it was up by 34.2%.
Check out Admiral Markets' most competitive conditions on the DAX30 CFD and Dow Jones CFDs and start trading on the DAX30 CFD with a low 0.8 point spread offering during the main Xetra trading hours!
US Dollar
Recent developments around the Coronavirus, which pushed markets in a risk-off mode, didn't leave the US dollar unscathed.
10-year US-Treasury yields dropped to new all-time lows, placing the Greenback under pressure, particularly against the Japanese Yen, but also the Euro and Pound Sterling.
We largely remain sceptical in regards to the US dollar: the recent break upwards in the USD Index Future to its highest levels since May 2017 was in our opinion more Euro respectively JPY weakness than USD strength.
While technically, the mode in the USD Index Future stays bullish as long as we trade above 96.00 points, with market participants now expecting the Fed to cut rates four(!!!) times or by 100 basis points in 2020 with a likelihood of over 60% (according to the Fed Watch Tool), the USD does not find a solid fundamental driver higher and should be eyed cautiously.
This is especially true with the US CDC having said that it wants to prepare the American public for the possibility that their lives will be disrupted in the US with the Coronavirus spreading, meaning that the worst in regards to the Coronavirus is yet to come and increasing chances of a surprising "emergency rate cut" from the Fed at their next meeting at the 18th of March, resulting in further USD weakness:
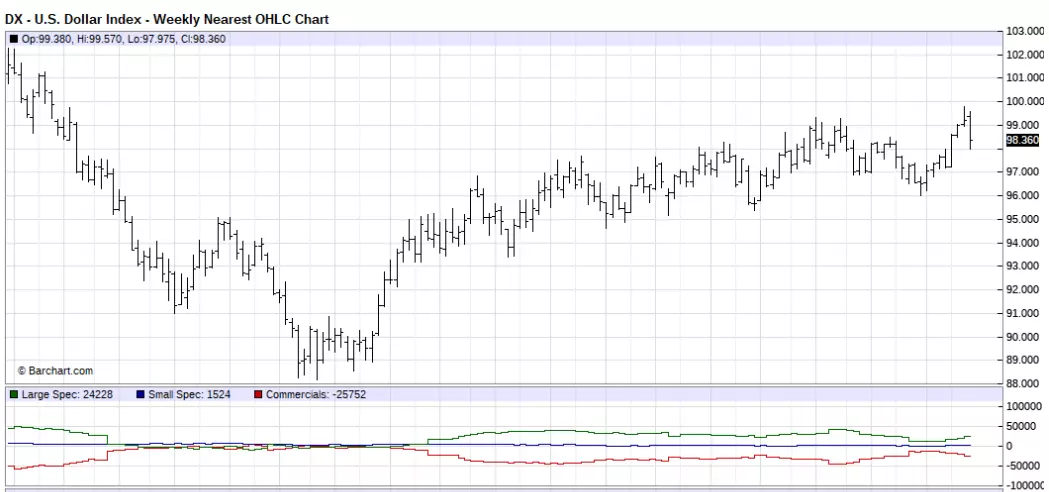
Source: Barchart - U.S Dollar Index - Weekly Nearest OHLC Chart (between January 2017 to February 2020). Accessed: 28 February 2020 at 10:00 PM GMT
Don't forget to register for the weekly "Trading Spotlight" webinar with presenters including Jens Klatt, every Monday, Wednesday and Friday at 2pm London time! It's your opportunity to follow Jens and others as they explore the weekly market outlook in detail, so don't miss out!
Euro
All in all the overall picture in the Euro hasn't significantly changed over the last week, despite the recent developments around the Coronavirus, even though we saw a test of the region around 1.1000.
Still, we should put a special look at what happened and how it could affect the Euro if the Coronavirus pandemic spreads over the European continent: in regards to Italy and the affected Northern part of the country which can be considered kind of the "primary engine of Italian economic growth" e.g., Italian GDP is expected to take a serious hit with economists having expected full-year growth of just 0.2% already before the coronavirus hit.
With that in mind and the interruptions in the supply chain from China, fears of the EU entering a recession rather sooner than later, certainly don't bode well for the Euro from a fundamental perspective.
In fact, news is starting to make rounds that governments around the globe are willing to fight a pandemic and dampen the negative effect the Coronavirus may have on the global economic outlook and thus also the European Union.
If the EU now bring fiscal stimulus on the table and run bigger government spending to fight not only the Coronavirus pandemic, but also the potential European economic downturn, the Euro could see a sharper run higher with an expected weaker US dollar as a further driver (for details please refer to the paragraph above).
In addition to that and given the sharp comments from US president Trump in terms of trade towards Europe in Davos with us currently not expecting Trump to take action and impose tariffs on European automobiles (hitting especially German very hard), traders should carefully watch all remarks and comments towards the US administration bringing actions into play with the target to weaken the US-Dollar and thus driving EURUSD higher.
Still, technically, the mode in EURUSD stays clearly short, a break below 1.0750/80 activates 1.0580/0600 as a next target, while the currency pair finds a potential short-trigger around 1.1000:
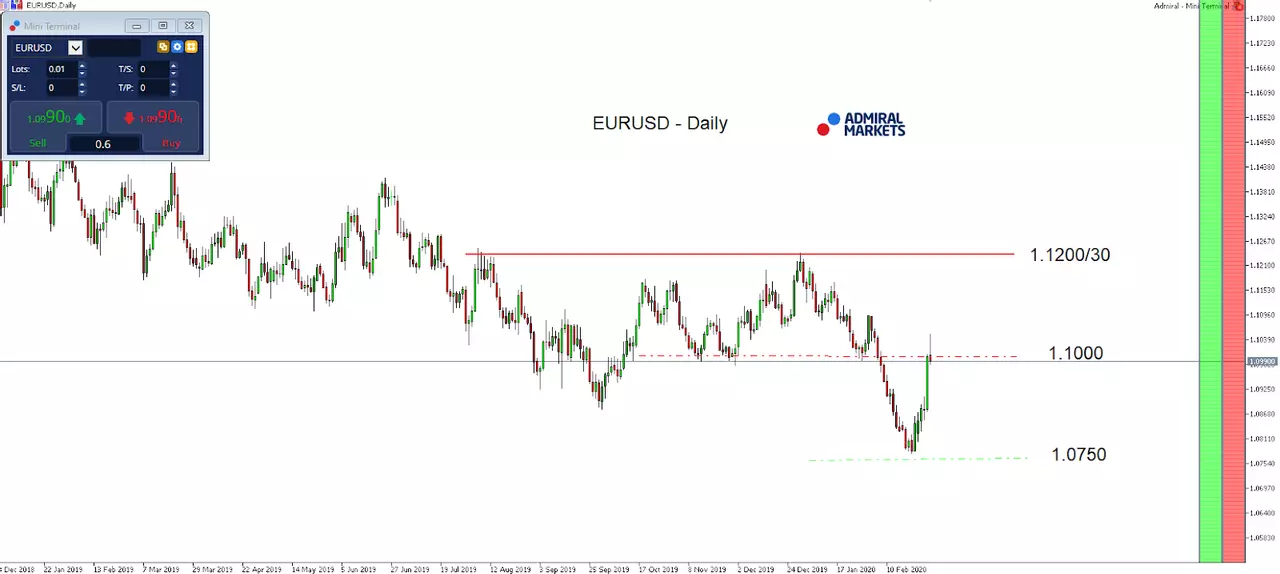
Source: Admiral Markets MT5 with MT5-SE Add-on EUR/USD Daily chart (between December 28, 2018, to February 28, 2020). Accessed: February 28, 2020, at 10:00pm GMT - Please note: Past performance is not a reliable indicator of future results, or future performance.
In 2015, the value of the EUR/USD fell by 10.2%, in 2016, it fell by 3.2%, in 2017, it increased by 13.92%, 2018, it fell by 4.4%, 2019, it fell by 2.2%, meaning that after five years, it was down by 7.3%.
JPY
After USDJPY went for a test of the region around its 2019 yearly highs around 112.00/30, the currency saw a sharper drop which was mainly Coronavirus-risk-off driven.
While we stay sceptical in regards to the outlook for the Japanese currency in general after economic data from Japan massively disappointed, showing that Japan's GDP shrank an annualized 6.3% in 4th quarter of 2019, pointing to the sharpest contraction since the second quarter of 2014 and second-biggest drop since the Great Financial Crisis, at least short-term the JPY could see some bids from FX traders in the near-term.
Reason: we expect volatility to stay elevated since the worst is probably yet come in regards to the Coronavirus after the US CDC said that it wants to prepare the American public for the possibility that their lives will be disrupted in the US with the Coronavirus spreading.
If developments here "force" the Fed to go with an "emergency rate cut" at their next meeting at the 18th of March, US yields could see another push lower, driving USDJPY sustainably back below 110.00 and even open the door for an attack at the region around 107.80/108.00.
If, on the other hand, the USD/JPY can stabilise, risk aversion diminishes and volatility drops also, a (short-term) stabilisation in US yields (probably driven by solid economic projections in the days to come), could result in a back above 110.00.
Technically the mode stays bullish as long as we trade above 107.80/108.00:
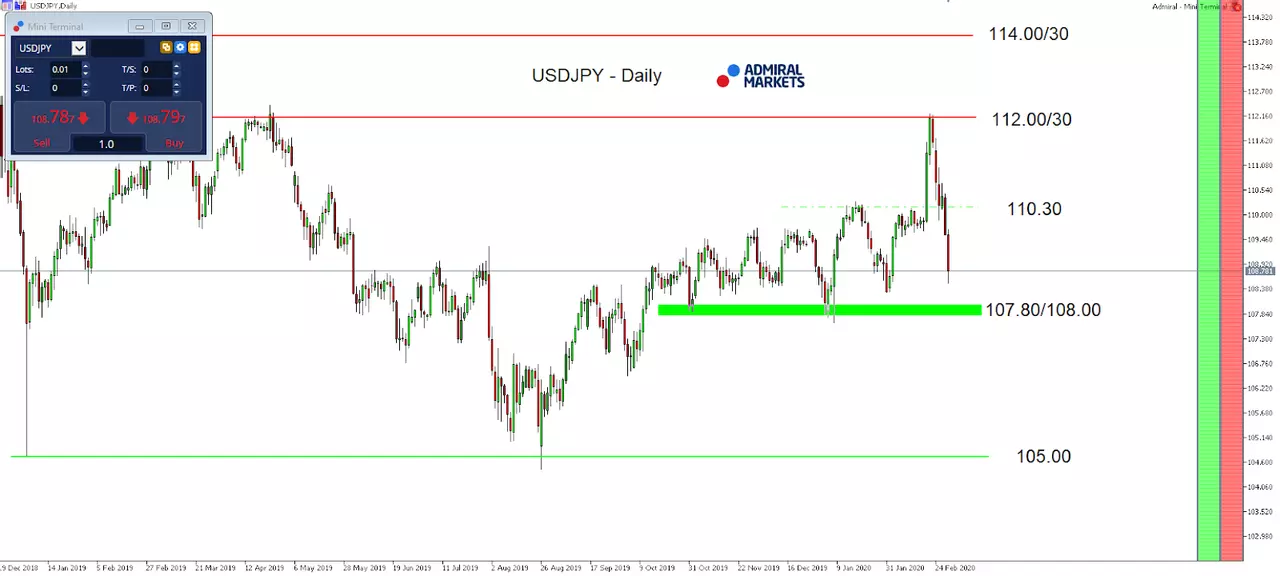
Source: Admiral Markets MT5 with MT5-SE Add-on USD/JPY Daily chart (between December 19, 2018, to February 28, 2020). Accessed: February 28, 2020, at 10:00pm GMT
In 2015, the value of USD/JPY increased by 0.5%, in 2016, it fell by 2.8%, in 2017, it fell by 3.6%, in 2018, it fell by 2.7%, in 2019, it fell by 0.85%, meaning that after five years, it was down by 9.2%.
Gold
Gold surprised a little over the last week of trading. Developments around the Coronavirus pushed global financial markets in a risk-off mode, pushed volatility in Equities to its highest levels since December 2018, while 10-year US-Treasury yields dropped to new all-time lows.
In such a market environment you usually expect Gold to perform extraordinarily well, but only last Monday the precious metal presented itself bullish with eyeing 1,700 USD on the upside.
After that, the yellow metal saw a drop, went for a re-test of the region around 1,600/620 USD and dipped even below 1,600 USD, seeing a very weak weekly close.
While one could certainly argue that technically the mode was very extended on the upside and a correction seemed imminent, in combination with the risk-off market environment, the performance of Gold has certainly some flaws, some market participants argue that Gold was dumped to meet margin calls for Equity positions.
However, we stay positive for Gold: we expect volatility to stay elevated since the worst is probably yet come in regards to the Coronavirus after the US CDC said that it wants to prepare the American public for the possibility that their lives will be disrupted in the US with the Coronavirus spreading.
If developments here "force" the FED to go with an "emergency rate cut" at their next meeting on the 18th of March, US yields could see another push lower, driving Gold higher and leaving room for a significant break above 1,700 USD.
On the downside, we consider the region around 1,600/620 USD still a potential long-trigger, with the daily trend support to be found around 1,535/545 USD and Gold staying bullish on a daily time-frame above that level.
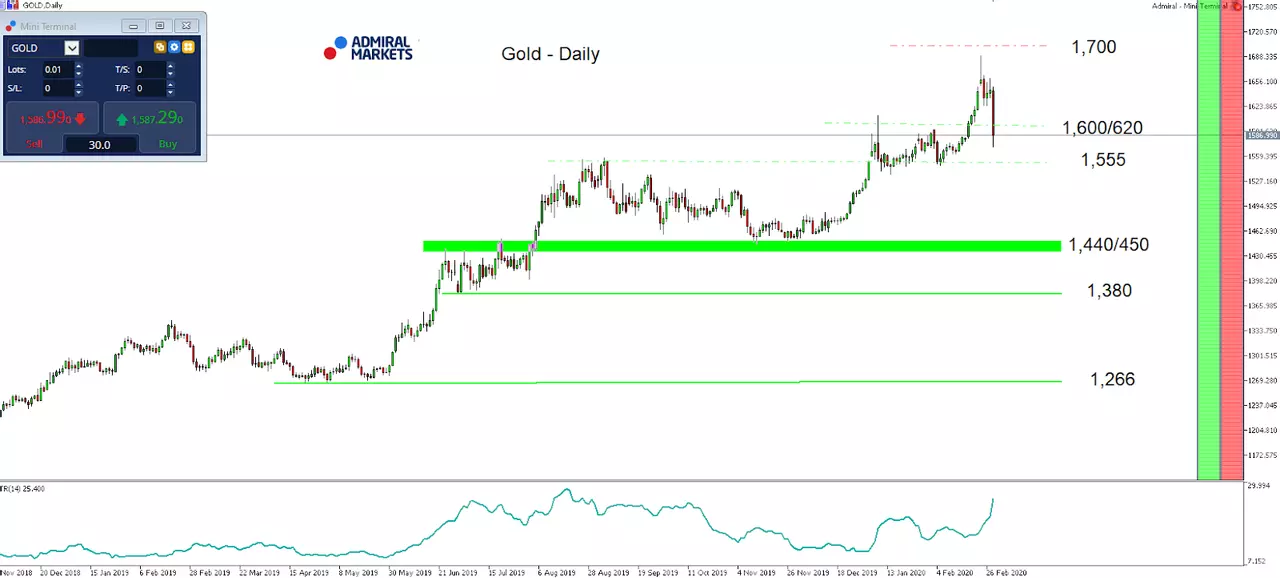
Source: Admiral Markets MT5 with MT5-SE Add-on Gold Daily chart (between 23 November 2018 to 28 February 2020). Accessed: 28 February 2020 at 10:00 PM GMT - Please note: Past performance is not a reliable indicator of future results, or future performance.
In 2015, the value of Gold fell by 10.4%, in 2016, it increased by 8.1%, in 2017, it increased by 13.1%, in 2018, it fell by 1.6%, in 2019, it increased by 18.9%, meaning that after five years, it was up by 28%.
Discover the world's #1 multi-asset platform
Admiral Markets offers professional traders the ability to trade with a custom, upgraded version of MetaTrader 5, allowing you to experience trading at a significantly higher, more rewarding level. Experience benefits such as the addition of the Market Heat Map, so you can compare various currency pairs to see which ones might be lucrative investments, access real-time trading data, and so much more. Click the banner below to start your FREE download of MT5 Supreme Edition!

Disclaimer: The given data provides additional information regarding all analysis, estimates, prognosis, forecasts or other similar assessments or information (hereinafter "Analysis") published on the website of Admiral Markets. Before making any investment decisions please pay close attention to the following:
- This is a marketing communication. The analysis is published for informative purposes only and are in no way to be construed as investment advice or recommendation. It has not been prepared in accordance with legal requirements designed to promote the independence of investment research, and that it is not subject to any prohibition on dealing ahead of the dissemination of investment research.
- Any investment decision is made by each client alone whereas Admiral Markets shall not be responsible for any loss or damage arising from any such decision, whether or not based on the Analysis.
- Each of the Analysis is prepared by an independent analyst (Jens Klatt, Professional Trader and Analyst, hereinafter "Author") based on the Author's personal estimations.
- To ensure that the interests of the clients would be protected and objectivity of the Analysis would not be damaged Admiral Markets has established relevant internal procedures for prevention and management of conflicts of interest.
- Whilst every reasonable effort is taken to ensure that all sources of the Analysis are reliable and that all information is presented, as much as possible, in an understandable, timely, precise and complete manner, Admiral Markets does not guarantee the accuracy or completeness of any information contained within the Analysis. The presented figures refer that refer to any past performance is not a reliable indicator of future results.
- The contents of the Analysis should not be construed as an express or implied promise, guarantee or implication by Admiral Markets that the client shall profit from the strategies therein or that losses in connection therewith may or shall be limited.
- Any kind of previous or modeled performance of financial instruments indicated within the Publication should not be construed as an express or implied promise, guarantee or implication by Admiral Markets for any future performance. The value of the financial instrument may both increase and decrease and the preservation of the asset value is not guaranteed.
- The projections included in the Analysis may be subject to additional fees, taxes or other charges, depending on the subject of the Publication. The price list applicable to the services provided by Admiral Markets is publicly available from the website of Admiral Markets.
- Leveraged products (including contracts for difference) are speculative in nature and may result in losses or profit. Before you start trading, you should make sure that you understand all the risks.