The Chinese economy continues to show strength in its exports
Last April, we commented that since the coronavirus pandemic began last year, China seems to be facing this situation better than most, despite the fact that it began in the city of Wuhan.
In the past, we observed how production in Chinese factories not only increased, but also that prices exceeded market expectations by rising at a year-on-year rate higher than that registered in 2018.
During today's session, we have been able to verify that trade between China and the rest of the world has risen by 27.1% during the first half of 2021, which, once again, shows the solid position that the Asian giant has with respect to the world after this pandemic, since Beijing has obtained a trade surplus of $252.7 billion dollars thanks to the strong increase in exports.
The rift between China and the United States remains in the markets despite the departure of Donald Trump, since both powers control trade at the international level, which has caused a shift in the geopolitics of the traditional American-European axis to the Asia-Pacific axis.
Despite the fact that the Chinese economy is one of the great beneficiaries of this crisis, and that it has experienced strong stock market growth last year, during the first half of this year, the Hang Seng index only rose by 5.86%, compared to 14.41% of the SP500, 12.5% of the Nasdaq or 12.73% of the Dow Jones.
Technically speaking, if we look at the daily chart, the fall from highs coincides with the fulfilment of the negative divergence that we can observe on the daily chart between the price and its MACD and Stochastic oscillators, which has led the price to lose momentarily. its 200-session moving average and the lower band of the lateral channel in red.
At this moment, the price is making a pullback to its average of 200 sessions, so we must be vigilant in the next sessions and see if it is capable of recovering this level, since if the break to the downside and the loss is confirmed of the lateral channel, we could find a strong downward movement to its next support level around 25,960 points.
As long as the price fails to rise above the medium-term downtrend line that began at its annual highs, the feeling will continue to be negative.
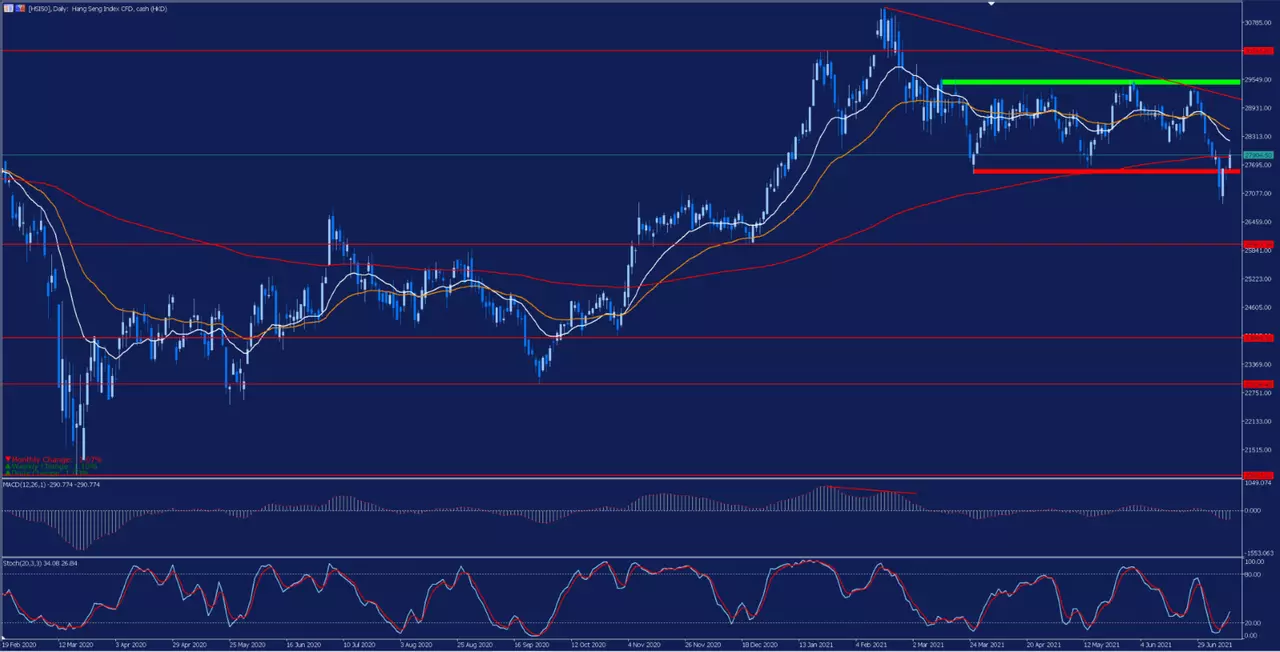
Source: Admiral Markets MetaTrader 5. HSI50 daily chart. Data range: February 19, 2020 to July 13, 2021. Prepared on July 13, 2021 at 12:30 p.m. CEST. Note: past returns do not guarantee future returns.
Price evolution of the last five years:
- 2020: -3,40%
- 2019: 9,07%
- 2018: -13,61%
- 2017: 35,99%
- 2016: 0,39%
With the Admirals Trade.MT5 account, you can trade Contracts for Differences (CFDs) of Microsoft and more than 3000 stocks! CFDs allow traders to try to profit from the bull and bear markets, as well as the use of leverage. Click on the following banner to open an account today:
INFORMATION ABOUT ANALYTICAL MATERIALS:
The given data provides additional information regarding all analysis, estimates, prognosis, forecasts, market reviews, weekly outlooks or other similar assessments or information (hereinafter “Analysis”) published on the websites of Admiral Markets investment firms operating under the Admiral Markets trademark (hereinafter “Admiral Markets”) Before making any investment decisions please pay close attention to the following:
- This is a marketing communication. The content is published for informative purposes only and is in no way to be construed as investment advice or recommendation. It has not been prepared in accordance with legal requirements designed to promote the independence of investment research, and that it is not subject to any prohibition on dealing ahead of the dissemination of investment research.
- Any investment decision is made by each client alone whereas Admiral Markets shall not be responsible for any loss or damage arising from any such decision, whether or not based on the content.
- With view to protecting the interests of our clients and the objectivity of the Analysis, Admiral Markets has established relevant internal procedures for prevention and management of conflicts of interest.
- The Analysis is prepared by an independent analyst, Roberto Rojas (analyst), (hereinafter “Author”) based on their personal estimations.
- Whilst every reasonable effort is taken to ensure that all sources of the content are reliable and that all information is presented, as much as possible, in an understandable, timely, precise and complete manner, Admiral Markets does not guarantee the accuracy or completeness of any information contained within the Analysis.
- Any kind of past or modeled performance of financial instruments indicated within the content should not be construed as an express or implied promise, guarantee or implication by Admiral Markets for any future performance. The value of the financial instrument may both increase and decrease and the preservation of the asset value is not guaranteed.
- Leveraged products (including contracts for difference) are speculative in nature and may result in losses or profit. Before you start trading, please ensure that you fully understand the risks involved.

