Investing in the EuroStoxx Index: Your guide for 2026
Did you know that there is a stock index in which the largest companies in the Eurozone are listed? We’re talking about the EuroStoxx index (EuroStoxx 50), an index that serves as a thermometer of European economic health, widely used as an underlying asset in trading to operate through derivative products, such as Contracts for Difference (CFDs).
Table of Contents
EuroStoxx 50: An Introduction
What is the EuroStoxx 50 (EuStx50)? Is Euro Stoxx 50 a good investment? First, let's answer what this index is. The EuroStoxx 50 is the European benchmark stock index that groups together the 50 largest companies in the Eurozone that are listed in euros.
These are considered 'blue chips', belonging to 19 different sectors, with banking being the one that has the most weight in its weighting. Several countries are represented in this index, with France, Germany, Italy and Spain leading the way. Its ticker is SX5E.
The European index is based on December 31, 1991, with 1,000 points, although it was created in 1998. It was jointly promoted by Dow Jones & Company, Deutsche Börse and Swiss Exchange, a joint venture under the Stoxx brand Limited. This brand is behind other indices such as the Stoxx Europe 50 or the Stoxx Europe 600.
The EuroStoxx 50 is weighted by market capitalization adjusted to the free float, that is, the most valuable and most liquid companies have more weight in the calculation of the index. However, there is a limitation: no company can have more than 10% weight in the index to avoid distortions. Its composition is reviewed once a year.
This index is widely used as an underlying for a wide range of investment products, such as ETFs (Exchange-Traded Funds), futures, options or derivative products such as CFDs (Contracts for Difference), throughout the world. Additionally, it is usually a reference asset for investment fund managers who often replicate the composition of the index in their portfolio.
Currently, the European index has a total capitalization of 2.41 billion euros as recorded on the official website Stoxx.com on March 4, 2020.
Interested in practicing your trading skills under real and live market conditions with virtual currency? Register for a free demo account and hone your strategies and abilities without putting your real funds at risk! Click the banner below to register:

EuroStoxx 30
It's worth mentioning that there is also a EuroStoxx index 30 (The EURO STOXX Select Dividend 30 Index), which offers investors a tool to follow 30 Eurozone stocks that offer a high dividend yield. This selection is determined by their historic yield of dividends. Its weighting is completed by the estimated dividend yield.
The basis of the EuroStoxx 30 is a part of the STOXX Global Select Dividend 100 index, which is an index composed of the stocks that offer the highest dividend yield worldwide.
These indexes are interesting for many traders, including those focused on dividends-yielding stocks. However, in this article, I'm going to focus solely on the Euro Stoxx 50 index.
EuroStoxx: Historic Changes
A few years ago, the financial sector, like the IBEX35, had a lot of weight on the European index. However, in recent years there have been some EuroStoxx index changes - banks have been losing weight in favour of other sectors related to consumption and automobiles. Below, you can see the companies that make up the index as of November 20, 2020:
| ADIDAS (DE) | AHOLD DELHAIZE (NL) | AIR LIQUIDE (FR) | AIRBUS (FR) | ALLIANZ (FROM) |
| AMADEUS (ES) | ANHEUSER-BUSH (BE) | ASML HLDG (NL) | AXA (FR) | BASF (DE) |
| BAYER (FROM) | BBVA (ES) | BCO SANTANDER (ES) | BMW (DE) | BNP PARIBAS (FR) |
| CRH (IE) | DAIMLER (DE) | DANONE (FR) | DEUTSCHE BOERSE (DE) | DEUTSCHE POST (DE) |
| DEUTSCHE TELEKOM (DE) | ENEL (IT) | ENGIE (FR) | ENI (IT) | ESSILORLUXOTICA (FR) |
| FRESENIUS (DE) | GRP SG (FR) | IBERDROLA (ES) | INDITEX (ES) | ING GRP (NL) |
| INTESA SANPAOLO (IT) | KERING (FR) | L'OREAL (FR) | LINDE (FROM) | LVMH (FR) |
| MUENCHENER RUECK (DE) | NOKIA (FI) | ORANGE (FR) | PHILIPS (NL) | SAFRAN (FR) |
| SANOFI (FR) | SAP (DE) | SCHNEIDER ELECTRIC (FR) | SIEMENS (FROM) | TELEFÓNICA (ES) |
| TOTAL (FR) | UNILEVER (NL) | VINCI (FR) | VIVENDI (FR) | VOLKSWAGEN (DE) |
Source: Wikipedia.org
As we can see in the table, since the latest EuroStoxx index changes, Spain is represented by six companies in the European index: Telefónica, Iberdrola, Inditex, BBVA, Banco Santander and Amadeus. However, none of them are in the 'top 10' by capitalization.
France is the country with the highest weight in the index, with a total of 18 companies, followed by Germany, with 15 companies. The Netherlands, despite having one less company than Spain in the index, has greater weight by capitalization.
If we make a ranking of the five companies with the highest capitalization of the European index, France continues to win since the list is headed by LVMH, whose capitalization is already close to 200,000 million euros. The luxury brand is followed by L'oreal, SAP, Sanofi-Synthelabo and ASML.
Are you wondering, at what time does the Euro Stoxx 50 close? The trading hours for EuroStoxx 50 index begin at 09:05 GMT+2 and end at 22:55 GMT+2.
Do you want to gain access to the world's most premiere multi asset platform? Click the link below and get started now:

Historical Analysis
Let's look at the EuroStoxx 50 index history. It reached its all-time high to date at the height of the economic boom in Europe in 2007 when it hit 4,500 points. With the outbreak of the financial crisis, like the main stock market indices in the world, it suffered a harsh punishment from which it did not begin to recover until March 2009.
One method of analysis of this index entails looking at the EuroStoxx 50 gross return index. However, here I'm going to analyze this index with its price charts. From March 2009, it has recovered ground little by little, testing the resistance at 3,900 points twice, as we see in the graph below:

Let's take a closer look at our EuroStoxx index historical data. We'll now stop at the price of the European index over the past nine years. As we can see in the graph below, throughout this period we can distinguish three cycles.
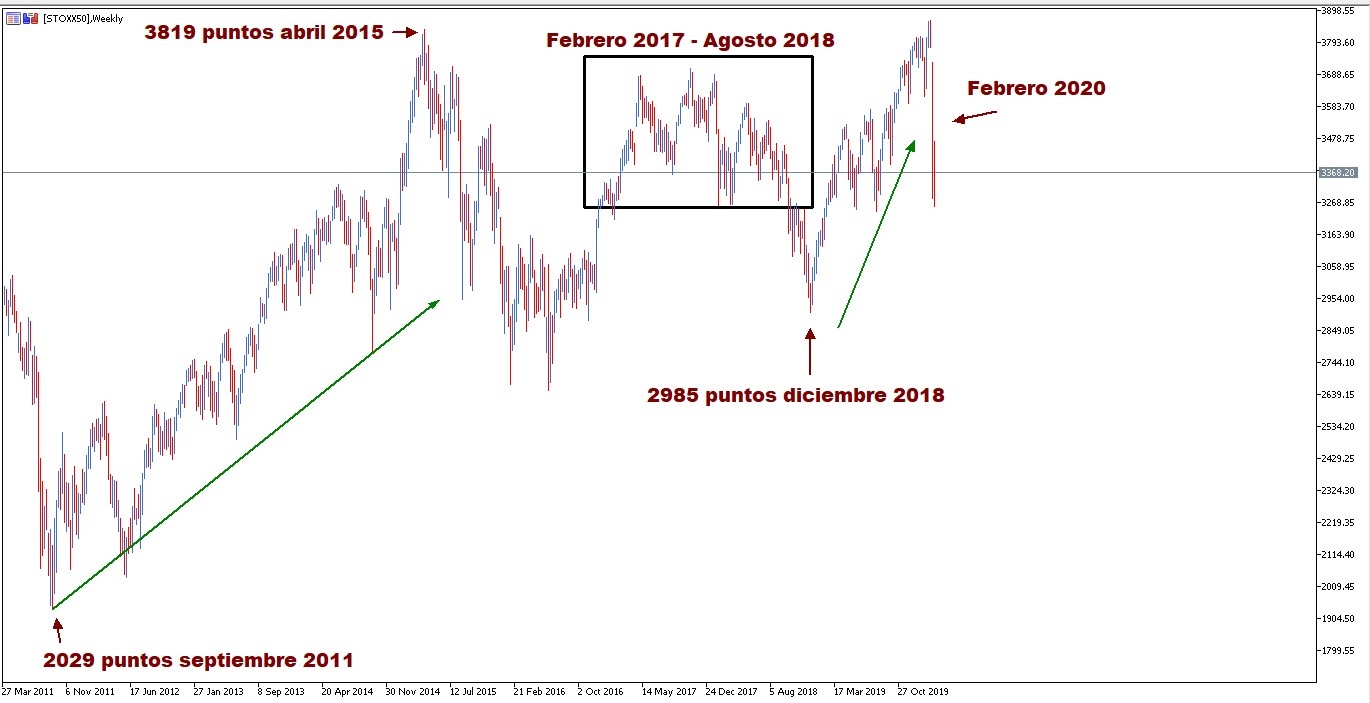
On the left side of the graph, we see how, in September 2011, the European index started an upward path that lasted until April 2015, when it reached its highest for that period, at 3,819 points. Over the next year, however, the index posted decreasing highs and lows.
In the central part of the graph we see a lateral trend between February 2017, and August 2018, that broke with a downtrend to 2,985 points. Since then, in December 2018, the European index started coming back and managed to surpass its all-time high at the beginning of 2020 by touching 3,841 points.
The crisis caused by the spread of the coronavirus, however, interrupted this good streak and, as we see, at the end of February it fell vertically, dragged by the general losses in global markets due to the fear of the pandemic and its repercussion on the macroeconomic data.
The European Index
Since mid-2019, the European index has been in an upward channel sustained by the slight improvement in macroeconomic data, coinciding, for example, with the certainty that Germany had not entered a recession as was feared at the beginning of the summer of that year.
Despite the slowdown announced by the various international organizations, the truth is that the European economy was in good health. Until the outbreak of the coronavirus crisis.
Let's see how the emergence of the virus in China and its subsequent arrival in Europe has affected the benchmark of the Eurozone.
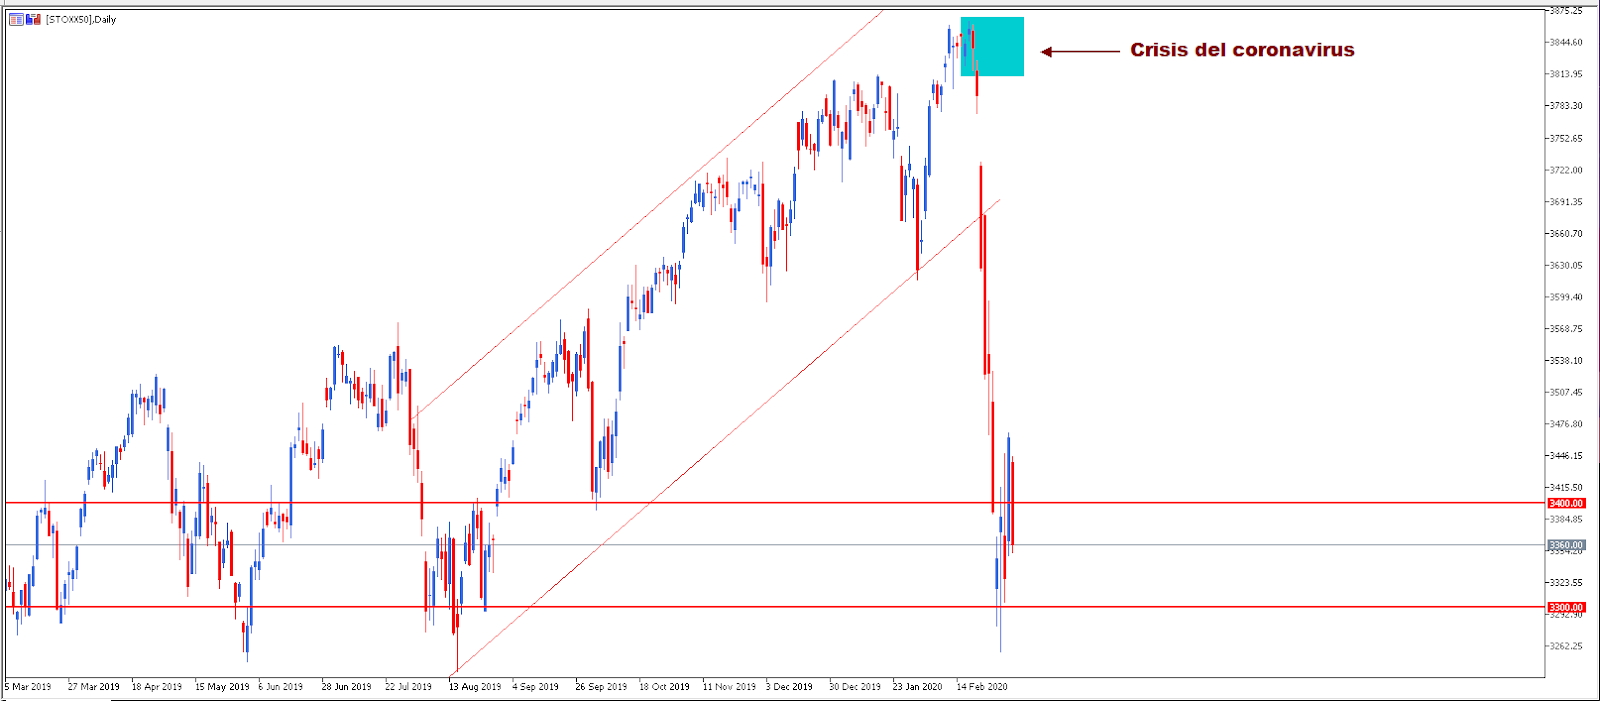
On February 24, the price breaks the lower part of the channel and collapses in the following days until breaking the important support of 3,400 points. In subsequent sessions, the index remains between 3,300 and 3,400 points without confirming a clear trend.
Although the specific impact of the virus on economies cannot be quantified, international organizations have already begun to cut their prospects for this year, so it will be necessary to closely monitor the evolution of the stock markets to make decisions.
If you need training for safer trading, Admirals UK Ltd offers free trading webinars for all levels.
Correlation With Other Indices
The exclusive Supreme Edition plugin for MetaTrader 5 offered by Admirals includes a very useful tool called Correlation Matrix. This tool shows the correlation between two assets, whether they are indices, currency pairs, or commodities. In this case, we’re going to see the correlation of the EuroStoxx 50 with the main European and Wall Street indices:
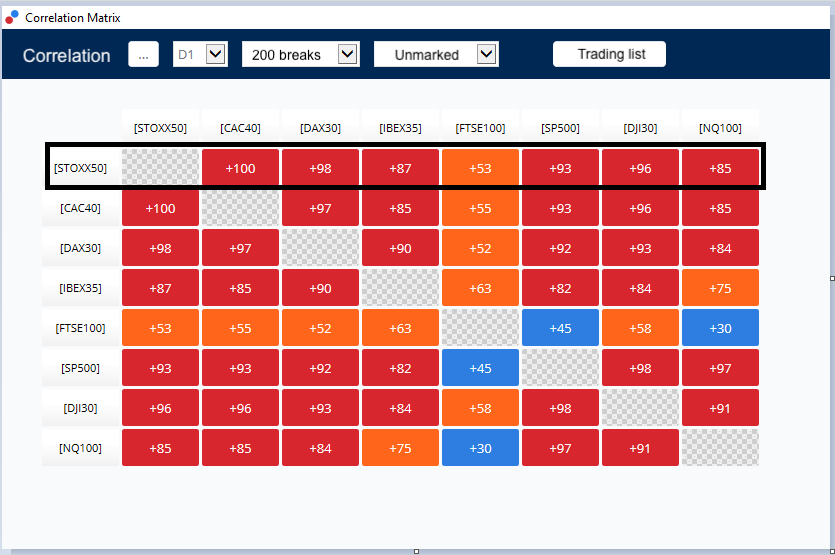
The image shows us how the French CAC 40 and the EuroStoxx 50 are very closely correlated with a +100 Red. This doesn't sound strange considering that the European index has a majority of French companies.
It also has a high correlation with the rest of the indices, with the sole exception of London's FTSE 100, with which it has an average correlation of +55 Orange.
Is Euro Stoxx 50 a Good Investment?
An investment in the EURO STOXX 50 can be a wise investment option for someone interested in buying and holding onto their investment for a longer period of time. For those of you that are interested in the fun part - finally making your investment - I'll now present to you how to invest in the European index.
How to Invest in the European Index With Admirals
With Admiral Markets, you can invest in the European index through Contracts for Difference (CFDs), which also allows you to trade short. If you already have an open account and want to open CFD positions on the European index in your MetaTrader, just follow these steps:
- Go to the 'View' tab and click on 'Market Observation'
- Search for EuroStoxx 50 (STOXX50) under 'Symbol'
- If it doesn't appear, you can write it in the last line
- Double click on the symbol
- All the parameters necessary to open the position will appear in the pop-up window
- Click on 'Sell' or 'Buy' according to your interests
You now have your open position on the STOXX50 CFD!
EuroStoxx: CFD Conditions
In the section 'Contract specifications' that appears on the Admirals website, you can consult all the conditions of the operation with a STOXX50 CFD. The most important aspects to take into account are the following:
- Typical spread: 1.3 pips
- Minimum contract size: 0.1 lots
- Maximum contract size: 50 lots
- Minimum margin retained: 0.25% (retail 2.5)
- No opening fees

Other articles that may interest you:
- Copy Trading With MetaTrader: How to
- Seasonal Patterns of Financial Markets: A complete guide
- What is Institutional Trading? The All You Need to Know Guide
Frequently Asked Questions
What is the Euro Stoxx 50 Index?
The Euro Stoxx 50 Index is a stock market index that represents the performance of 50 large, blue-chip companies from 19 European countries using the euro as their currency. It includes companies from various sectors, such as finance, energy, technology, and more.
How is the Euro Stoxx 50 Index calculated?
The Euro Stoxx 50 Index is calculated using a market capitalization-weighted methodology. This means that companies with larger market capitalizations have a greater impact on the index's movement. The index is reviewed and rebalanced regularly to ensure it accurately reflects the changing market landscape.
What does the Euro Stoxx 50 Index indicate?
The Euro Stoxx 50 Index serves as a benchmark for the performance of European blue-chip stocks. It provides insights into the overall health and trends of the European stock market. Investors and financial professionals use it to gauge the performance of large European companies and make informed decisions about their investment strategies.
INFORMATION ABOUT ANALYTICAL MATERIALS:
The given data provides additional information regarding all analysis, estimates, prognosis, forecasts, market reviews, weekly outlooks or other similar assessments or information (hereinafter “Analysis”) published on the websites of Admiral Markets investment firms operating under the Admiral Markets and Admirals trademarks (hereinafter “Admirals”). Before making any investment decisions please pay close attention to the following:
1. This is a marketing communication. The content is published for informative purposes only and is in no way to be construed as investment advice or recommendation. It has not been prepared in accordance with legal requirements designed to promote the independence of investment research, and that it is not subject to any prohibition on dealing ahead of the dissemination of investment research.
2. Any investment decision is made by each client alone whereas Admirals shall not be responsible for any loss or damage arising from any such decision, whether or not based on the content.
3. With view to protecting the interests of our clients and the objectivity of the Analysis, Admirals has established relevant internal procedures for prevention and management of conflicts of interest.
4. The Analysis is prepared by an independent analyst (hereinafter “Author”) based on the personal estimations of Alexandros Theophanopoulos (SEO and Content Specialist).
5. Whilst every reasonable effort is taken to ensure that all sources of the content are reliable and that all information is presented, as much as possible, in an understandable, timely, precise and complete manner, Admirals does not guarantee the accuracy or completeness of any information contained within the Analysis.
6. Any kind of past or modeled performance of financial instruments indicated within the content should not be construed as an express or implied promise, guarantee or implication by Admirals for any future performance. The value of the financial instrument may both increase and decrease and the preservation of the asset value is not guaranteed.
7. Leveraged products (including contracts for difference) are speculative in nature and may result in losses or profit. Before you start trading, please ensure that you fully understand the risks involved.