Trade the Fear Index - Learn to trade the VIX index in 2026
Learn to trade the VIX index! What is the VIX index? If you are familiar with trading, economic news, or the financial media, chances are you have already heard of the VIX, also known as the Fear Index. Is that name disturbing to you?
Don't worry, in this article you’re going to discover everything you need to know to trade the VIX index and answer the question, “What is the VIX Volatility index?”

Table of Contents
VIX Index: An Introduction
The VIX index is the volatility index. So, what does the VIX index measure? It measures the volatility of Chicago market options (CBOE or Chicago Board Options Exchange) in the S&P500 index (Standard & Poor's 500).
➤ But, what marks the volatility of the VIX? The VIX represents the volatility of the monthly call and put options on the SP500.
➤ How is the VIX index calculated? The VIX is calculated with a formula that derives the expected volatility by finding the average of the weighted prices of out-of-the-money calls and puts.
The value of the price of the VIX index reflects a measure of volatility in percentage terms, so its price is limited to between 0 and 100.
Isn't that a specific definition? How does the vix volatility index work? Let's see an example:
Let’s suppose that the VIX volatility has touched the 25 level. If the VIX price is 25, this means that the volatility of the SP500's monthly and weekly options is 25%. Therefore, investors expect the price of the S&P to rise or fall by around 25% throughout the year.
Are you interested in practicing your trading under real and live market conditions? If so, why not register for a free demo account and hone your skills before trading on the live markets! Click the banner below to get started:

History of the Fear Index
To understand the creation of the volatility index, it is necessary to go back to the first serious research on the volatility of financial markets.
The pioneers in volatility research are Professors Menachem Brenner and Dan Galai, who successfully created the first volatility index in 1986. This successful work was published as New Financial Instruments for Hedging Changes in Volatility.
Brenner and Galai had planned to call the volatility index 'Index Sigma', with reference to the symbol sigma, which refers to volatility in financial mathematics.
It wasn't until 1992 that the Chicago Board of Options Exchange began its own research on volatility and the creation of an index based on it.
➤ Their objective as a stock exchange was to create an index based on the volatility of options that was available for trading and not just an indicator for financial analysts.
Thus, the VIX volatility-index was created in 1993 thanks to the work of Professor Whaley.
Interpreting the Fear Index
Let's look at how to interpret the VIX index.
The VIX index is also commonly known as the Investor Sentiment Index, Fear Index, VIX Index, CBOE VIX Index (CBOE Volatility Index VIX), or S&P500 VIX.
But, what information does the VIX index provide? Let’s look at how to read the VIX index. The VIX measures the volatility of the largest US stock index, the S&P, which includes 500 companies, making it a psychological index.
In markets, volatility represents confidence or fear.
▶ When the VIX approaches 0, it reflects a sentiment of investor confidence in the US economy.
▶ When the VIX moves towards 100, it reflects pessimism or fear on the part of these same investors.
There are three levels of scope on the CBOE.VIX:
➢ Between 0 and 20: there is little volatility in the market, investors are confident and the S&P500 is, in principle, in an uptrend
➢ Between 20 and 30: Investors start to worry, which leads to volatility, the upward trend of the SP500 may continue but also start to reverse.
➢ Between 30 and 100: it's panic on the part of investors! Volatility is particularly high and we are probably witnessing a sharp correction or even a collapse in the prices of the SP500 and major stock indices.
These levels can be adjusted according to your vision of the markets. Some more cautious investors prefer to use the ranges 0-15, 15-25 and 25-100, while the more speculative investors prefer to consider the price ranges 0-25, 25-40, 40-100.
Fear Index: Price History
Looking at the price history of the VIX CBOE, it's interesting to look at the all-time highs that capture moments of panic and uncertainty in the stock markets.
One of the main levels we can focus on is the psychological threshold of 40 points, which has only been exceeded 6 times:
1️⃣ In 1998, the VIX hit 60 when the Russian financial markets crashed.
2️⃣ In 2001, after the September 11 attacks, the price of the volatility index exceeded 58 points.
3️⃣ In 2002, the series of financial scandals that began with Enron brought the volatility index to 58 points between July and November.
4️⃣ In 2008, when the subprime crisis broke out, the volatility-index reached 79 points in October.
5️⃣ In 2018, in full doubt of a financial fissure, the volatility-index reached 50.30 points on February 6.
6️⃣ In 2020, during March and April, the volatility-index remained above 40 points, even exceeding 80 points on March 18, a historical level, mainly due to all the news related to the coronavirus, and the consequent collapse of the markets.
Looking at these 6 cases, it is perfectly understood why it is called the Fear Index.
VIX Index: How to Trade
Besides asking yourself, "What is todays VIX score?" and finding it's rate today, there are some key points to consider before deciding whether and how to invest in the VIX index:
- CFD contract duration
- Trading hours
The volatility index VIX is one of the favourites of investors who trade US indices, stocks and ETFs (Exchange Traded Funds). VIS index investing with CFDs (Contracts for Difference) is as simple as opening a trade on any other index CFD.
Index CFD contract duration
Admirals allows you to trade CFDs on the fear index from a Trade.MT5 account. The expiration of the CFD contract on the Volatility Index Future is 1 month. Therefore, the trading positions are automatically closed at the end of the contract.
The main advantage of these positions is the absence of swap fees! There are no trading fees for keeping trades open overnight, just the spread.
As the fear index is an American index, the volatility-index is quoted in US dollars (USD). Each lot represents a contract of 10 USD per point for 1 lot, with a leverage of 1:10 for retail traders and 1:30 for professional traders.
Already trading on the world's most premiere multi asset platform? If not, click the banner below and join countless of traders now!

Fear Index: Trading Hours
- From 23:00 to 21:15 GMT
- Sunday to Friday
With Admirals, you can trade the Volatility Index Futures CFD continuously for a very long period of time from 23:00 - 21:15 GMT. This time period is particularly advantageous.
In fact, as the VIX CBOE is an index with a highly psychological aspect, it can react to American, as well as European or Asian economic announcements, particularly in the current context of the trade war between the US and China.
And it turns out that China publishes its economic announcements and most of its declarations regarding the negotiations at night or very early in the morning.
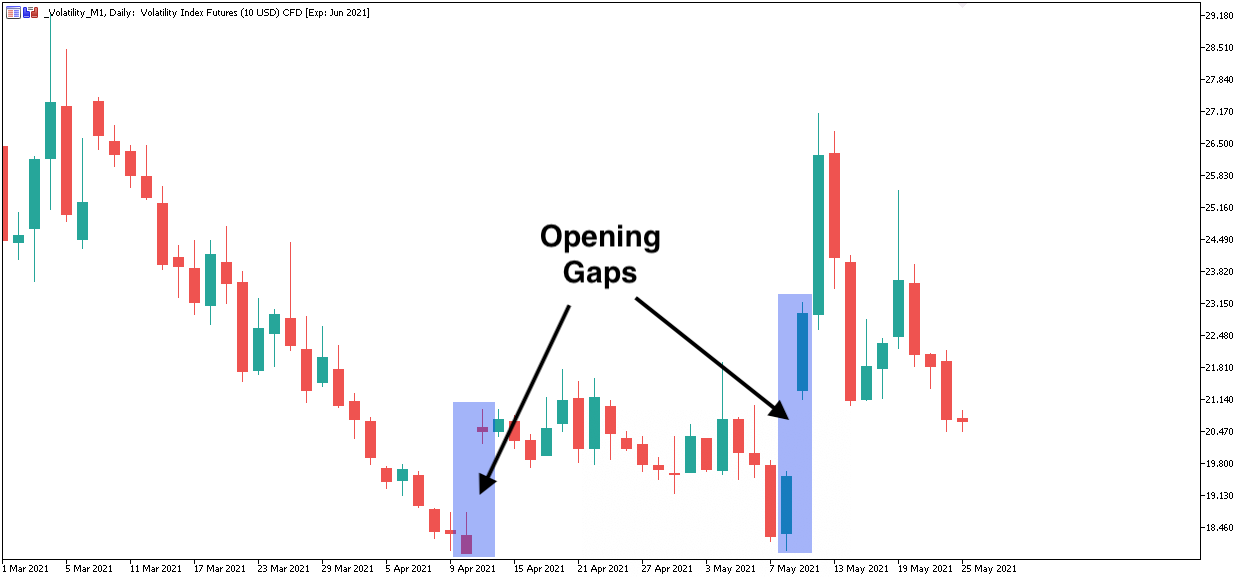
In this way, it allows night traders, as well as "early risers", to position themselves quickly without having to suffer the consequences of having an opening gap!
However, this cannot always be avoided. The coronavirus situation is affecting all markets, and this general fear is reflected in the volatility index, which can be seen below with a couple of opening gaps on the VIX index chart:
Analyzing the Fear Index
Next, we are going to see 3 ways to analyze the fear index:
- Trend Analysis
- Price Action Analysis
- Fundamental Analysis
Like all financial instruments, the fear index responds well to technical and graphical analysis. But its uniqueness, as a volatility index, makes it particularly suitable for fundamental analysis and economic announcements.
Trend Analysis
If we want to analyze the trend of the index we will have to focus on two factors:
- Time frame
- Trend indicator
Start by choosing an important time frame like H4, D1, W1, or MN. The larger the time frame, the more relevant is the identified trend. However, it may be wise to use a large unit of time that isn’t too far from the time frame in which you really want to trade.
➤ For example, if you want to trade on an H1 chart, it will be more useful and the information will be clearer if you analyze the trend on H4 or D1 instead of W1 or monthly. If you want to invest in H4, it is more relevant to analyze the underlying trend in D1 and W1.
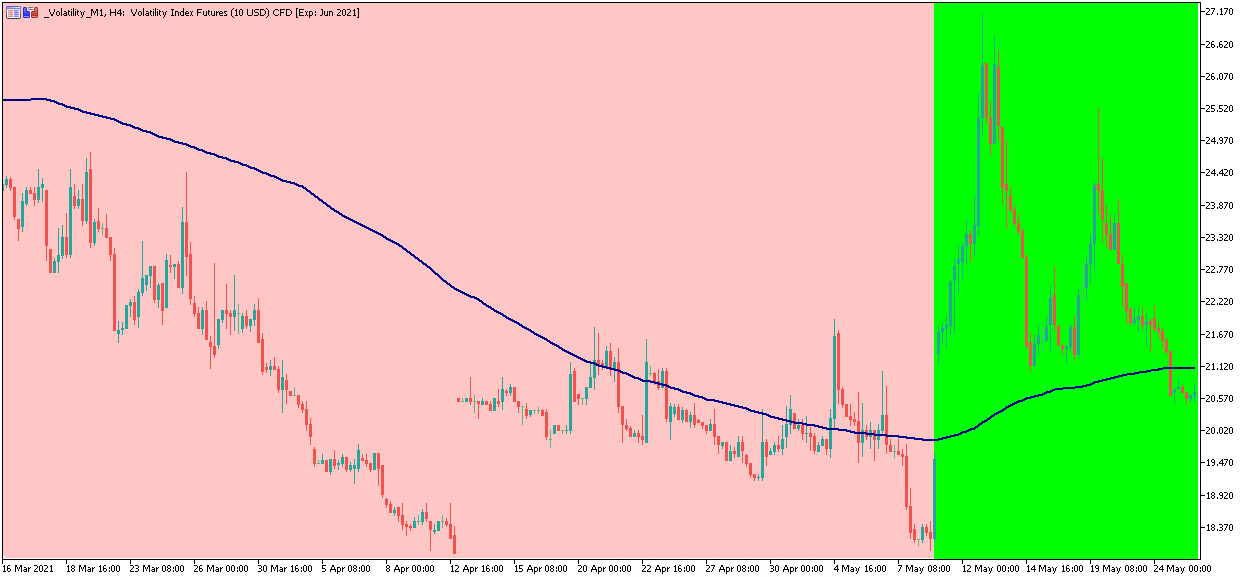
The 100 or 200 period moving average indicator is an excellent trend indicator. It is used by many investors and traders, as it allows a trend to be quickly identified visually:
- Upward trend: prices are above the moving average and it tends to increase.
- Downward trend: prices are below the moving average and it tends to fall.
✍ Example of a trend in the index - upward trend in green, downward trend in red:
Once you've identified your long-term trend, it's time to look at the short-term trend.
Indeed, if the long-term trend gives us an interesting insight into what has been happening in the index in the last few days or weeks, it is important to know what is currently happening in the short term. Even in a downtrend, there are upward correction phases! And vice versa.
You have two options:
- Study the short-term trend of the fear index in the same time frames as the long-term trend (in our example, in H4)
- Study the short-term trend in a lower time unit (for example, M30 if it has been studied long-term in H4).
You can use moving averages again, for example, but this time with lower periods, 20 (white below) and 50 (blue).
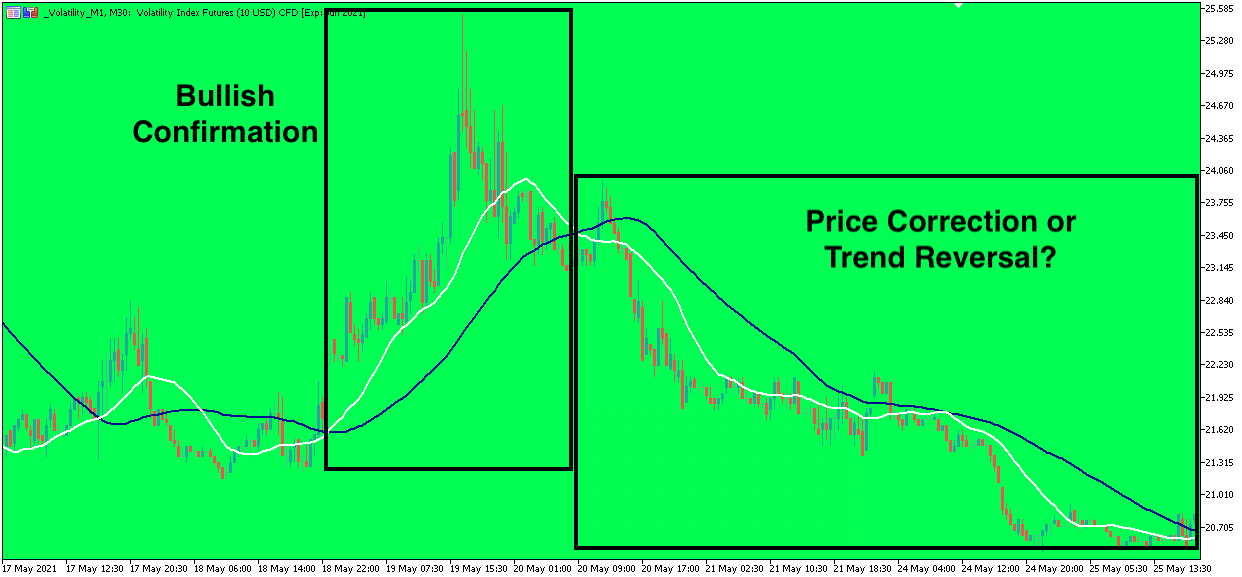
➣ In a long-term downtrend: If the 20 SMA is lower than the 50 SMA, this confirms the continuation of the short-term price decline. Conversely, if the 20 SMA is higher than the 50 SMA, it confirms a short-term correction of the VIX share price.
➣ In a long-term uptrend: If the 20 SMA is above the 50 SMA, this confirms the continuation of the upwards trend. If, however, the 20 SMA is lower than the 50 SMA, this implies a short-term downward correction or the potential start of a trend reversal.
Price Action
The fear index is also sensitive to price analysis, which can help you interpret possible movements in the VIX volatility index.
The easiest way to get started is to study the breakouts from the previous highs and lows on the VIX chart.
➨ If the price breaks the last low of the chart, the close of the candle indicates a desire to continue the decline.
➨ Conversely, in the event of a breakout to the upside of the latest high, confirmed by the close of the candle, the price action will confirm the pressure from buyers to continue the price rise in the index.
For a more in-depth study of price action, you can also check the Japanese candlestick settings, as well as the implementation of the Dow or Elliott wave theory.
Fundamental Analysis
Let's not forget that the fear index is, above all, an indicator of volatility and the index of fear in the markets!
As a result, it is also particularly sensitive to economic announcements and the geopolitical context affecting markets.
The main economic announcements that influence the price of the index are:
- US GDP
- The US Consumer Price Index.
- Fed rates
- Unemployment rate in the US
But not only that! In the current context, we can also highlight the role of the coronavirus pandemic. This is an extraordinary situation that is causing extreme movements in the markets, as can be seen in this VIX index live chart:
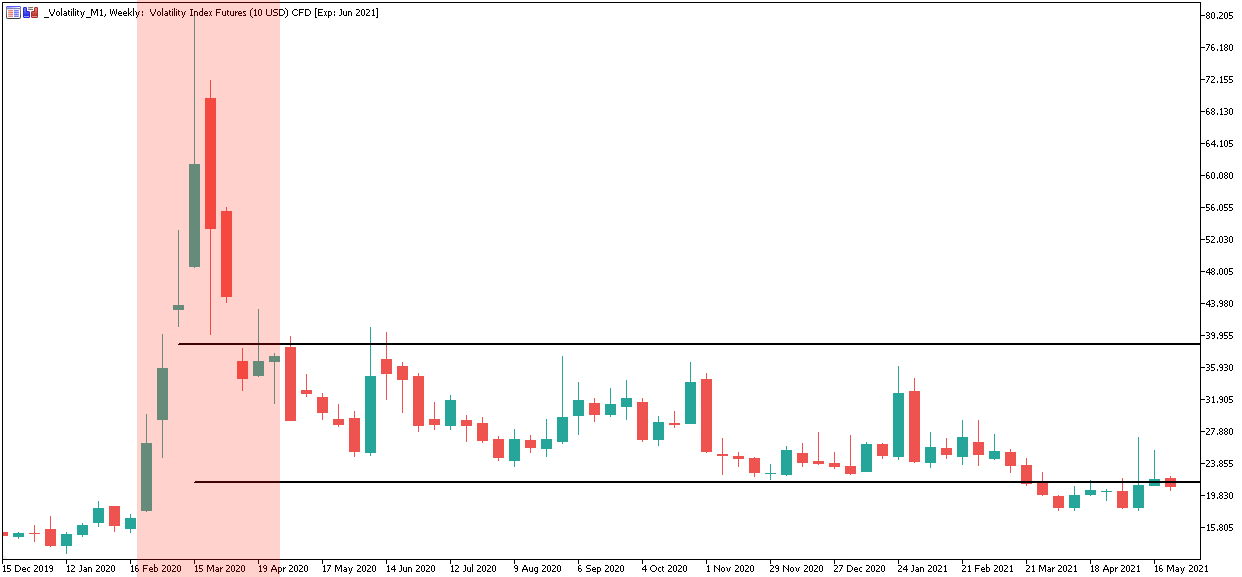
When the cases began to spread and the restrictive measures began, volatility in the markets increased considerably and, therefore, the price of the VIX index also increased. This shows once again why it is known as the "Fear Index".
However, we can see that when solutions and means were implemented and the markets began to recover from their falls, the volatility index began to decrease, remaining in a range approximately between 20 and 40 until March 2021, when the index broke through the lower channel.
This range is still higher than the level that existed before the pandemic, there is still a lot of uncertainty and measures are continuously being taken that affect the markets.
VIX Index: Correlation with other Assets
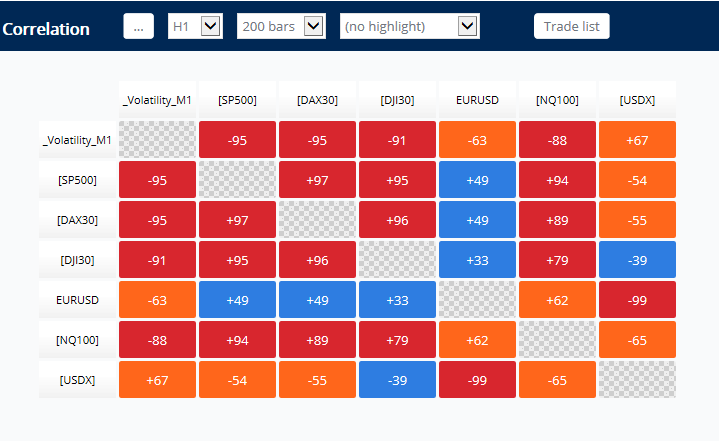
The fear index is the volatility index based on the Chicago S&P500 options market. As a result, it is highly correlated with the major American indices.
Thus, we observe that in the H1 data, the fear index is more than 90% correlated with the S&P500 and the DowJones30.
It should be noted, however, that this is an inverse correlation. That is, when the price of the fear increases, the price of the US indices decreases.
So what does the fear index do when the S&P500 goes up? It drops.
However, although the fear index is also generally correlated with the EUR/USD and the dollar index, the two main currency pairs linked to the US economy, such a strong correlation does not exist in the time period below.
This correlation can be exploited in two different ways:
- To confirm analysis before entering the position
- To limit risk by hedging a correlated asset
Of course, depending on the time frame of your analysis and your investment horizon (scalping, day trading or swing trading) you can study the correlation in larger or smaller units of time. In our example above we have chosen the H4 chart in the last 200 candles.
Buying the Fear Index on MetaTrader
Here’s how to buy the VIX index from your Metatrader platform:
- Log in to your Trade.MT5 account
- Go to Market Watch
- Search for "Volatility Index Futures"
- Right click on the VIX index and select "Chart Window"
- Choose the number of lots to trade
- Click BUY using the one-click trading shortcut
Selling the Fear Index on MetaTrader
Here’s how to sell the VIX index from your Metatrader platform:
- Log in to your Trade.MT5 account
- Go to Market Watch
- Search for "Volatility Index Futures"
- Right click on the VIX index and select "Chart Window"
- Choose the number of lots to trade
- Click SELL using the one-click trading shortcut
Derived indices
Since the introduction of VIX COBE in 1993 in the Chicago market, many other exchanges have chosen to create a volatility index based on the benchmark.
Among them we can find, in particular:
- The VNX - the US100 volatility index
- The VXD - the volatility index of the DowJones30
- The VCAC - the volatility index of the CAC40
- The VDAX-NEW - the volatility index of the DAX30
- The VSTOXX - the volatility index of the Eurostoxx50
Frequently Asked Questions
What is the volatility index (VIX)?
The volatility index (VIX), also known as the "fear index" or "fear gauge," is a financial metric that quantifies market participants' expectations of future stock market volatility. It represents investors' sentiments and perceptions of risk in the market. A higher VIX value indicates higher expected volatility, while a lower VIX suggests lower expected volatility.
How is the VIX calculated?
The VIX is calculated using the prices of S&P 500 index options. It measures the market's consensus on the expected volatility of the S&P 500 over the next 30 days. The calculation is based on a complex formula that considers the prices of different call and put options. As a result, the VIX is often referred to as the "implied volatility" of the S&P 500.
What does a high or low VIX value imply?
- High VIX: A high VIX typically indicates increased fear and uncertainty in the market. Investors may anticipate higher price fluctuations and potential market downturns, leading to more cautious investment behavior and risk aversion.
- Low VIX: A low VIX suggests that market participants expect relatively stable and less turbulent market conditions. This may indicate higher confidence in the market and a potential uptrend in stock prices.
Note: The VIX is not an indicator of the stock market's direction but rather a measure of its anticipated volatility. It's essential to interpret the VIX in conjunction with other market analysis tools and indicators for making informed investment decisions.
Looking to always stay up to date? Why not tune in to one of our free webinars, where you can gain new insights and strategies with our in house trading experts! Click the banner below for more:

Other articles that may interest you:
- Understanding the Risk Reward Ratio
- Cruise Line Stocks - How to invest in them
- Floating Exchange Rate - The pros and cons
INFORMATION ABOUT ANALYTICAL MATERIALS:
The given data provides additional information regarding all analysis, estimates, prognosis, forecasts, market reviews, weekly outlooks or other similar assessments or information (hereinafter “Analysis”) published on the websites of Admirals investment firms operating under the Admirals trademark (hereinafter “Admirals”) Before making any investment decisions please pay close attention to the following:
- This is a marketing communication. The content is published for informative purposes only and is in no way to be construed as investment advice or recommendation. It has not been prepared in accordance with legal requirements designed to promote the independence of investment research, and that it is not subject to any prohibition on dealing ahead of the dissemination of investment research.
- Any investment decision is made by each client alone whereas Admirals shall not be responsible for any loss or damage arising from any such decision, whether or not based on the content.
- With view to protecting the interests of our clients and the objectivity of the Analysis, Admirals has established relevant internal procedures for prevention and management of conflicts of interest.
- The Analysis is prepared by an independent analyst based on their personal estimations.
- Whilst every reasonable effort is taken to ensure that all sources of the content are reliable and that all information is presented, as much as possible, in an understandable, timely, precise and complete manner, Admirals does not guarantee the accuracy or completeness of any information contained within the Analysis.
- Any kind of past or modeled performance of financial instruments indicated within the content should not be construed as an express or implied promise, guarantee or implication by Admirals for any future performance. The value of the financial instrument may both increase and decrease and the preservation of the asset value is not guaranteed.
- Leveraged products (including contracts for difference) are speculative in nature and may result in losses or profit. Before you start trading, please ensure that you fully understand the risks involved.