How to Trade the Fed Rate Decision
Did you know that the announcement of the Fed funds rate is arguably the most watched and traded event for traders and investors all over the world? The Fed's rate decision impacts not only the US economy but also the global economy. However, it also has a huge - and immediate - impact on financial markets including currencies, stocks, bonds and even commodities.

But why is the Fed interest rate so important? How does it impact different markets? More importantly, how can you trade the Fed rate decision and any potential volatility from it? Keep on reading to find out!
How to trade Fed rates - What is the Fed funds rate?
The Fed funds rate is the interest rate banks charge each other to lend Federal Reserve funds overnight. Banks borrow these funds from one another to meet and maintain strict reserve requirements.
It is also used as a tool by the Federal Reserve to manage the country's money supply in order to achieve a healthy economy, while also serving as a benchmark for interest rates on savings, loans, credit cards and more. Any changes in the interest rate causes significant movement in the financial markets, especially the US dollar, as we discuss in more detail further down this article.
How to trade Fed rates - How is the rate determined and when is it released?
The Federal Reserve (Fed) has a mandate to conduct monetary policy to achieve its macroeconomic objective of "maximum employment and stable prices." To do this, the Fed created its own policy-making body called the Federal Open Market Committee (FOMC) which is composed of 12 members; seven members of the Board of Governors and five of the 12 Federal Reserve Bank presidents.
The FOMC schedules eight meetings per year but also holds unscheduled meetings to review economic and financial developments. It is in these meetings where the FOMC decides where to set the Fed funds rate, also known as the Fed interest rate, or just the Fed rate. The decision to adjust interest rates, or keep them on hold, is typically in response to changes in the economic outlook.
Before we look at some of the factors that cause the Fed to change interest rates and how to trade that decision it is first useful to know where to find the release of the FOMC decision. The easiest place to find this information is in the Admirals UK Ltd Forex Calendar which can be found under the Analytics tab on the Admirals homepage.

From here, users can use the filter button to view a specific country's economic news calendar, as well as filter by the impact. To view when the Fed rate decision will be, simply select the United States and high impact which is denoted by the three red dots at the top. Once these are the only two selections, you will be able to see all the high impact news releases for the United States, as shown below:

In the example above, we can see there is a Fed interest rate decision on Wednesday, January 29, 2020, at 19:00 GMT. The calendar also gives us some more information such as the previous interest rate which in this example is 1.75%. Closer to the time of the release the calendar will be updated with a forecast of what the market and leading economists are expecting the decision to be. At the time of the release, the 'actual' number will be updated.
- If the actual number is higher than the previous or forecasted number it is known as a Fed rate hike. Typically, the US dollar will rise on this occasion - depending on what has already been anticipated by the market.
- If the actual number is lower than the previous or forecasted number it is known as a Fed rate cut. In this situation, the US dollar will typically fall - again, depending on what has already been anticipated by the market.
At this stage, it is important to remember that markets move on anticipation or expectation of a particular result. Large institutions will already start to adjust their positions and portfolios if there is a higher likelihood of one result over another. Any large moves at the time of the actual result could mean that the market has been caught by surprise.
You can learn more about the latest news announcements and how the markets respond to them by watching the Trading Spotlight webinar series. Three times a week, three professional traders deep dive into a variety of trading topics. To reserve your spot in these complimentary webinars, simply click on the banner below:

Before we look at how to trade the Fed interest rate decision, let's first look at what influences the FOMC's decision regarding the Fed rate.
How to trade Fed rates - What causes changes in the rate?
One of the most important goals for the Federal Reserve is to keep inflation steady at a rate of two percent. Inflation refers to the rate at which the price of goods and services increase. While there are many factors the FOMC take into consideration when setting interest rates, inflation is one of the biggest influencers.
If inflation gets too high, the Fed may look to increase the Fed funds rate. This reduces the amount of money banks have to lend which slows consumer borrowing and demand. It can also make consumer debt more expensive forcing people to spend less thereby reducing demand and bringing prices of goods and services lower.
If inflation falls, it is an indicator that consumers are not spending, among other things. This is a problem for the central bank as it could lead to an economic downturn. In this situation, the Fed is more likely to cut interest rates to stimulate economic activity. A lower interest rate means cheaper borrowing for both consumers and businesses which in turn could lead to economic growth.
We can see this correlation - loosely - when viewing Fed interest rate history, as discussed in the next section.
How to trade Fed rates - What can we learn from Fed interest rate history?
The chart below shows the correlation from 2002 - 2019 between the Fed funds rate (the blue line) and the 10-Year Treasury inflation index (the red line). While not perfect, it does highlight the link between inflation and interest rate policy.

Source: Federal Reserve Bank of St. Louis, accessed on 9 January 2019. Please note: Past performance is not a reliable indicator of future results or future performance.
In the chart above, it is clear to see the Fed interest rate history and its correlation to inflation. It is also clear to see the aggressive drop in interest rates from 5% in 2007 to near 0% from 2009. This was in response to the 2008 financial crisis where economic activity and consumer spending were at extremely low levels.
From 2016, there has been much more movement in both inflation and interest rates, making the next decade or so a very interesting time to be involved in the financial markets. In fact, from 2016 to 2019 there were many Fed rate hikes (as shown by the rising blue line), before a few Fed rate cuts in 2019 (as shown by the falling blue line), as the following chart shows:

Source: Federal Reserve Bank of St. Louis, accessed on 9 January 2019. Please note: Past performance is not a reliable indicator of future results or future performance.
Now that you understand some of the theory behind the Fed rate decision, you may be wondering how traders use this in a practical manner to trade from? Essentially, it involves viewing how the market's price action responds to the Fed's decision. To view live charts and the price action of a market you can to download the MetaTrader trading platform which is provided by Admirals for free. This will prove to be useful when going through practical trading examples and strategies in the following sections.
To start your FREE download, simply click on the banner below:

How to trade Fed rates - What impact does the rate decision have on markets?
Interest rates have the ability to dictate the flow of capital into and out of a country. In theory, if a country cuts interest rates it tends to lose its value against others. This is because a lower interest rate means a lower rate of return on instruments such as government bonds. If a country increases interest rates, fund managers, investors and pension portfolio managers may try to move their capital there to benefit from a higher rate of return.
If you had the option to receive a higher interest rate on your savings or a lower interest rate on your savings where would you move your capital to? Now think about how much money global financial institutions will move around to do the same thing! But, as we stated earlier, the market moves on anticipation or expectation. If investors feel a country is likely to increase or cut interest rates in the future they will already start to move their capital before an announcement may be made. This is why tracking the news and the economic calendar can pay off in the long run.
When it comes to the Fed rate decision and its impact on the US dollar, it can be tricky as the US economy is the world's biggest. If US economic growth is poor, then it's likely the global economy is doing poorly. Therefore, if the Fed does cut rates to stimulate the economy, investors may keep their capital in US dollars as it's the world's reserve currency and is deemed as one of the safest and most stable of global currencies to hold.
So what is the best way to trade the Fed rate decision then? Let's take a look!
How to trade Fed rate decisions
For traders, one of the ways to trade a possible Fed rate hike, or Fed rate cut, is to simply try and capitalise on the potential volatility of the news announcement. Markets tend to trade quietly in the run-up to high impact news announcements before increasing in volatility once the result is announced. Of course, sometimes there will be no market reaction but one of the keys to successful trading is preparation.
Before we look at the mechanics of trading the Fed rate decision let's have a look at how the market has reacted historically. While past performance is no guarantee of future performance it can provide some insight for traders to build upon.
On the 30 October 2019, the FOMC announced a Fed rate cut from 2% to 1.75%. The announcement was followed by an FOMC press conference where the Federal Reserve Chairman explained the reasons behind the decision. Let's take a look at the price action of the US dollar before, during and after the news release.
If you haven't yet downloaded your MetaTrader platform provided by Admirals for FREE, then do so now so you can follow through the next examples in the platform. Click here to start your download.
How to trade Fed rate decisions via the US dollar index
The US dollar index measures the performance of the US dollar against a basket of foreign currencies and can be viewed and traded in the MetaTrader trading platform provided by Admiral Markets. The price chart below shows the historical price of the US dollar index from July 2008 to January 2020.

Source: Admirals MetaTrader 5, USDX, Monthly - Data range: from 1 July 2008 to 12 January 2020, accessed on 12 January 2020 at 8:45 am GMT. - Please note: Past performance is not a reliable indicator of future results.
To view a chart of the US dollar index in your MetaTrader platform provided by Admiral Markets, follow these steps:
- Open your MetaTrader trading platform.
- Open the Market Watch window by selecting View from the tabs above and then Market Watch, or by pressing Ctrl+M on your keyboard.
- Right-click on the Market Watch window and select Symbols.
- Search for your symbol, such as the US dollar index, as shown below:
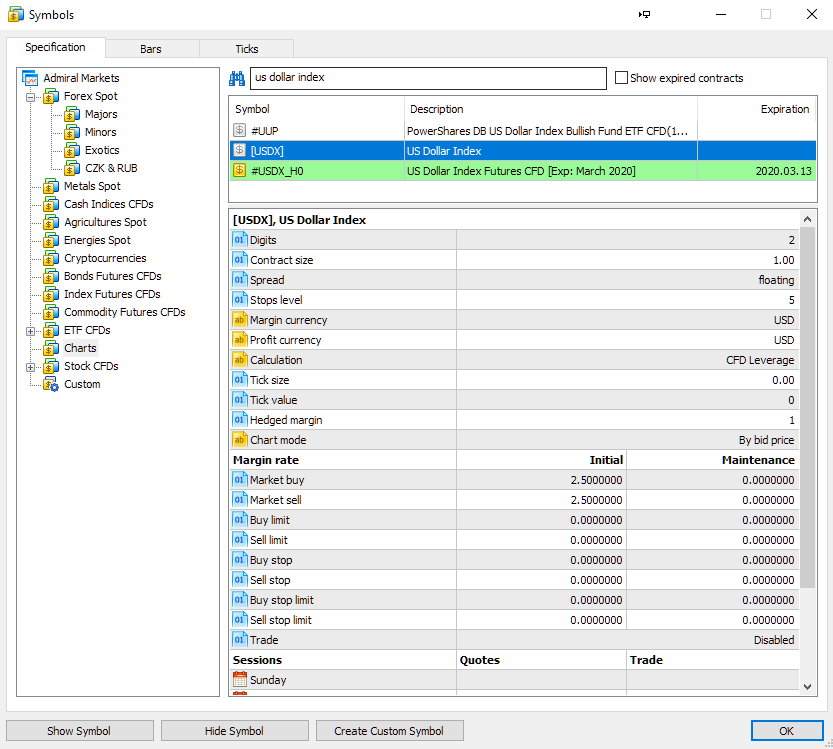
- After clicking OK, this will add the market to your Market Watch window.
- From the Market Watch window, you can simply select the US dollar index futures CFD (Contract for Difference) symbol and then drag it onto the chart.
You can learn more about the US dollar index and how to trade it in the ' How to trade the US dollar index' article. Did you know that you can also trade any of the markets in the platform completely risk-free by opening a FREE demo trading account?
Simply click on the banner below to open a demo trading account today and you can test your Forex trading strategies without any risks.:
For now, let's take a look at the price action of the dollar index on the 30 October, 2019, the day which the FOMC cut interest rates.
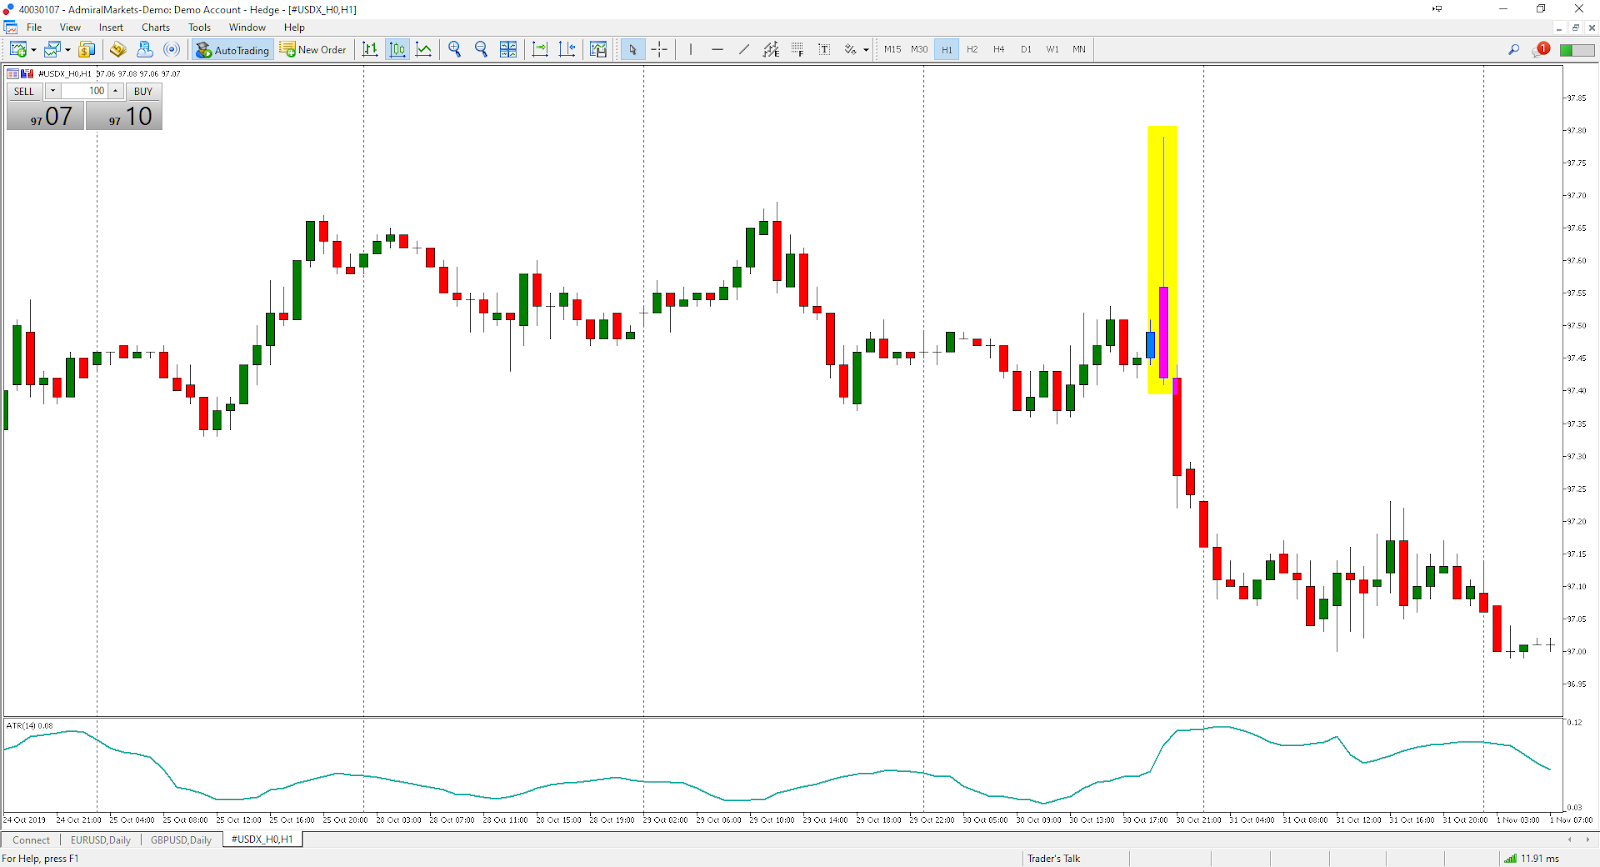
Source: Admirals MetaTrader 5, USDX, H1 - Data range: from 24 October 2019 to 1 November 2019, accessed on 12 January 2020 at 8:55 am GMT. - Please note: Past performance is not a reliable indicator of future results.
The highlighted yellow box shows the price action of the US dollar index at the time the FOMC announced an interest rate cut. It's clear to see the size of the candle is much bigger than any of the candles before. This increase in volatility is also shown by the rising green Average True Range (ATR) line at the bottom of the chart. ATR is a simple measure of volatility.
In the days before the FOMC Fed rate cut, the ATR remained relatively flat. This is also evident in analysing the price action before the announcement which also remained relatively flat. So how can traders try to capitalise on this? Here are a few options:
- Identify the pre-FOMC trading range and trade a breakout of the range.
- Identify the pre-FOMC trading range and trade a false breakout of the range.
- Wait for a price action trading signal and then trade the signal accordingly.
Let's have a look at option three in more detail.
How to trade Fed rate decisions using price action signals
Price action trading patterns help traders to identify potential turning points in the market. There are many different types of patterns which you can learn about in the 'Four Must Know Price Action Trading Strategies' article.
A popular price action trading pattern is the engulfing candle formation, of which there are two types: the bearish engulfing candle pattern and the bullish engulfing candle pattern. After the Fed rate cut on 30 October 2019, the hourly chart of the US dollar index formed a bearish engulfing bar formation, as highlighted in the yellow box below:
Source: Admirals MetaTrader 5, USDX, H1 - Data range: from 24 October 2019 to 1 November 2019, accessed on 12 January 2020 at 8:55 am GMT. - Please note: Past performance is not a reliable indicator of future results.
The bearish engulfing candle pattern, as shown above, is based on two candlesticks. The most important candle is the second one which engulfs the range (high to low) of the previous candle. On the second candle buyers push the market up, breaking the high of the previous candle.
However, during the same candle sellers step in and push it all the way down breaking the low of the previous candle and closing lower. This represents a significant shift in momentum to the downside.
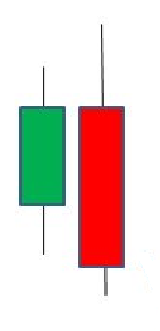
An example of the bearish engulfing candlestick pattern.
From this pattern, traders are able to identify that more sellers are stepping into the market. Combined with the Fed rate cut announcement, many traders will opt to go with the move and also sell, or short, the US dollar.
To place a trade on a market in the MetaTrader trading platform provided by Admiral Markets, simply follow the steps below:
- Open the chart of the market you wish to trade.
- Right-click on the chart.
- Select Trading.
- Select New Order, or press F9 on your keyboard.
- A trading ticket will open for you to input your entry price, stop loss and take profit levels and unit size (volume).

A screenshot of the MetaTrader 5 trading platform provided for by Admiral Markets, showing the US dollar index chart and trading ticket window.
Disclaimer: Charts for financial instruments in this article are for illustrative purposes and does not constitute trading advice or a solicitation to buy or sell any financial instrument provided by Admirals (CFDs, ETFs, Shares). Past performance is not necessarily an indication of future performance.
To learn more on how to use the MetaTrader trading platform provided by Admirals watch the video below:
Why trade the Fed rate decision with Admirals?
- Trade 24 hours a day, five days a week.
- Trade with a well-established, highly regulated company including regulation from the UK's Financial Conduct Authority.
- Access the fastest and most secure trading platforms from MetaTrader on desktop, web or mobile.
- Trade with institutional grade spreads as low as 0.1 pips with Zero.MT4 and connect directly with tier one liquidity providers.
- Access the Admirals MetaTrader Supreme Edition plugin for advanced trading tools such as the Sentiment Trader and Advanced Order functionality completely free!
- Trade on a wide range of asset classes covering Forex, Stock CFDs, Index CFDs, Commodity CFDs and more.
- Benefit from a negative balance protection policy for peace of mind.
If you're feeling inspired to start trading, or this article has provided some extra insight to your existing trading knowledge, you may be pleased to know that Admirals provides the ability to trade with Forex and CFDs on up to 80+ currencies, with the latest market updates and technical analysis provided for FREE! Click the banner below to open your live account today!

Other articles you may find interesting:
- Use MetaTrader Like a Pro With MT4 & MT5 Shortcuts
- How to Trade with MetaTrader WebTrader
- Overview of the Best MT5 Indicators
About Admirals
Admirals is a multi-award winning, globally regulated Forex and CFD broker, offering trading on over 8,000 financial instruments via the world's most popular trading platforms: MetaTrader 4 and MetaTrader 5. Start trading today!
This material does not contain and should not be construed as containing investment advice, investment recommendations, an offer of or solicitation for any transactions in financial instruments. Please note that such trading analysis is not a reliable indicator for any current or future performance, as circumstances may change over time. Before making any investment decisions, you should seek advice from independent financial advisors to ensure you understand the risks.