The Head and Shoulders Pattern
Whilst movements on an asset’s price chart often look totally random, sometimes observant traders will notice similar patterns repeating themselves. These patterns are often used by traders to attempt to predict future price movements and, consequently, form the basis for many a trading strategy.
The “head and shoulders” is one such pattern. In this article, we will take an in-depth look at the head and shoulders pattern, demonstrate how to identify it and provide an example of how to trade it.
| The information in this article is provided for educational purposes only and does not constitute financial advice. Consult a financial advisor before making investment decisions. |
Table of Contents
What Is the Head and Shoulders Pattern?
The head and shoulders pattern is a chart pattern used by proponents of technical analysis to predict a bearish reversal. An inverse head and shoulders pattern is viewed as a bullish reversal pattern.
The pattern is formed by a peak, followed by a second higher peak, followed by a third peak which is roughly the same height as the first. Thus, the first and third peaks form the “shoulders” whilst the second peak is our “head”.
The inverse head and shoulders pattern is essentially the same thing but upside down. Whereas the head and shoulders pattern typically appears after an uptrend and indicates a potential bearish reversal, an inverse head and shoulders pattern typically appears after a downtrend and indicates a potential bullish reversal.
Financial Education with Admirals
Interested in learning more about trading and investing? Why not check out our other educational articles? This constantly growing library includes articles covering a wide variety of topics, including stocks, Forex, Exchange-Traded Funds (ETFs), trading strategies and a whole lot more. Click the banner below to immerse yourself in the financial markets today:

Identifying the Head and Shoulders Pattern
The best way to demonstrate how to identify the head and shoulders pattern is probably just to show an example of what it looks like.
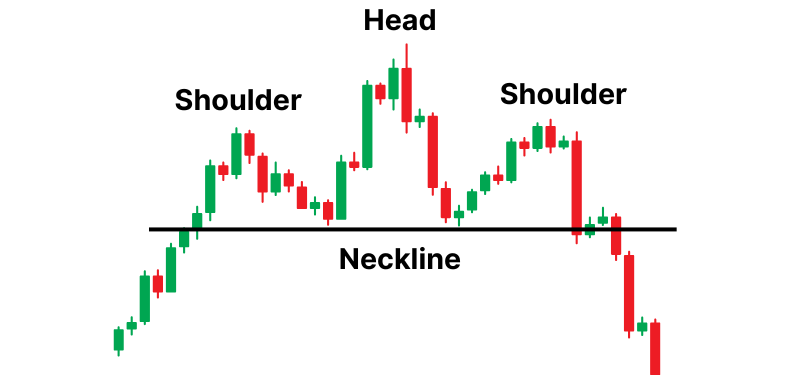
We can highlight three steps involved in identifying the head and shoulders pattern:
- Following an uptrend, the price rises to a peak (our first shoulder) before pulling back to form a “trough”.
- The price rises a second time, surpassing the previous peak to form a higher high (our head). Once again, the price retreats to form a second trough.
- The price rises once more, reaching a peak (shoulder number two) which is around the same level as the first peak. The price then declines again.
As well as the head and shoulders, a line of support linking the two troughs becomes the “neckline” of the pattern. This is an important part of the puzzle. Its significance will become apparent later once we provide an example of how to trade using the head and shoulders pattern.
The Inverse Head and Shoulders Pattern
As already mentioned, the inverse head and shoulders is essentially the same pattern but flipped upside down.
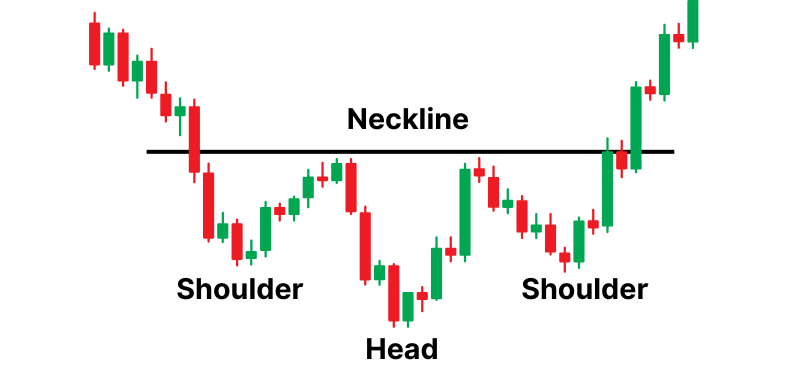
As with the pattern itself, the steps involved in identifying the inverse head and shoulders are pretty much the same but inverted:
- Following a downtrend, the price hits a bottom (the first shoulder) before rising.
- The price falls again, reaching a lower low (the head) than previously before moving upwards once again.
- The price falls a third time, hitting a low that is around the same level as the first low (the second shoulder) before rising.
Here, the neckline of the inverse head and shoulders is formed by the line of resistance of the two peaks of the pattern, as shown in the image. Again, we will see the importance of the neckline in the next section when we examine how to trade both head and shoulders patterns.
How to Trade the Head and Shoulders Pattern
So, now we know what the head and shoulders patterns look like and how we can identify them, how do we trade this pattern?
Both patterns signal a potential reversal. The head and shoulders pattern typically appears at the top of an uptrend and signals a potential reversal to the downside, whilst the inverse head and shoulders typically appear at the bottom of a downtrend and signals the opposite.
Traders should wait until the entire pattern has completed before taking a position rather than trying to anticipate it ahead of time. So, what is the cue to enter the market?
Remember when we said that the neckline was important? Well, this is where it comes into play.
Trade Entry
A commonly used signal to enter the market arrives when the price breaks through the neckline, at which point a trader may choose to enter a short (sell) position in the case of the normal head and shoulders pattern or a long (buy) position in the case of the inverse pattern.
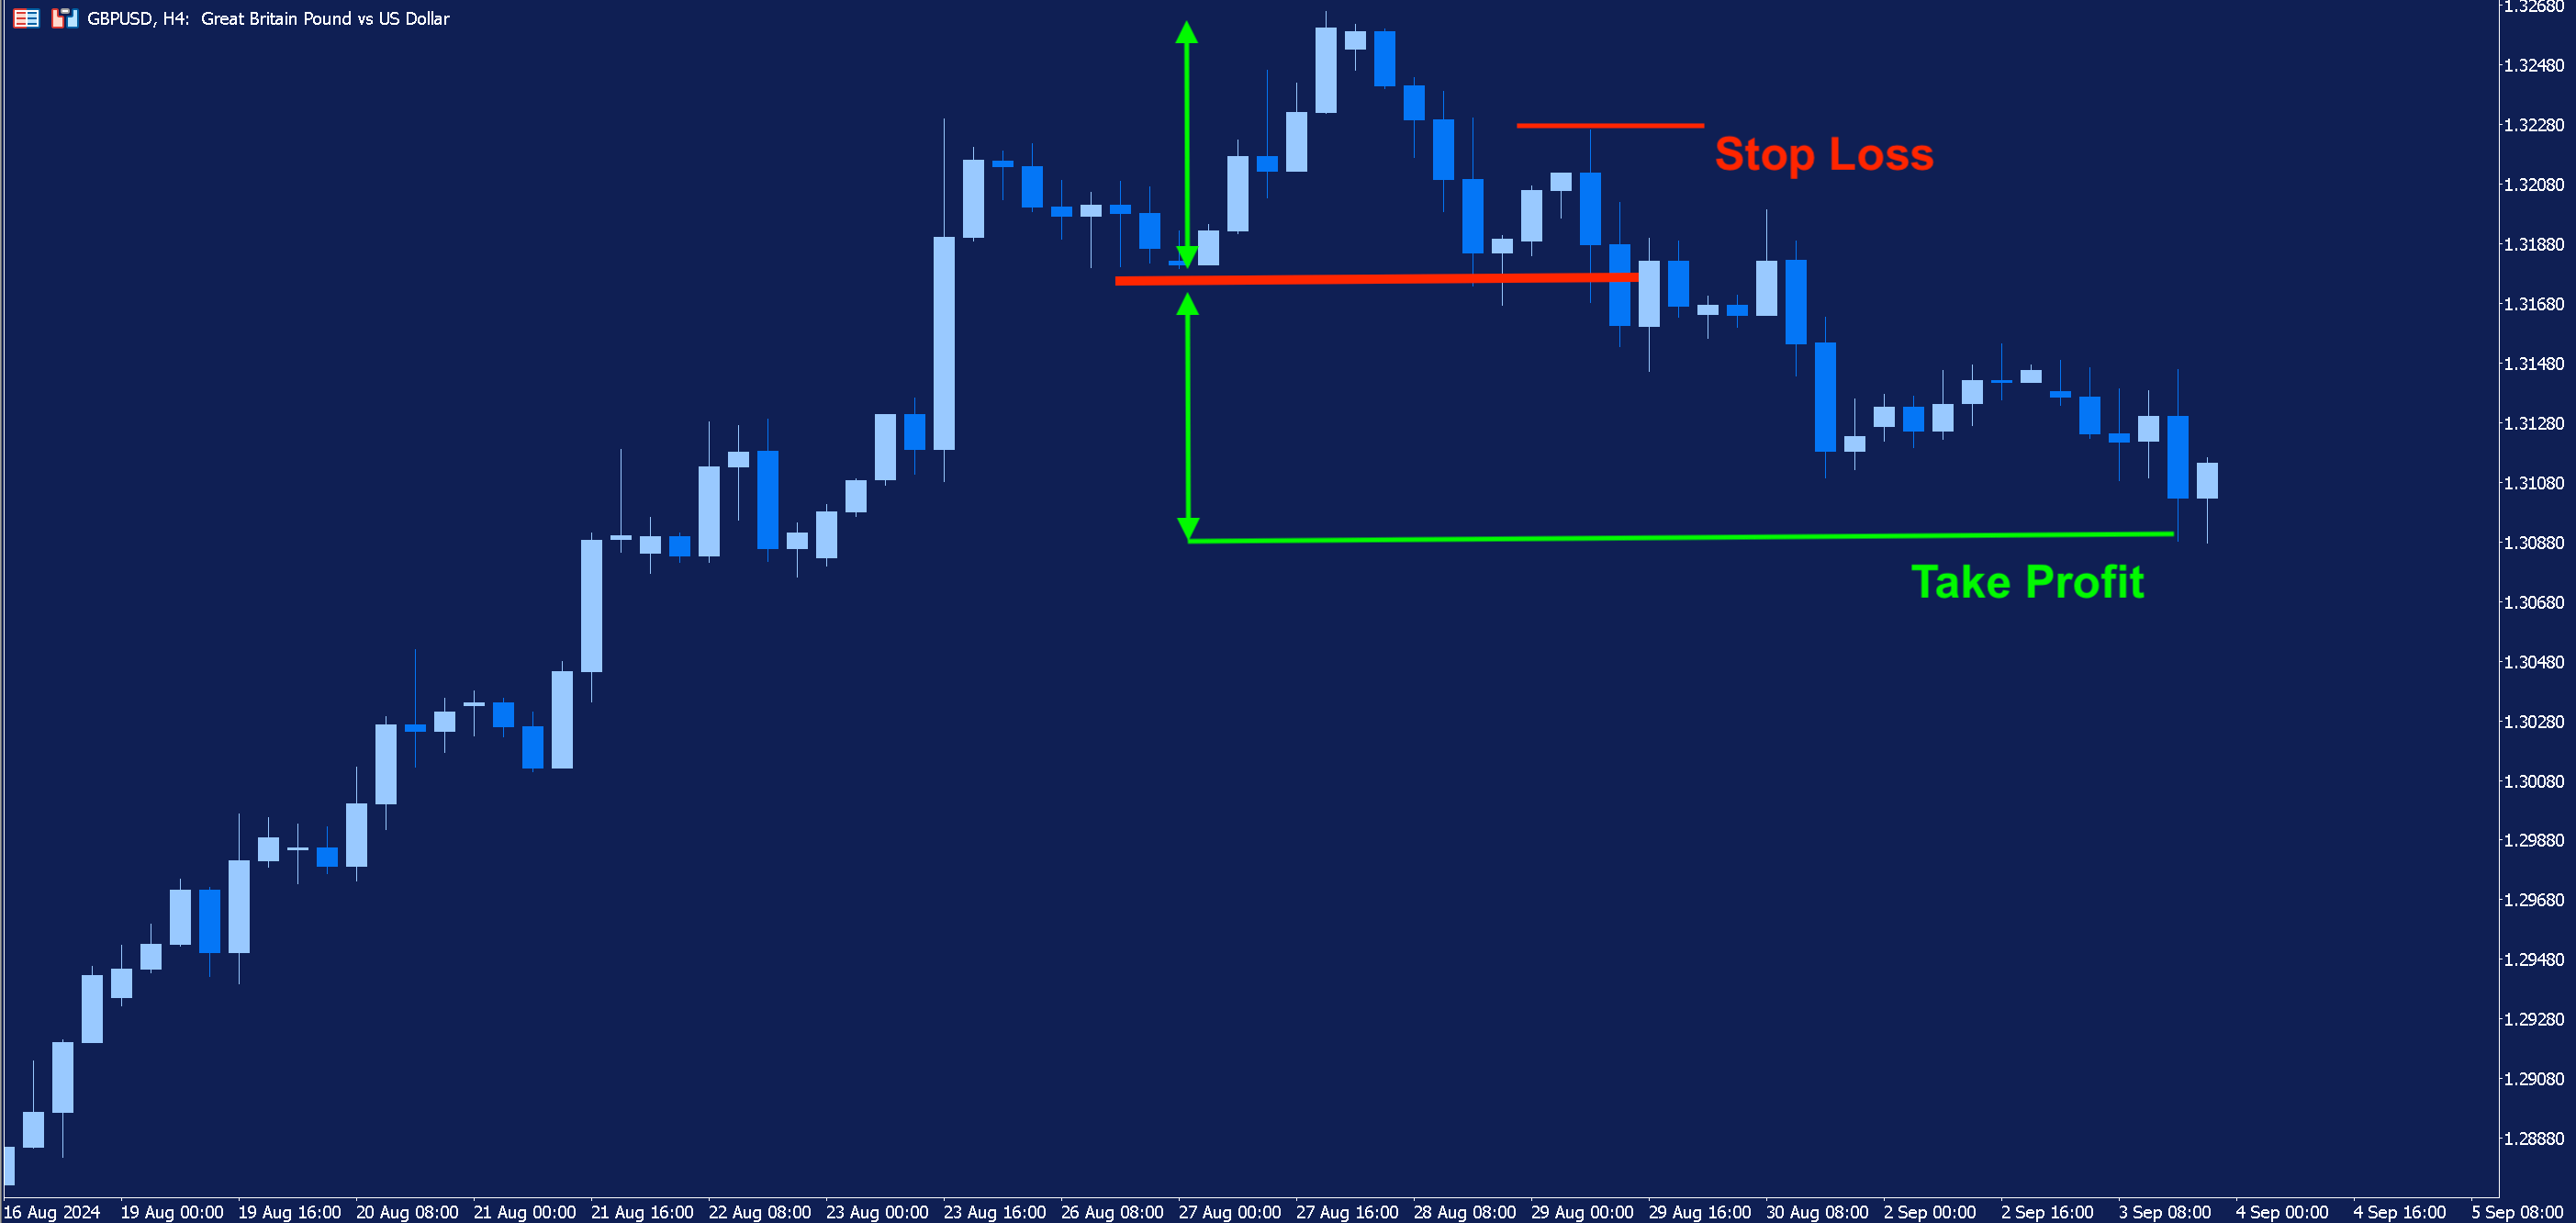
In the image below, we can see that, following an uptrend, a head and shoulders pattern has formed. As the price breaks below the neckline, this could serve as a signal to enter the market.
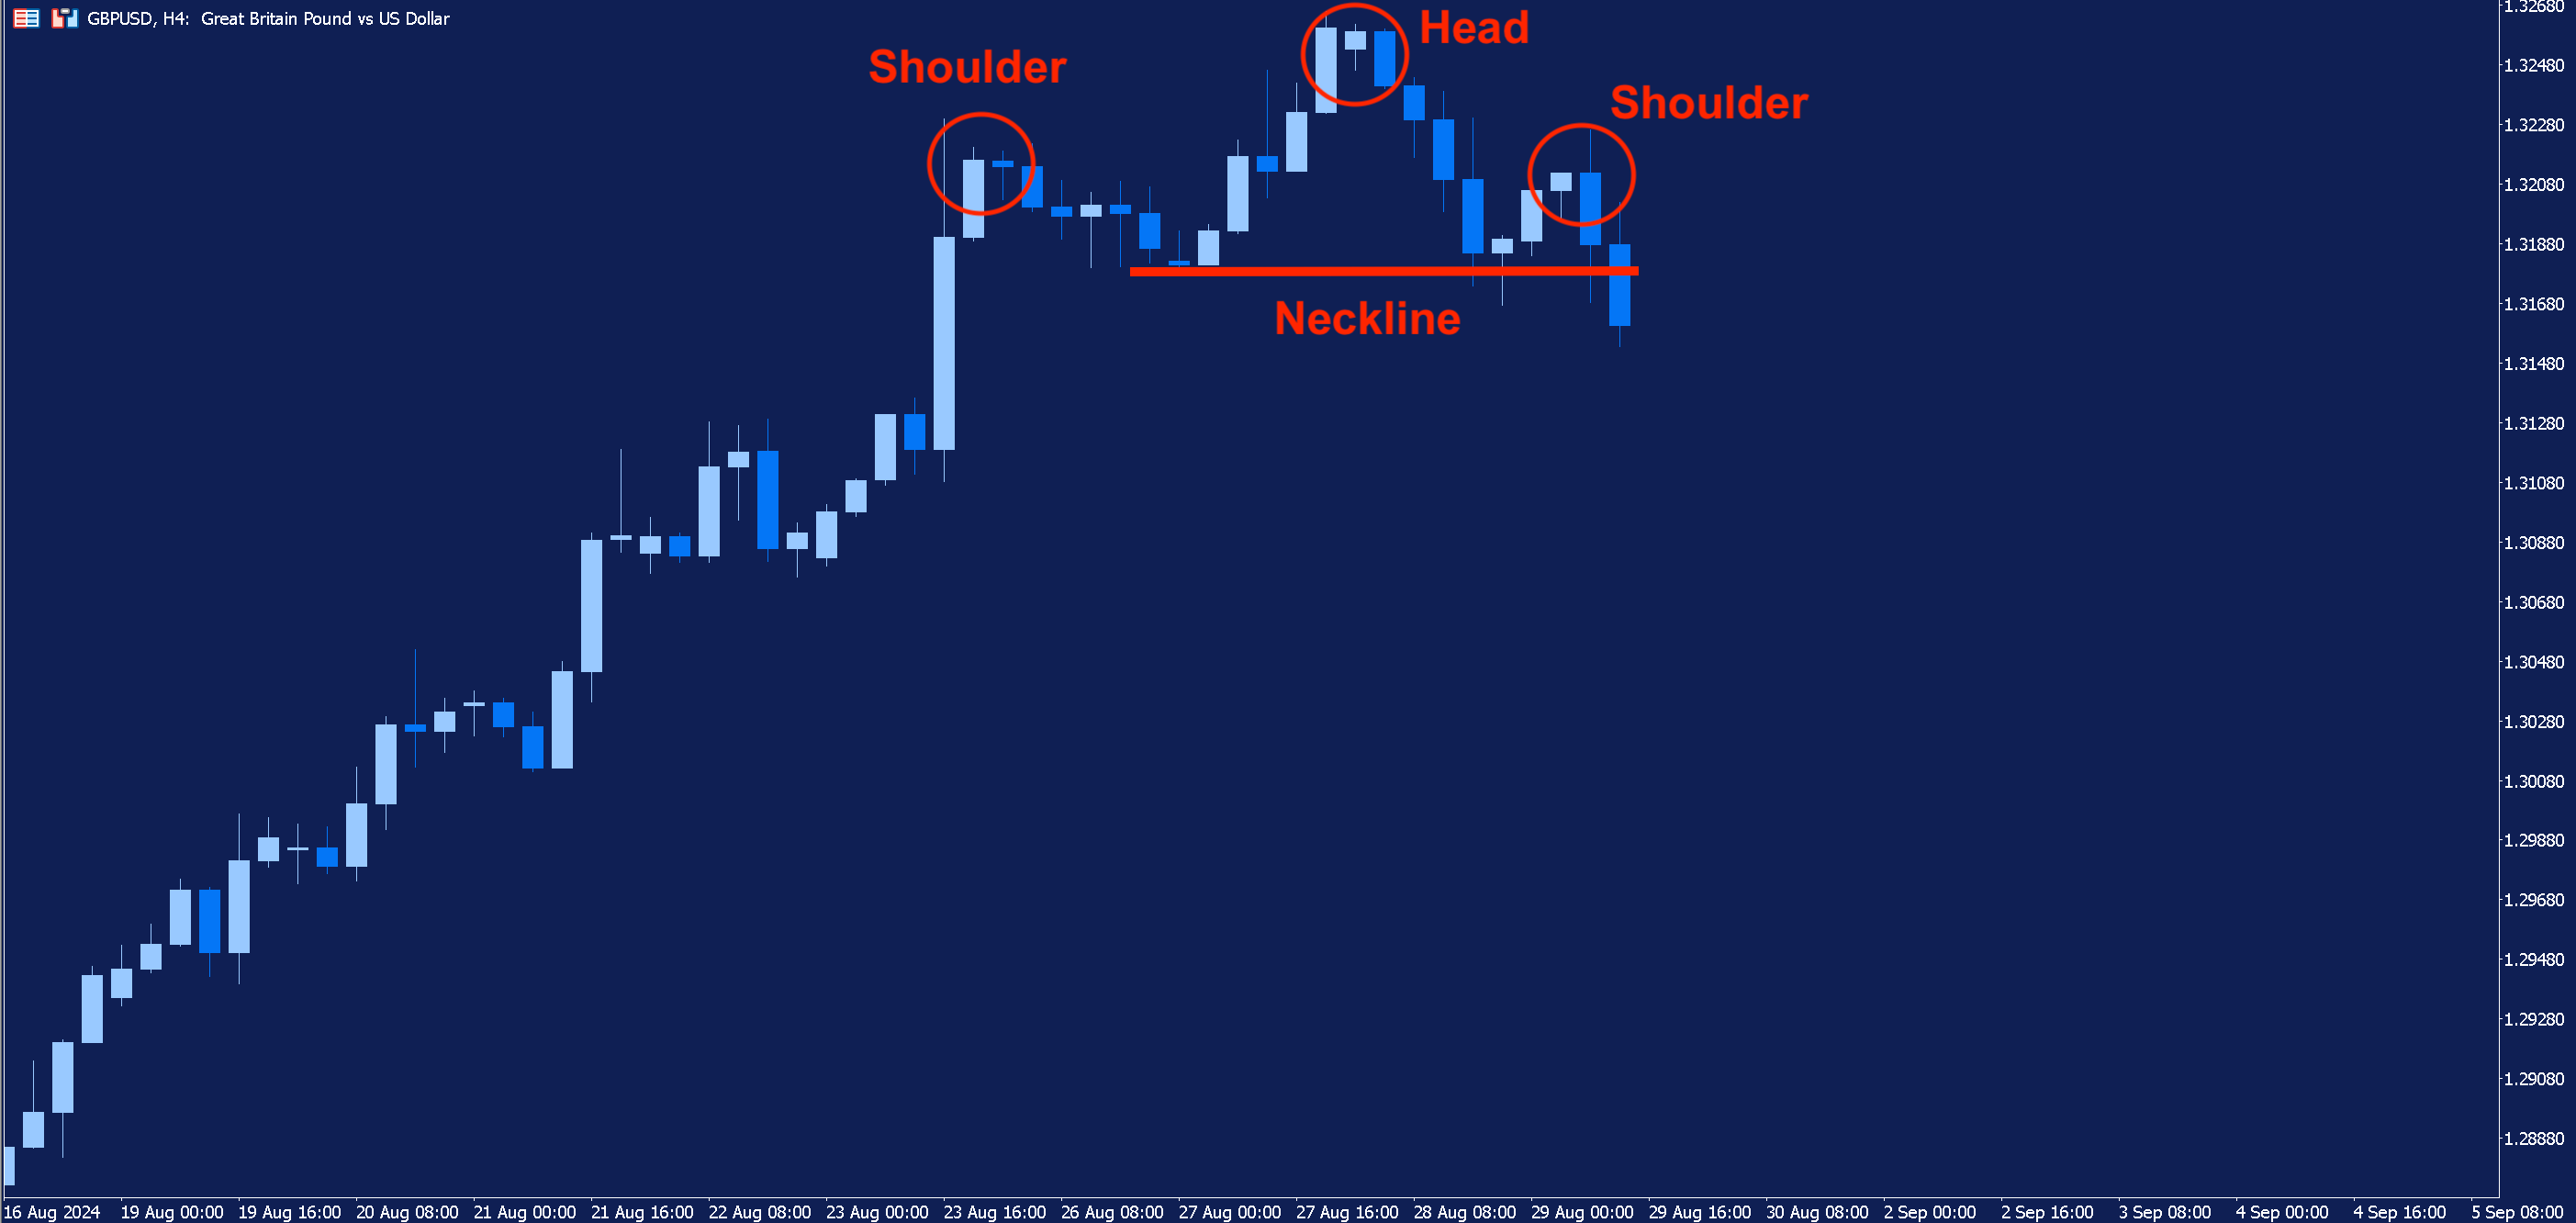
Of course, more cautious traders may choose to wait for further confirmation of the move before initiating a trade. However, this approach may cause the trader to miss the move altogether.
Stop Losses and Profit Targets
Stop Losses and Take Profits play an essential role in any risk management strategy. Where to place these levels is at the discretion of each trader and will largely depend on individual appetite for risk.
In terms of the stop loss, it is common for them to be placed above the right shoulder or the head. Naturally, placing the stop above the head will be accompanied by a much higher level of risk for the trade.
Again, profit targets are subjective depending on the individual trader. However, when trading this pattern, take profit levels are often placed the same distance away from the neckline as the head of the pattern. In other words, traders measure the distance between the neckline and the head and subtract/add this to the neckline to find the appropriate profit target level.
Conclusion
The head and shoulders pattern and the inverse head and shoulders pattern are both interpreted as signals of a potential price reversal. They can appear in all markets, on all time frames and the pattern can provide traders with entry, stop loss and profit target levels.
Once traders have become accustomed to the pattern, it can be easy to spot but bear in mind they won’t always look perfectly like the examples provided in this article. Indeed, as with other chart patterns, sometimes identifying the head and shoulders pattern can be somewhat subjective.
It's important to note that this is not an exact science. Whilst head and shoulders patterns are considered to signal price reversals, that doesn’t mean that a reversal will always materialise.
As with any trading strategy, a head and shoulders strategy will undoubtedly produce false signals. It’s also possible that when reversals do materialise, profit target levels won’t be reached. Consequently, traders may want to consider other conditions for exiting their trade depending on market conditions.
Risk-Free Demo Trading from Admirals
If you’re new to trading the head and shoulders pattern, it’s recommendable to practise on a risk-free demo account before implementing the strategy in the live markets. A risk-free demo account from Admirals allows traders to practise trading in realistic market conditions using virtual currency. Click the banner below to open a demo account:

INFORMATION ABOUT ANALYTICAL MATERIALS:
The given data provides additional information regarding all analysis, estimates, prognosis, forecasts, market reviews, weekly outlooks or other similar assessments or information (hereinafter “Analysis”) published on the websites of Admirals investment firms operating under the Admirals trademark (hereinafter “Admirals”) Before making any investment decisions please pay close attention to the following:
- This is a marketing communication. The content is published for informative purposes only and is in no way to be construed as investment advice or recommendation. It has not been prepared in accordance with legal requirements designed to promote the independence of investment research, and that it is not subject to any prohibition on dealing ahead of the dissemination of investment research.
- Any investment decision is made by each client alone whereas Admirals shall not be responsible for any loss or damage arising from any such decision, whether or not based on the content.
- With view to protecting the interests of our clients and the objectivity of the Analysis, Admirals has established relevant internal procedures for prevention and management of conflicts of interest.
- The Analysis is prepared by an analyst (hereinafter “Author”). The Author Roberto Rivero is a contractor for Admirals. This content is a marketing communication and does not constitute independent financial research.
- Whilst every reasonable effort is taken to ensure that all sources of the content are reliable and that all information is presented, as much as possible, in an understandable, timely, precise and complete manner, Admirals does not guarantee the accuracy or completeness of any information contained within the Analysis.
- Any kind of past or modelled performance of financial instruments indicated within the content should not be construed as an express or implied promise, guarantee or implication by Admirals for any future performance. The value of the financial instrument may both increase and decrease and the preservation of the asset value is not guaranteed.
- Leveraged products (including contracts for difference) are speculative in nature and may result in losses or profit. Before you start trading, please ensure that you fully understand the risks involved.