What do rising US-Iran tensions mean for the oil market?
In the last month, tensions between the U.S and Iran have escalated to a point where six oil tankers and a U.S spy drone have been attacked, with president Trump approving military strikes before abruptly backing down. The price of oil has surged nearly 20% higher in June alone and some analysts believe this volatility is just the beginning.

In this article, we explore the issues surrounding the US-Iran tensions, as well as the possible trading opportunities in the oil market right now. Let's get started!
Why are US-Iran tensions escalating?
Last year the Trump administration withdraw from the landmark 2015 Iran nuclear accord and applied a 'maximum pressure' campaign on Iran through economic sanctions. Not only did they designate Iran's military, the Islamic Revolutionary Guard Corps, a foreign terrorist group but they also cancelled waivers for countries to buy Iranian oil without a U.S penalty.
In retaliation, Iran threatened to also back out of the nuclear accord, as well as prevent oil tankers from passing through the Strait of Hormuz - a very busy supply route for Middle East oil. The situation escalated on 13 June when two oil tankers in the Gulf of Oman exploded. While the U.S allege this was an act of sabotage from Iran, the international community have said they need clearer evidence while the owner of the Japanese tanker provided a different account.
One week after the tanker explosion, Iran shot down a U.S drone that they insist was over Iranian airspace. Trump tweeted 'Iran made a very big mistake'. Shortly after, Trump confirmed he ordered a U.S military attack on Iran only to call it off at the last minute.
While some countries, like China, have continued to purchase Iranian oil it has left a big decline in output. In fact, oil output between Iran and Venezuela has fallen by more than the OPEC production cuts. If OPEC decides to not extend production cuts at their July meeting, the combination of rising US-Iran tensions could cause some wild swings in the oil market.
How to Trade WTI Oil
With Admiral Markets you can trade on two types of oil markets: Brent Crude Oil and West Texas Intermediate Oil (WTI). Traders can speculate on the price of these oil markets by using a product called CFD, or Contract for Difference. Essentially, this enables traders to go long and short on a market, such as oil.
Below is the long-term price chart of WTI Oil CFD:
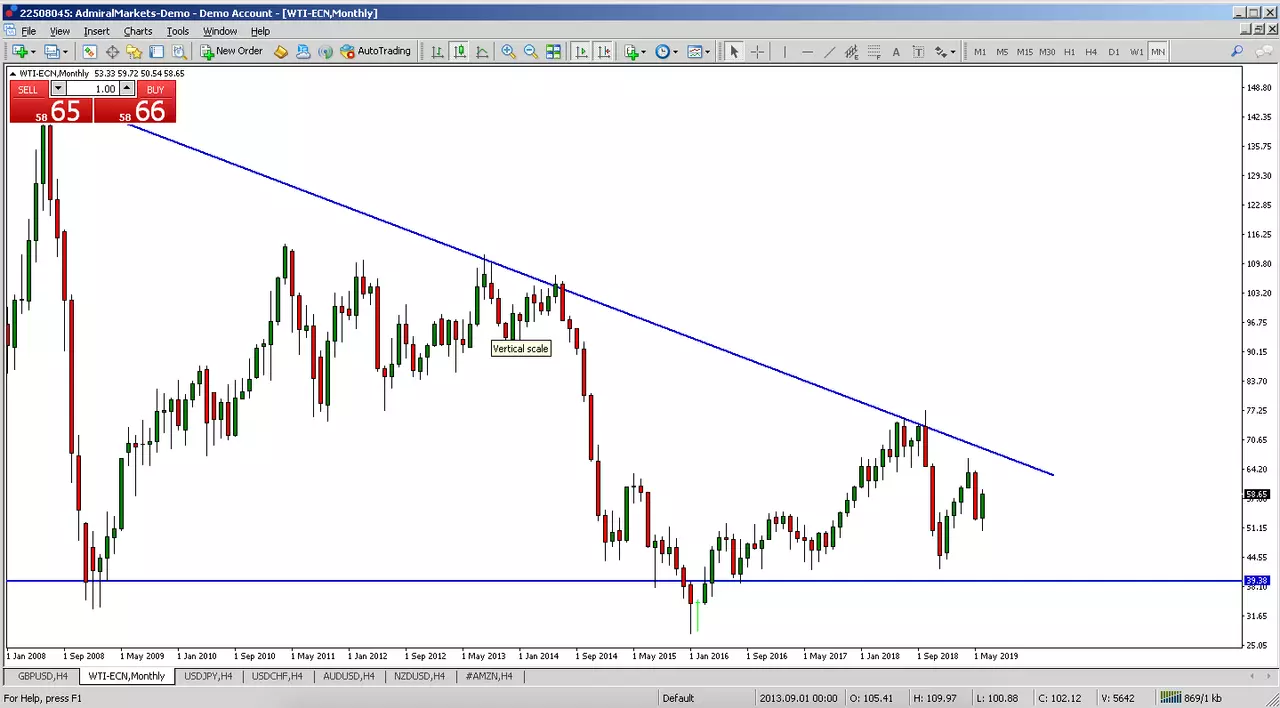
Source: Admiral Markets MetaTrader 4, WTI, Monthly - Data range: from Jan 1, 2008, to June 27, 2019, accessed on June 27, 2019, at 11:01 am BST. - Please note: Past performance is not a reliable indicator of future results.
In the above price chart, the price of WTI Oil has exhibited some wild swings in the market, while creating some long-term trends between the support and resistance lines drawn on in blue. Traders will often use such lines, such as trend lines and horizontal lines, as areas to target their trades as well as areas to initiate trading positions.
Knowing where these longer-term levels are can be useful when trading the lower timeframes to ensure target levels are not outside of these levels which have not broken through before. Of course, at some point in the future, they may break through but until then traders will trade in between these levels using the lower timeframes.
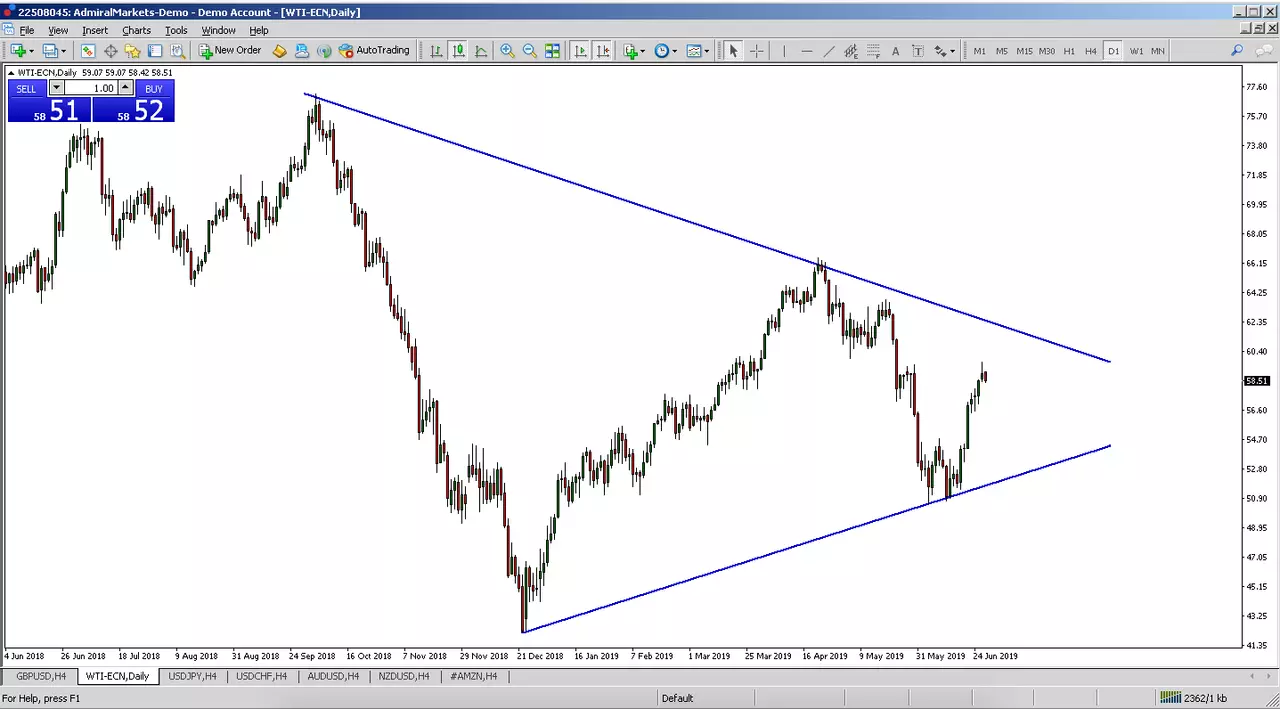
Source: Admiral Markets MetaTrader 4, WTI, Daily - Data range: from Jun 4, 2018, to June 27, 2019, accessed on June 27, 2019, at 11:07 am BST. - Please note: Past performance is not a reliable indicator of future results.
In the above daily chart of the WTI Oil CFD, it is clear to see the market trading in between two diagonal support and resistance lines, creating a wedge formation pattern. Some traders will look for short positions at the top end of the resistance line and long positions at the bottom support level with discretionary stop loss and target levels.
In most cases, traders will look for price action patterns to support their long or short positions at these levels. For example, the most recent bounce off the lower diagonal support line was supported by the presence of a very strong bullish candlestick pattern called a bullish engulfing candle.
This is where one candle's price makes a new daily low and then pushes all the way back up to make a new daily high and closes higher than where it opened. This represents a significant shift from selling to buying and can be seen below in the zoomed in view of the price action at the lower diagonal support line and highlighted in the yellow box.
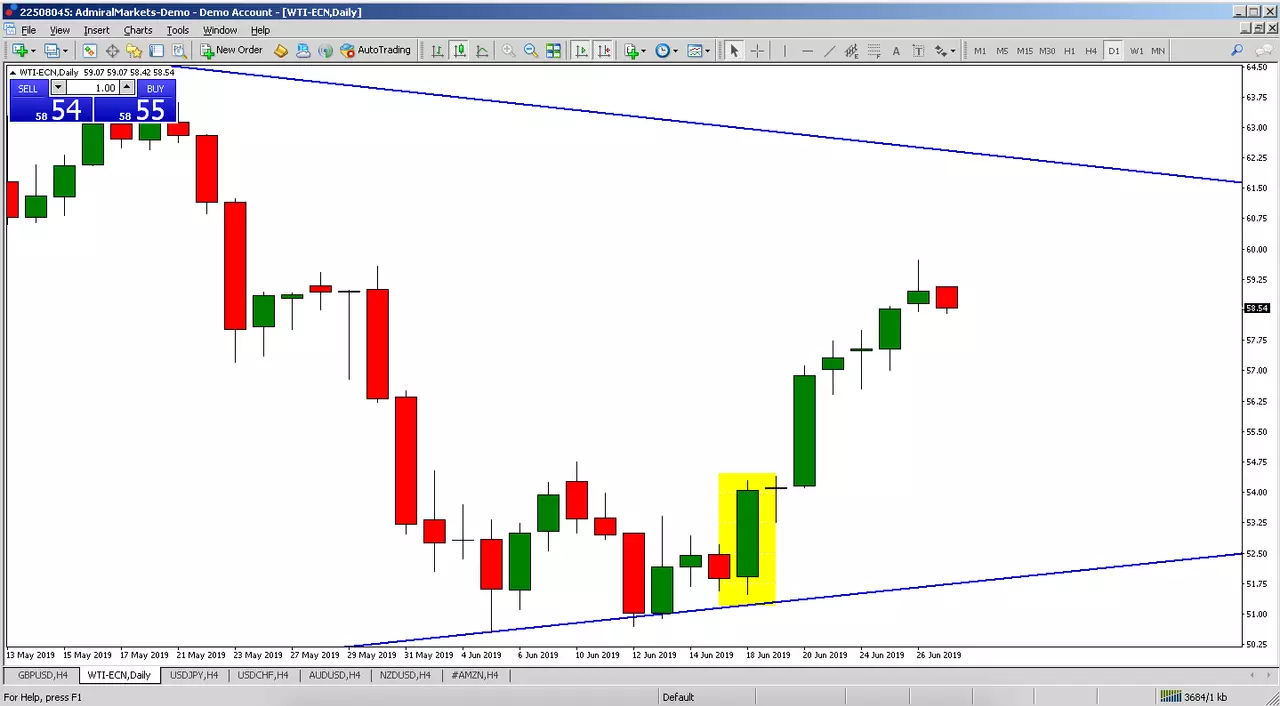
Source: Admiral Markets MetaTrader 4, WTI, Daily - Data range: from May 13, 2019, to June 27, 2019, accessed on June 27, 2019, at 11:15 am BST. - Please note: Past performance is not a reliable indicator of future results.
In this instance, the market did continue to push higher as the bullish engulfing candle pattern suggested. However, a continuation may not always be likely and using stop losses is essential in protecting your trading account by minimising any potential losses.
Conclusion
The oil market is facing huge risks through rising US-Iran tensions and OPEC's upcoming decision. With WTI Crude Oil up nearly 20% in the month of June alone, more volatility is expected - either to the upside or downside. How will you be trading it?
With MetaTrader 5 you can trade on multiple asset classes, as well as access superior charting capabilities, free real-time market data & analysis, the best trading widgets available, and much more! To download MetaTrader 5 now, click the banner below and receive it for FREE!
INFORMATION ABOUT ANALYTICAL MATERIALS:
The given data provides additional information regarding all analysis, estimates, prognosis, forecasts, market reviews, weekly outlooks or other similar assessments or information (hereinafter "Analysis") published on the website of Admiral Markets. Before making any investment decisions please pay close attention to the following:
1.This is a marketing communication. The content is published for informative purposes only and is in no way to be construed as investment advice or recommendation. It has not been prepared in accordance with legal requirements designed to promote the independence of investment research, and that it is not subject to any prohibition on dealing ahead of the dissemination of investment research.
2.Any investment decision is made by each client alone whereas Admiral Markets AS (Admiral Markets) shall not be responsible for any loss or damage arising from any such decision, whether or not based on the content.
3.With view to protecting the interests of our clients and the objectivity of the Analysis, Admiral Markets has established relevant internal procedures for prevention and management of conflicts of interest.
4.The Analysis is prepared by an independent analyst Jitan Solanki, Freelance Contributor (hereinafter "Author") based on personal estimations.
5.Whilst every reasonable effort is taken to ensure that all sources of the content are reliable and that all information is presented, as much as possible, in an understandable, timely, precise and complete manner, Admiral Markets does not guarantee the accuracy or completeness of any information contained within the Analysis.
6.Any kind of past or modeled performance of financial instruments indicated within the content should not be construed as an express or implied promise, guarantee or implication by Admiral Markets for any future performance. The value of the financial instrument may both increase and decrease and the preservation of the asset value is not guaranteed.
7.Leveraged products (including contracts for difference) are speculative in nature and may result in losses or profit. Before you start trading, please ensure that you fully understand the risks involved.