No further progress in US-Chinese trade deal due to Trump impeachment speculation – bullish for Equities?
Economic Events September 30 – October 4, 2019
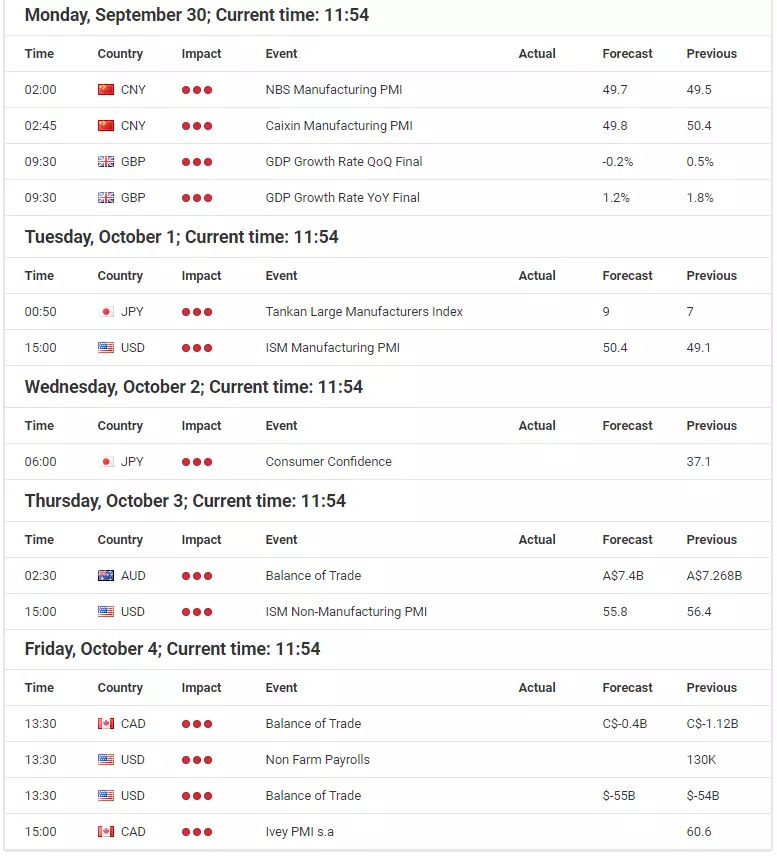
Source: Economic Events Calendar September 30 – October 4, 2019 - Admiral Markets' Forex Calendar
DAX30 CFD
After the latest gains and significant push back above 12,000 points, the DAX30 CFD saw a correction over the last week of trading.
Especially political uncertainties from the US caused some headaches among the bulls after Democrats in the U.S. House of Representatives launched a formal impeachment inquiry into US president Trump, accusing him of seeking foreign help to smear Democratic rival Joe Biden ahead of the 2020's US election.
In addition to fears of (again) rising tensions in the trade dispute between the US and China, it seems as if a rather sooner than later attempt to break to new yearly highs is off the table – at least for the first week of trading into the last quarter of 2019.
This seems especially true if the upcoming economic indication from the US point into a similar direction as the latest economic data especially from Germany and rising recession fears for the biggest economy of the world.
As we have recently seen, such bad data is not capable of increasing hopes of monetary stimulus from the European, respectively in the days to come, US central bank and push higher in equities anymore.
With that said, political uncertainties, ongoing tensions in the trade war between the US and China and bad economic data in the days to come will most likely to continue to weigh on the DAX30 CFD and could result in a test of the psychological relevant level of 12,000 points.
If the German index drops below that level, an initial solid support can be found around 11,800/850 points.
On the other hand: as long as an impeachment of Trump is on the table, China could just lay back and see how things develop here, because, with the chance of impeachment for Trump, China probably sees no incentive to reach a trade deal. That means also that another escalation of the trade dispute is not likely, too and could result in bullish price action respectively at least a bullish drift higher with the target being around 12,500 points.
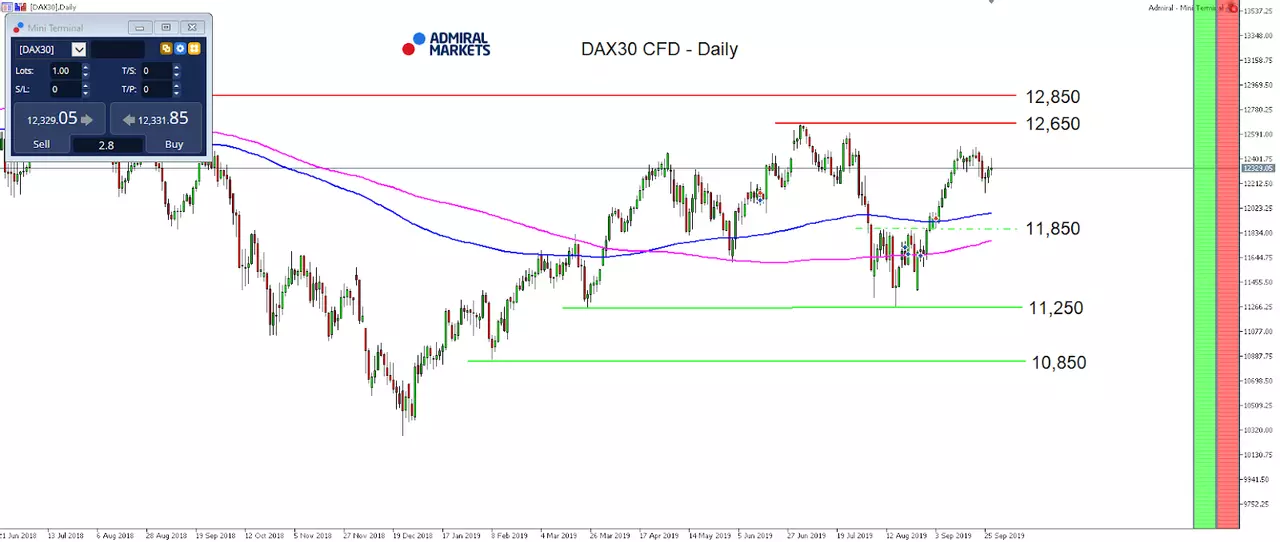
Source: Admiral Markets MT5 with MT5-SE Add-on DAX30 CFD Daily chart (between June 21, 2018, to September 27, 2019). Accessed: September 27, 2019, at 10:00pm GMT - Please note: Past performance is not a reliable indicator of future results, or future performance.
In 2014, the value of the DAX30 CFD increased by 2.65%, in 2015, it increased by 9.56%, in 2016, it increased by 6.87%, in 2017, it increased by 12.51%, in 2018, it fell by 18.26%, meaning that after five years, it was up by 10.5%.
Check out Admiral Markets' most competitive conditions on the DAX30 CFD and Dow Jones CFDs and start trading on the DAX30 CFD with a low 0.8 point spread offering during the main Xetra trading hours!
US Dollar
And again: the fundamental picture in the US Dollar Index Future didn't change over the last week of trading.
In fact, low FX volatility came as a surprise (also to us) given several developments which could have easily triggered bigger market moves.
Especially the shortage in the repo market left the US dollar vulnerable to sharper moves, especially after it became clear that the Fed saw heavier demand for their provided liquidity as expected.
Probably, this US dollar shortage is the current reason for the US dollar performance, especially against the Euro and once the repo markets normalises (if it does…), the Greenback could see some heavier selling pressure.
Here, the main reason could be found in our opinion in hints from Fed chairman Powell at the last Fed rate decision when he said that the Fed may resume organic balance sheet growth earlier than thought, bringing QE4 back into the monetary game.
If in the days to come upcoming US economic data disappoints now, resulting in market participants seeing with a majority for a rate cut by 50 basis point by year end (according to the Fed Watch Tool we are currently between 25 – 30%), the US dollar could see heavier selling pressure, bringing chances of an attack at the lower end of the range around 95.00 points on the table.
Still, technically the USD Index Future stays neutral between 95 and 98:
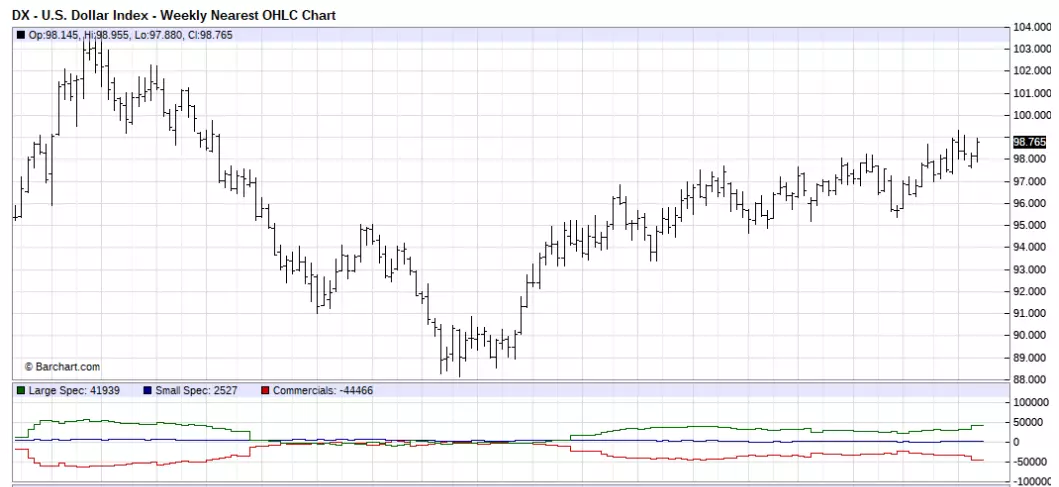
Source: Barchart - U.S Dollar Index - Weekly Nearest OHLC Chart (between May 2016 to September 2019). Accessed: September 27, 2019, at 10:00pm GMT
Don't forget to register for the weekly "Trading Spotlight" webinar with presenters including Jens Klatt, every Monday, Wednesday and Friday at 3pm London time! It's your opportunity to follow Jens and others as they explore the weekly market outlook in detail, so don't miss out!
Euro
The Euro finds itself with a clear bearish touch after the last week of trading. Euro weakness was initiated already on Monday by very weak German economic data (German Manufacturing PMIs e.g. saw their steepest contraction in factory activity since the global financial crisis in mid-2009, as output went down at the sharpest pace since July 2012 and new business declined at the quickest pace in more than a decade, amid lower foreign demand) and fuelling fears of a near-term recession in the biggest economy in Europe.
While the Euro stabilised till Wednesday, into the weekly close a push down to the current yearly lows around 1.0920 followed.
One driver could surely be found in the US dollar shortage, discussed in the USD paragraph above.
In addition to that, rising fears of a starting trade dispute between the US and the Eurozone and also ECB members Lautenschlager's exit from the ECB board (note: Lautenschlager is a known hawk), making future discussion of further easing less complicated for incoming ECB president Lagarde, triggered Euro weakness.
Should we see a sustainable push to new yearly lows below 1.0900, further losses down to 1.0750 becomes a serious option.
Still, bearish momentum could be dampened if upcoming US economic data disappoints in the days to come which could trigger selling pressure in the US dollar and which could stabilise the Euro against the US dollar:
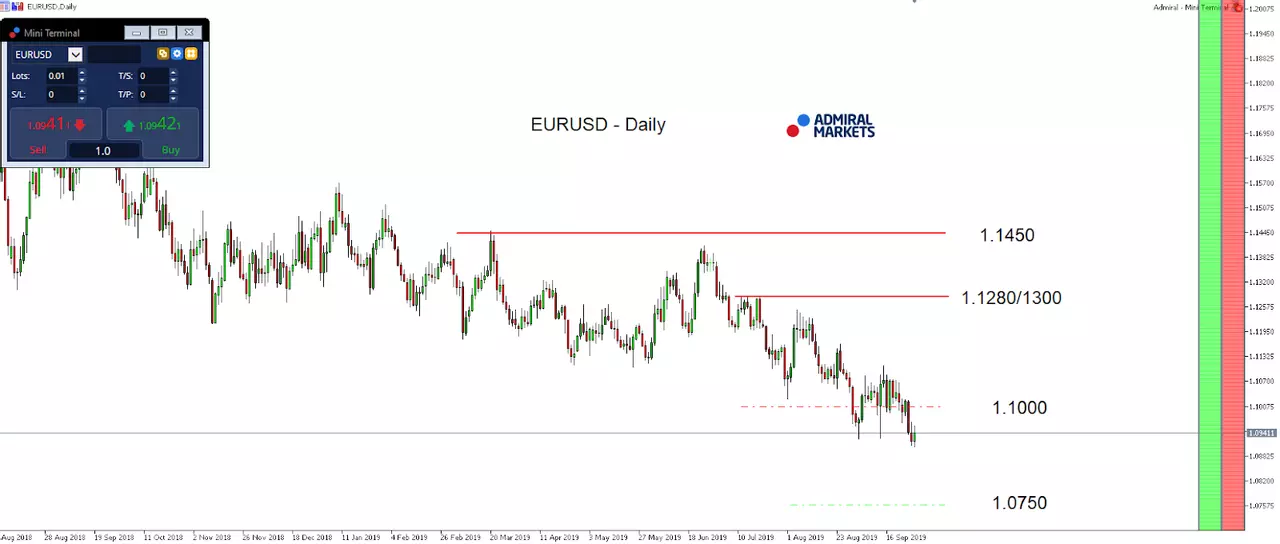
Source: Admiral Markets MT5 with MT5-SE Add-on EUR/USD Daily chart (between July 16, 2018, to September 27, 2019). Accessed: September 27, 2019, at 10:00pm GMT - Please note: Past performance is not a reliable indicator of future results, or future performance.
In 2014, the value of the EUR/USD fell by 11.9%, in 2015, it fell by 10.2%, in 2016, it fell by 3.2%, in 2017, it increased by 13.92%, 2018, it fell by 4.4%, meaning that after five years, it was down by 16.5%.
JPY
As mentioned in our last weekly market outlook, the latest push up to 108.50/109.00 in the USD/JPY was mainly driven by the speculation that the BoJ could consider cutting rates into deeper negative territory at the September meeting.
While BoJ governor Kuroda pointed to continuing oversea economic slowdown which leaves further monetary stimulus on the table and the BoJ judging whether such an easing step is needed at the October meeting, the overall speculation was turned down.
That said, the corrective move down to 106.80/107.00 over the last week of trading wasn't a big surprise in our opinion and was carried by rising Eurozone recession fears and political uncertainties resulting out of Democrats in the U.S. House of Representatives launching a formal impeachment inquiry into US president Trump.
While especially such uncertainties from the US political front and also in regards to the trade dispute between the US and China could initiate a next wave of selling, pushing the USD/JPY below 105.80 and trigger further selling, quickly activating the region around 105.00 again, in addition to that the packed economic docket will be in focus of market participants in the days to come.
If the upcoming US economic data disappoints, selling pressure on the US dollar should be expected to persist and leaves the advantage in the USD/JPY near-term on the short-side, making a sustainable push back above 108.50/109.00 unlikely:
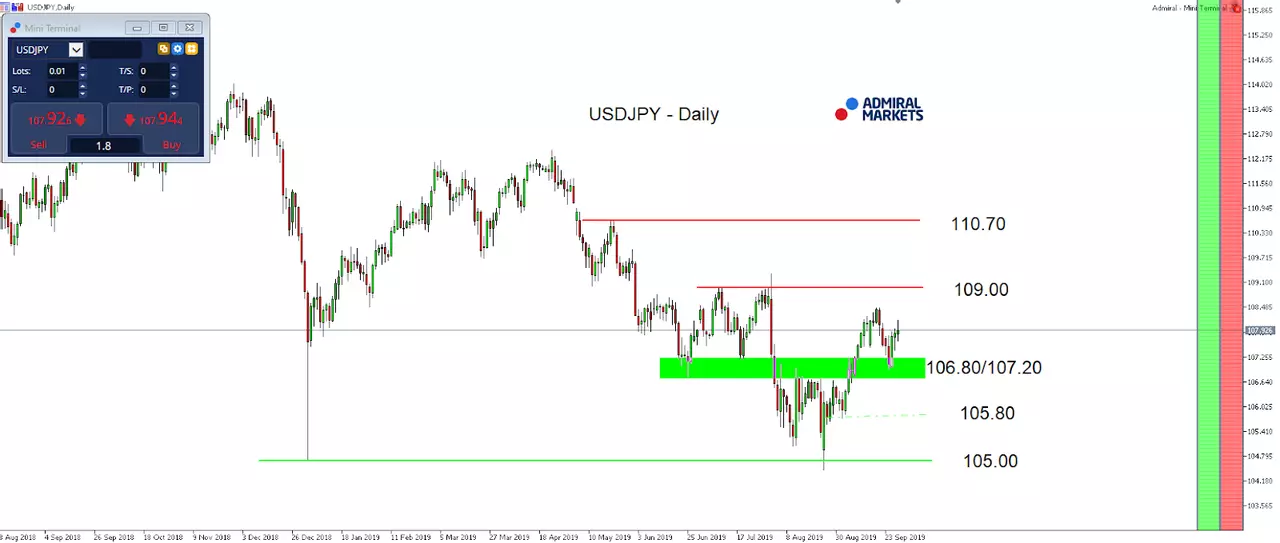
Source: Admiral Markets MT5 with MT5-SE Add-on USD/JPY Daily chart (between August 13, 2018, to September 26, 2019). Accessed: September 26, 2019, at 10:00pm GMT - Please note: Past performance is not a reliable indicator of future results, or future performance.
In 2014, the value of the USD/JPY increased by 13.7%, in 2015, it increased by 0.5%, in 2016, it fell by 2.8%, in 2017, it fell by 3.6%, in 2018, it fell by 2.7%, meaning that after five years, it was up by 4.1%.
Gold
In our last weekly market outlook for Gold we pointed out that despite the short-term drop below 1,500 USD, […]our mid-term bullish outlook manifested.[…]
And in fact, in the days to come another stint up to the current yearly highs around 1,555 USD and above is a serious option given several facts.
First, tensions between the US and China in regards to their trade dispute remain. While the situation seemed to "relax" over the last week, the sharper push back above 1,500 USD after a Chinese delegation has cancelled its farm visit to Montana on the 20th of September has shown, how fragile the current situation is seen among market participants and any new hint to rising tensions between the two biggest two economies in the world could result in speculations that trade talks are about to fall apart with no deal being found again quickly.
Second, there is now rising political uncertainties resulting out of Democrats in the U.S. House of Representatives launching a formal impeachment inquiry into US president Trump.
Third, we see chances risk-off-mode resulting out of rising recession fears especially from Europe's biggest economy, Germany, which could trigger further bullish momentum in the yellow metal.
And fourth, we have a quite packed US economic agenda in the days to come. If these data sets disappoint, greater demand for Gold should be expected and an attack at the current yearly highs seems a very likely option, at least as long as we trade above 1,480 USD. Above, we still see our mid-term target around 1,650/700 USD being active.
On the other hand: surprisingly strong US data could result in a short-term stint on the downside and drop below 1,480 USD.
But we wouldn't consider such a move to be a big deal, instead see a potential mid-term long trigger around 1,440/450 USD:
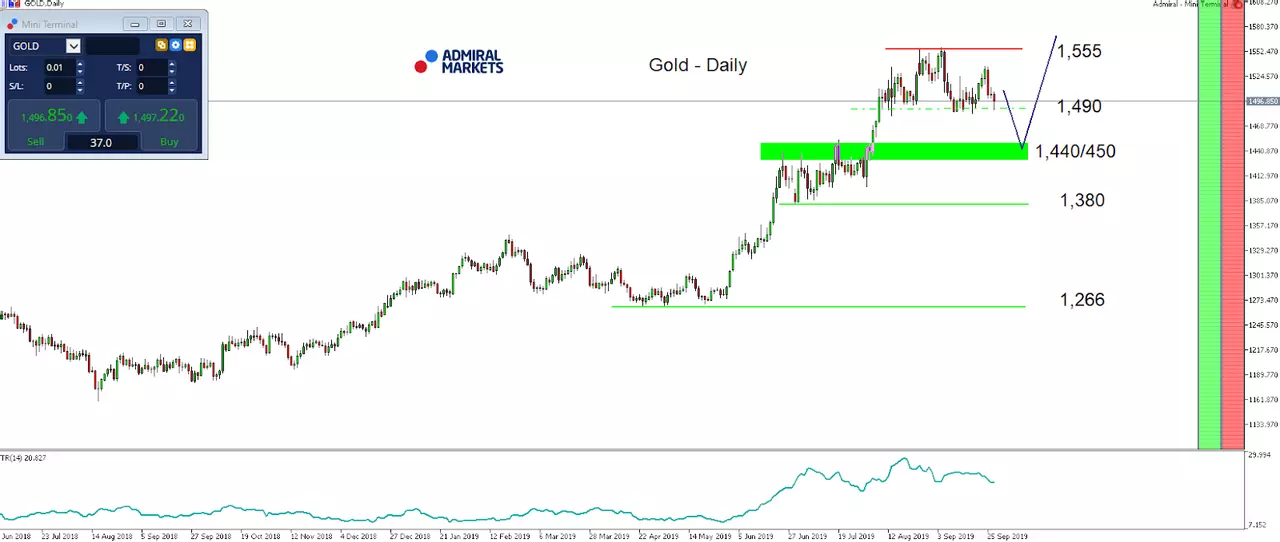
Source: Admiral Markets MT5 with MT5-SE Add-on Gold Daily chart (between June 21, 2018, to September 27, 2019). Accessed: September 27, 2019, at 10:00pm GMT - Please note: Past performance is not a reliable indicator of future results, or future performance.
In 2014, the value of Gold fell by 1.7%, in 2015, it fell by 10.4%, in 2016, it increased by 8.1%, in 2017, it increased by 13.1%, in 2018, it fell by 1.6%, meaning that after five years, it was up by 6.4%.
Discover the world's #1 multi-asset platform
Admiral Markets offers professional traders the ability to trade with a custom, upgraded version of MetaTrader 5, allowing you to experience trading at a significantly higher, more rewarding level. Experience benefits such as the addition of the Market Heat Map, so you can compare various currency pairs to see which ones might be lucrative investments, access real-time trading data, and so much more. Click the banner below to start your FREE download of MT5 Supreme Edition!

Disclaimer: The given data provides additional information regarding all analysis, estimates, prognosis, forecasts or other similar assessments or information (hereinafter "Analysis") published on the website of Admiral Markets. Before making any investment decisions please pay close attention to the following:
- This is a marketing communication. The analysis is published for informative purposes only and are in no way to be construed as investment advice or recommendation. It has not been prepared in accordance with legal requirements designed to promote the independence of investment research, and that it is not subject to any prohibition on dealing ahead of the dissemination of investment research.
- Any investment decision is made by each client alone whereas Admiral Markets shall not be responsible for any loss or damage arising from any such decision, whether or not based on the Analysis.
- Each of the Analysis is prepared by an independent analyst (Jens Klatt, Professional Trader and Analyst, hereinafter "Author") based on the Author's personal estimations.
- To ensure that the interests of the clients would be protected and objectivity of the Analysis would not be damaged Admiral Markets has established relevant internal procedures for prevention and management of conflicts of interest.
- Whilst every reasonable effort is taken to ensure that all sources of the Analysis are reliable and that all information is presented, as much as possible, in an understandable, timely, precise and complete manner, Admiral Markets does not guarantee the accuracy or completeness of any information contained within the Analysis. The presented figures refer that refer to any past performance is not a reliable indicator of future results.
- The contents of the Analysis should not be construed as an express or implied promise, guarantee or implication by Admiral Markets that the client shall profit from the strategies therein or that losses in connection therewith may or shall be limited.
- Any kind of previous or modeled performance of financial instruments indicated within the Publication should not be construed as an express or implied promise, guarantee or implication by Admiral Markets for any future performance. The value of the financial instrument may both increase and decrease and the preservation of the asset value is not guaranteed.
- The projections included in the Analysis may be subject to additional fees, taxes or other charges, depending on the subject of the Publication. The price list applicable to the services provided by Admiral Markets is publicly available from the website of Admiral Markets.
- Leveraged products (including contracts for difference) are speculative in nature and may result in losses or profit. Before you start trading, you should make sure that you understand all the risks.