How to Buy Shares for Beginners
To many, investing in the stock market may seem like an activity which is reserved for only for a privileged few. However, these days, investing in stocks is easily accessible for most people with an internet connection.
In this article, we will provide a step by step guide of how to buy shares for beginners, including what to consider before investing in the stock market, how to choose a stock broker and much more!

Table of Contents
What to Consider Before Investing in the Stock Market
Before you concern yourself with how to buy shares or how to find stocks to invest in, there are several important things to consider before you start investing. So, what do you need to consider before investing in the stock market?
There is also an additional, and very important, factor to consider before you can start buying shares, which we will look at in the next section.
Choosing a Stock Broker
In order to start investing in stocks, you will need to choose a stock broker and open an investment account. A broker acts as an intermediatory between investors and the stock market, facilitating the buying, selling and holding of shares.
When it comes to choosing a stock broker, there is an enormous amount of options to choose from and it is important that you take your time and pick the right one for you. Here is a list of things to consider - but, bear in mind, it is by no means exhaustive.
With an Invest.MT5 account from Admirals, you can buy shares in more than 4,300 listed companies from around the world. Benefits of investing with Admirals include:
- Open an account with a minimum deposit of just €1
- Trading fees start at just $0.02 per share with a minimum transaction fee of $1 for US shares
- No account maintenance fees
- The ability to buy fractional shares on 700 of the world’s most exciting companies
In order to start buying shares whilst enjoying all these benefits, and more, click the banner below to register for an account today:

How to Find Stocks to Invest in
Once you have answers to these questions, it will narrow the field and help you find stocks to invest in. When you have some prospects in mind, make sure you research the companies and their fundamentals thoroughly before buying shares.
Another investment tip to consider when looking for stocks to invest in is to avoid buying shares in a company simply because everyone else is doing it. Always be sure to do your own research to evaluate whether an investment is right for you and your investment goals, rather than just following the crowd.
To find out more about how to find stocks to invest in, you might want to check out our other, more extensive, article on the subject: ‘How to Pick Stocks’.
How to Buy Shares for Beginners in 4 Steps
Now we have an idea in our heads of what you need to consider before investing in the stock market and how to find stocks to invest in, let’s look at how to buy shares for beginners.
In this section, we will provide a step-by-step guide of how to buy stocks using an Invest.MT5 account from Admirals. Simply follow these 4 steps in order to start investing in stocks:
- Open an Invest.MT5 account with Admirals and log in to the Dashboard
- Click ‘Invest’ next to your investing account in the Dashboard to open our Native Trading portal
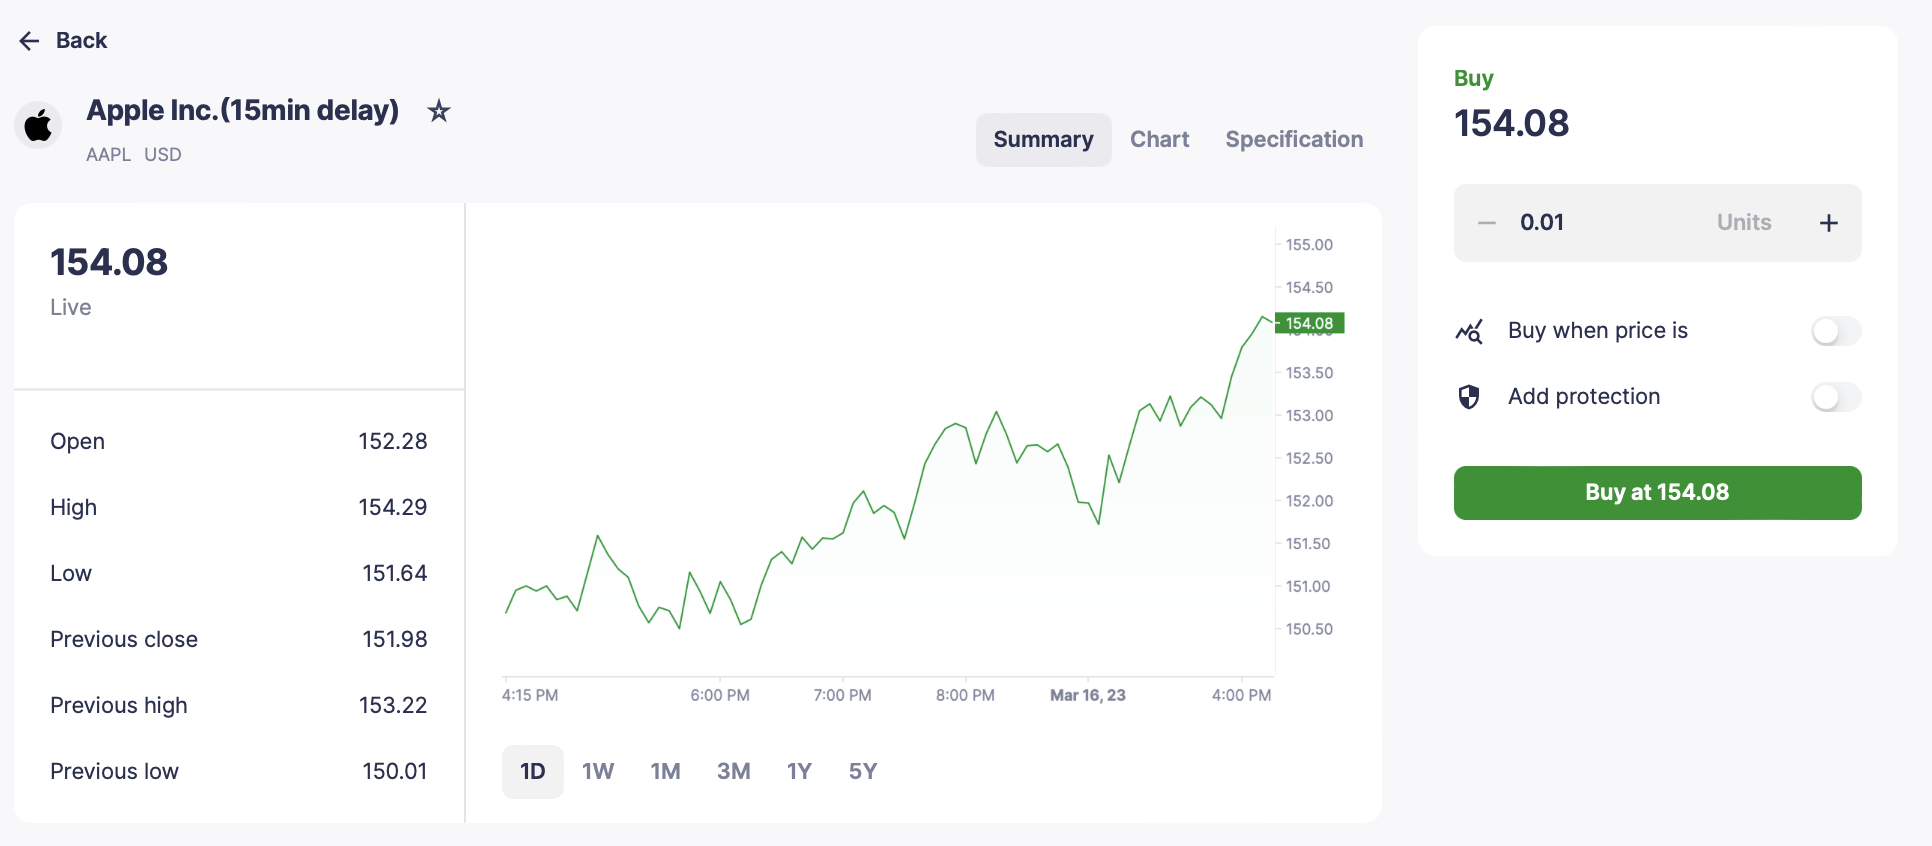
- Search for and click on the stock you wish to purchase
- Enter the number of shares you want to buy and send your order to the market!
Advantages and Disadvantages of Shares
Now that we know how to buy stocks, it is worth taking a look at the advantages and disadvantages of shares as an investment.
Advantages of Buying Shares
- Investing in stocks allows you to potentially benefit from a growing economy
- A well-diversified portfolio of stocks can be a good way of beating inflation over the long-term
- Allows you to take advantage of a successful business in order to grow your wealth.
- With technological advances, investing in stocks is very accessible these days
- Most shares come with voting rights, meaning that shareholders can have their say on how the company is run
Disadvantages of Buying Shares
- As with all investments, investing in stocks comes with the risk of losing your capital. Stocks in particular are considered to be higher risk than other investments such as bonds
- Picking the right stocks is not always easy. A company which looks successful today may not be so in ten years’ time
- It can take a lot of time and effort to research different stocks and their future prospects, particularly if this is not a subject with which you are familiar
- Investing in stocks can take its toll emotionally. Share prices fluctuate on a daily basis, and it is not uncommon for stocks to fall in price, particularly in the short-term. Therefore, investors considering buying shares need to be able to cope with market volatility and not feel compelled to sell low out of fear.
Different Ways of Investing in Stocks for Beginners
As we have seen, buying stocks is not without its drawbacks and, therefore, investing in stocks might not be suitable for everybody. But is there a way of investing in the stock market for beginners without choosing shares in individual companies?
The answer is yes. In addition to, or instead of, investing in individual stocks, investors can buy shares in index funds. Index funds track an underlying stock index by pooling investor money to buy shares in all the companies within the index.
For example, an index fund which tracks the S&P 500 will use investor money to buy shares in all the companies that make up the S&P 500.
Therefore, index funds allow investors to gain exposure to a number of top companies through a single investment, which is an effective way of reducing risk. This approach is likely to appeal particularly to beginner investors, who are looking to benefit from the potential growth of the wider economy rather than buying shares in individual companies.
Furthermore, over the long-term, investments in index funds can be very rewarding thanks to the effect of compounding returns. Compounding refers to effect which takes place when returns generated by an investment are reinvested into the original asset to generate further returns in the future.
Practise on a Risk-Free Demo Account
If you want to start investing in stocks but want to practise first, a risk-free demo account is the perfect place to do so! With a demo trading account you can practise investing in real-market conditions with virtual currency, allowing you to perfect your technique before risking your capital on the live markets! Click the banner below to open your free demo account today:

Investing in Stocks FAQ
How old do you have to be to buy stocks?
In the UK, US and most other countries, you must be at least 18 years old in order to open an investing account and start buying shares.
How much money do you need to start investing?
These days, many brokerages have low minimum deposits and low minimum investment amounts, meaning that you don’t need a vast amount of money to start investing.
For example, with the Invest.MT5 account from Admirals, you can start buying fractional shares in some of the world’s largest companies with as little as €1!
About Admirals
Admirals is a multi-award winning, globally regulated Forex and CFD broker, offering trading on over 8,000 financial instruments via the best Forex trading platforms: MetaTrader 4 and MetaTrader 5. Start trading today!
This material does not contain and should not be construed as containing investment advice, investment recommendations, an offer of or solicitation for any transactions in financial instruments. Please note that such trading analysis is not a reliable indicator for any current or future performance, as circumstances may change over time. Before making any investment decisions, you should seek advice from independent financial advisors to ensure you understand the risks.