How to Prepare For a Recession
Although they can be unsettling, recessions are a normal part of the economic cycle. That’s why it makes sense for investors to plan ahead and factor economic downturns into their wider investing plan. Whilst there is no guaranteed way to make your portfolio recession proof, there are ways to prepare yourself for a potential downturn and certain approaches investors can take to the markets during such periods.
In this article, we will look at what a recession is and how it can affect the stock market. We will also examine possible steps of how to prepare for a recession and highlight ways in which investors typically invest during them.
The information in this article is provided for educational purposes only and does not constitute financial advice. Consult a financial advisor before making investment decisions.
Table of Contents
Key Takeaways
- •A recession is a significant decline in economic activity, which is often characterised by two consecutive quarters of negative economic growth.
- •Although stock markets often decline during a recession, the timing, severity and recovery periods of such downturns can vary significantly.
- •Building an emergency fund and reviewing an existing investing portfolio are two steps which might be considered in preparation for a downturn.
- •There are a number of approaches investors can take to investing in a recession, including shifting their portfolio towards defensive assets.
What Is a Recession?
The National Bureau of Economic Research in the US defines a recession as:
A significant decline in economic activity spread across the economy, lasting more than a few months, normally visible in real GDP, real income, employment, industrial production, and wholesale-retail sales.
There is no single global standard as to what qualifies as a recession. However, a traditional rule of thumb amongst many analysts and economists is that a recession is characterised by two consecutive quarters of negative economic growth.
What Happens in the Stock Market in a Recession?
The stock market is not technically an indicator of economic health. Instead, it depicts investor sentiment about the future earnings of companies, something which can be influenced by a variety of factors, including expectations about the economy.
When the economy is growing strongly, investors typically expect companies to earn more, which can result in stock markets rising. Conversely, when the economy contracts, companies are typically expected to earn less, so stock prices may fall.
This means that there tends to be an overlap between a recession and a stock market downturn. Typically, cyclical stocks are often the worst affected, whilst defensive stocks may be better positioned to weather the storm.
Importantly, because stock prices reflect expected future earnings, markets often start falling before a recession officially begins and may start recovering before it officially ends.
Examples of the Stock Market During Recession
It's important to note that every recession is different; even the same downturn will affect different markets in different ways.
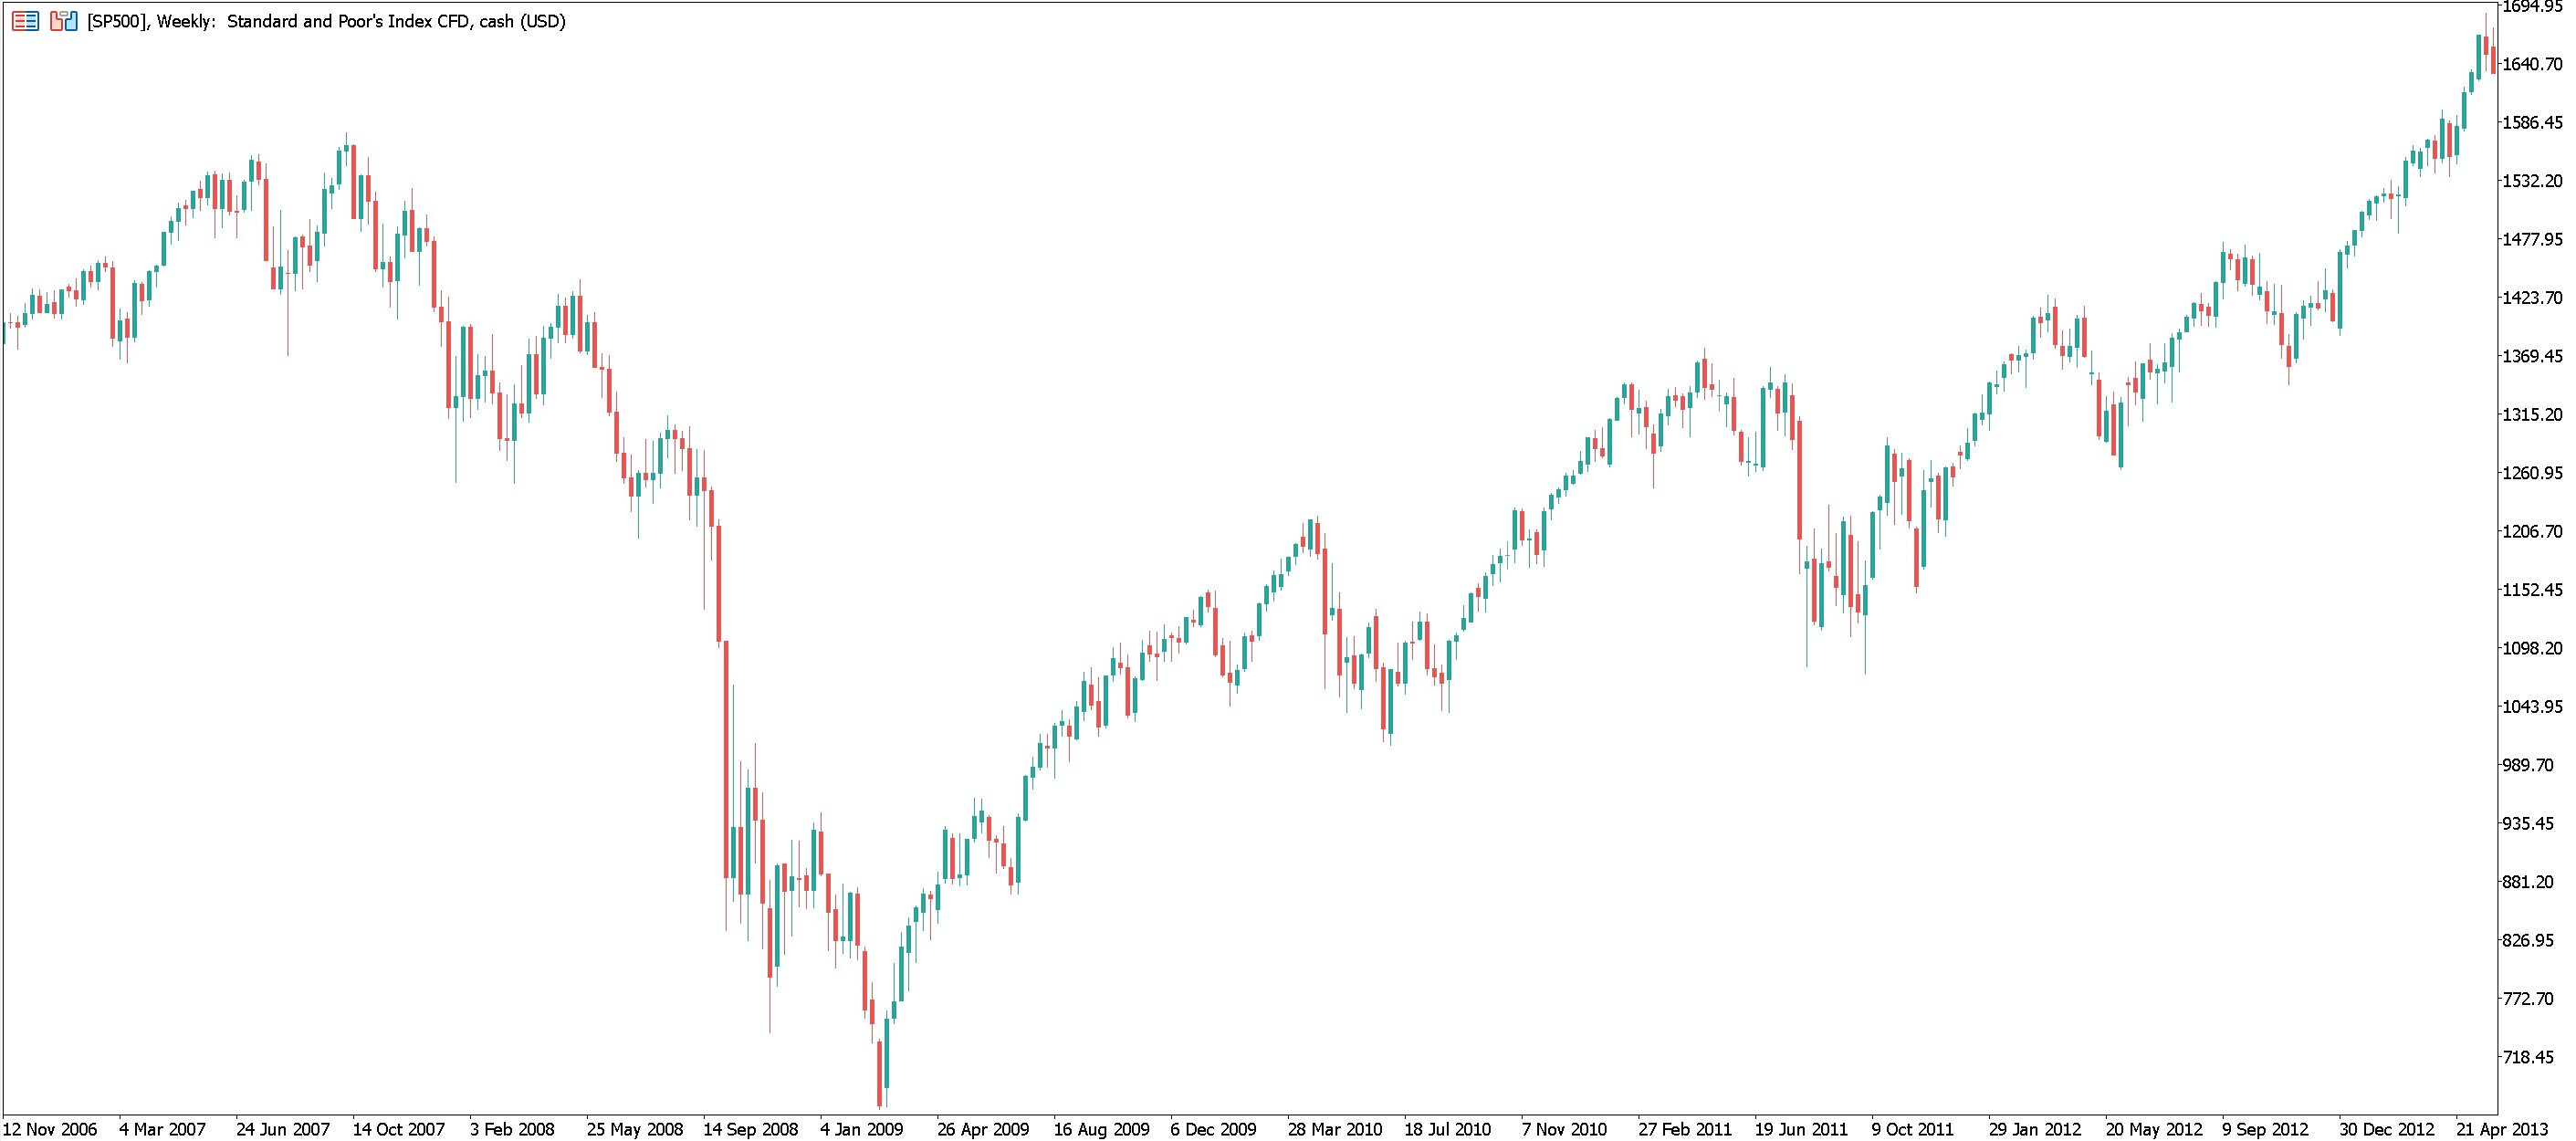
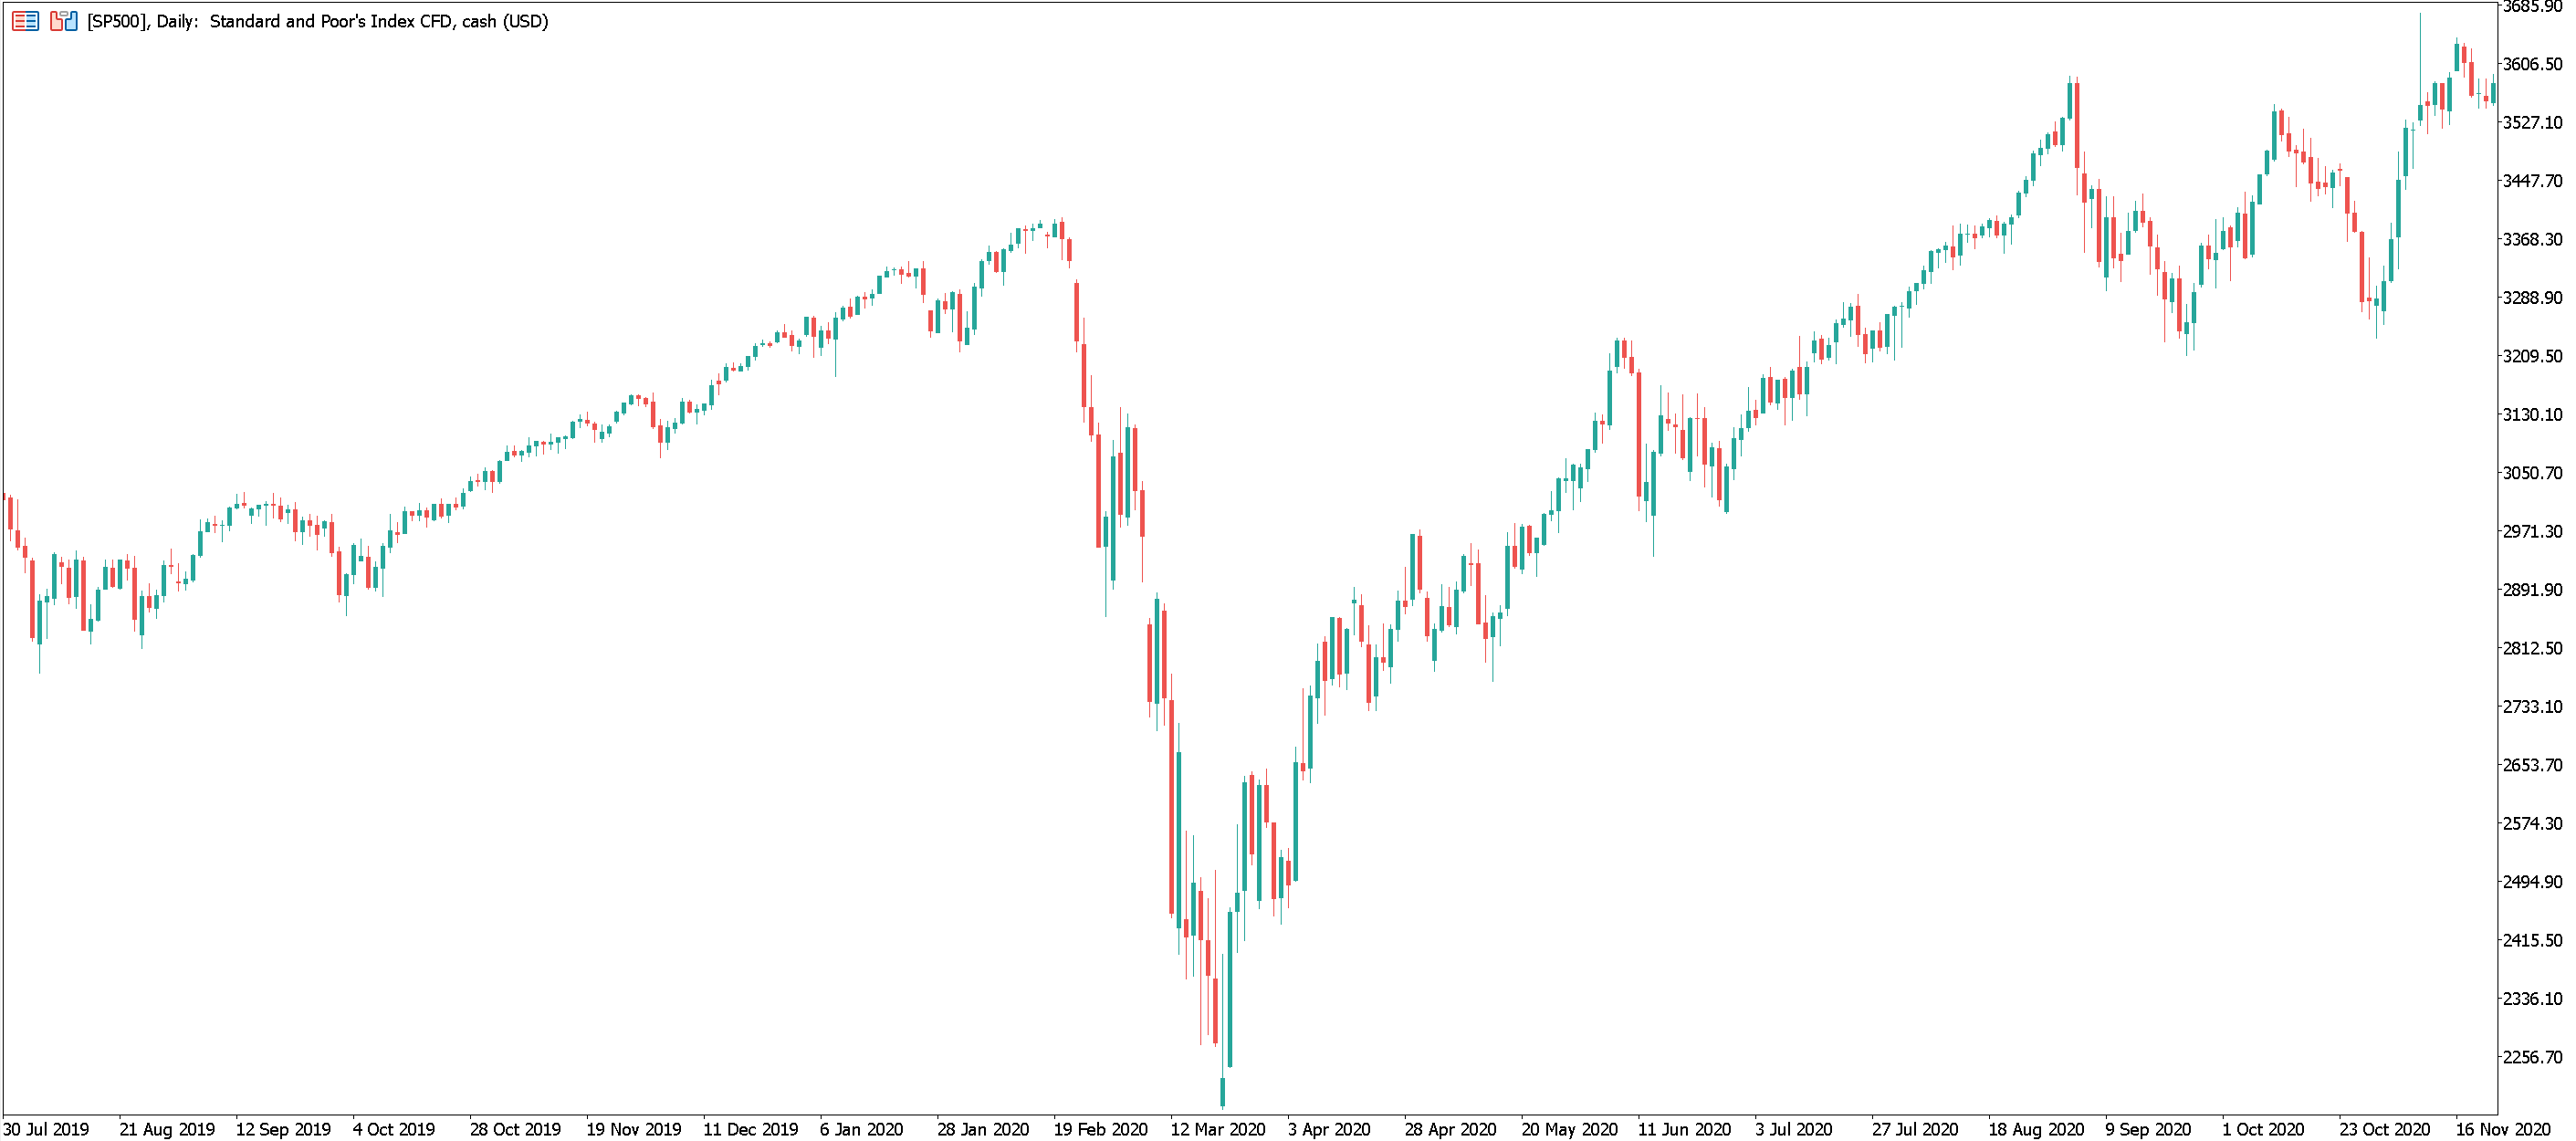
For example, if we compare the Global Financial Crisis of 2008 to the recession which occurred during the coronavirus pandemic, we can observe differences in the duration of the contractions and the market’s reaction.
The financial crisis in 2008 led to a prolonged recession which lasted around one and a half years in the US. The benchmark S&P 500 index began declining in late 2007 and eventually fell by more than 50%, hitting its lowest point in March 2009. It then took approximately four years for the index to recover its previous highs.
Contrast this with the Covid-19 recession, which was very deep but very brief, officially lasting just two months in the US. The stock market reaction was similarly short and steep. The S&P 500 sank around 34% in little over a month but then rebounded and recovered its losses within five months.
These examples highlight that although recessions typically coincide with stock market declines, the timing, severity and recovery can vary significantly and are difficult to predict.
Therefore, instead of trying to forecast the future, it might be more practical to focus on preparing your finances and investments for a range of possible outcomes.
How to Prepare for a Recession
Understandably, the prospect of a recession can be concerning but there are ways in which people can prepare themselves for a downturn. In the following two sections, we’ll highlight several steps of how to prepare for a recession.
Financial Preparation
- Build an Emergency Fund: If you’re able, it’s sensible to create an emergency fund of cash to help with any unexpected events. Exactly how much to save will vary depending on circumstances; however, a possible place to start is to calculate how much you would need to cover three to six months' worth of expenses.
- Consider Paying Off Debt: Again, if you’re able, paying off high interest debt, such as credit card bills, is generally a good idea regardless of the economic outlook. In some cases, speaking to a financial advisor may be beneficial.
- Evaluate Your Budget: Assess incomings and outgoings and consider if there is any non-essential spending which could be trimmed.
Investment Discipline
- Review Your Portfolio: Consider whether your investments remain aligned with your financial goals, time horizon and tolerance for risk. Diversification across sectors and asset types can help reduce exposure in the event of a market downturn.
- Rethink Trying to Time the Market: Many investors attempt to predict when markets will peak or bottom in order to maximise returns. In practice, accurately timing these turning points is extremely difficult and can result in missed gains or potential losses.
- Stick to Your Plan: If you already have a long-term investing plan, consider sticking to it before, during and after the downturn. By investing on a regular basis, investors get more shares when they are cheaper and fewer when they are more expensive, which can result in a lower average cost per unit.
- Don’t Panic: During market crashes, many investors sell simply because prices are falling rapidly. Panic selling can lock in losses that might otherwise recover when markets stabilise.
How to Invest During a Recession
Economic uncertainty and recessions can cause volatility in the markets, which can make investing decisions more challenging. Some investors may attempt to adjust their strategy during such periods, whilst others prefer to maintain their normal approach.
There is no strategy which will work in every situation. Different approaches will appeal to different investors depending on their tolerance to risk and time horizon, amongst other things.
In the following section, we will highlight four possible approaches which can be taken by investors.
Go Short with Derivatives
One approach is to attempt to profit from declining markets by short selling, which involves speculating that an asset’s price will fall.
There are a number of ways to do this, one of which is by using financial derivative products such as options, futures or Contracts for Difference (CFDs) - all of which allow traders to speculate on an asset’s price without owning the underlying asset.
However, this approach carries a high amount of risk. Losses can be significant if the market moves in the opposite direction and, as we noted earlier, timing market downturns is notoriously difficult. Consequently, this is typically only suitable for experienced traders and investors.
Rotating into Defensive Assets
Another approach which is common amongst investors is to shift their portfolio away from riskier assets and into areas of the market which have historically been more resilient to economic downturns.
In terms of the stock market, investors will often rotate their portfolios towards defensive industries - such as healthcare, consumer staples or utilities. Companies which operate in these industries produce goods and services which tend to remain in demand regardless of the broader economic environment.
Looking beyond the stock market, investors may also increase their exposure to safe haven assets or other investments which are perceived as relatively stable, such as gold or high-quality government bonds.
Nevertheless, it’s important to note that no industry or asset is totally immune to market downturns.
Bargain Hunt for Discounted Stocks
For some, a period of market weakness can also present opportunities to buy stocks at lower prices.
During a downturn, stock prices may fall as investors anticipate lower future earnings. However, if lots of people are selling, it can result in prices falling to levels which some investors with a long-term horizon might find appealing.
Investors who choose to do this may look for established companies which have strong balance sheets, durable business models and a significant competitive advantage. By investing in these companies at a lower price level, investors hope to benefit from long-term growth once the market recovers.
However, identifying these types of companies can be challenging. Not every stock that falls in price will represent a good investment; some stocks may never recover and, those that do, may take years to do so.
Doing Nothing
It may sound strange, but a final approach might be to maintain an existing strategy and to avoid making significant portfolio changes during periods of uncertainty.
Some investors take the view that attempting to adjust portfolios in response to short-term economic developments might lead to expensive mistakes. Instead, they factor in such downturns to their original investment plan and remain invested throughout.
For example, investors who make regular investments over time might continue to do so, regardless of what’s happening in the wider economy. This approach is known as dollar cost averaging and may result in lower average cost of investments over the long-term.
Nevertheless, as we’ve seen, markets can take a long time to recover after a downturn (if they recover at all). Consequently, this approach may be more suitable to investors who have a long time horizon and can afford to wait for their investments to potentially recover.
Each of these approaches has advantages and disadvantages, and different investors may favour different strategies depending on their circumstances and risk tolerance. Importantly, recessions are often unpredictable, and markets may behave in ways that are difficult to anticipate.
Final Thoughts
Recessions are a normal part of the economic cycle but can significantly differ in how they unfold. Some may be prolonged, whilst others can be short but severe.
Financial markets can also react unpredictably, often moving ahead of official economic data as investors respond to shifting expectations about the future.
Consequently, rather than attempting to predict exactly when a recession will happen or how the market will react, investors may choose to focus on general steps they can take to prepare themselves and different approaches they may take to the market during such periods.
Other Articles You Might Be Interested In:
Frequently Asked Questions
How much cash should I have before a recession?
There is no set answer to this question, as everyone’s circumstances are different. However, a common starting point is to evaluate how much money you would need to cover three to six months’ worth of essential expenses.
Should I sell all my stocks if a recession is coming?
Attempting to time the market is notoriously difficult. It’s important to note that selling stocks will cement any losses and can result in missing out on gains if timed incorrectly. Before taking such a decision, it’s important to calmly assess your circumstances and to avoid making a kneejerk, emotional decision.
What are “defensive” stocks and do they really help?
Defensive stocks are the shares of companies that sell goods and services which tend to receive consistent demand regardless of the economic environment. Typical examples include companies which operate in healthcare, consumer staples and utilities. Historically, defensive stocks have often been more resilient during periods of economic turmoil; however, this is by no means guaranteed.
Is timing the market a good strategy?
Whilst many investors attempt to do so, successfully timing the top and bottom of the market is extremely difficult and can result in losses or missed gains.
How long do recessions usually last?
Unfortunately, there is no answer to this question. Every recession is different and they can vary in length and severity. Rather than trying to accurately predict the future, it may be more fruitful to try and prepare for a range of scenarios.
The given data provides additional information regarding all analysis, estimates, prognosis, forecasts, market reviews, weekly outlooks or other similar assessments or information (hereinafter “Analysis”) published on the websites of Admirals investment firms operating under the Admirals trademark (hereinafter “Admirals”) Before making any investment decisions please pay close attention to the following:
- This is a marketing communication. The content is published for informative purposes only and is in no way to be construed as investment advice or recommendation. It has not been prepared in accordance with legal requirements designed to promote the independence of investment research, and that it is not subject to any prohibition on dealing ahead of the dissemination of investment research.
- Any investment decision is made by each client alone whereas Admirals shall not be responsible for any loss or damage arising from any such decision, whether or not based on the content.
- With view to protecting the interests of our clients and the objectivity of the Analysis, Admirals has established relevant internal procedures for prevention and management of conflicts of interest.
- The Analysis is prepared by an analyst (hereinafter “Author”). The Author Roberto Rivero is a contractor for Admirals. This content is a marketing communication and does not constitute independent financial research.
- Whilst every reasonable effort is taken to ensure that all sources of the content are reliable and that all information is presented, as much as possible, in an understandable, timely, precise and complete manner, Admirals does not guarantee the accuracy or completeness of any information contained within the Analysis.
- Any kind of past or modelled performance of financial instruments indicated within the content should not be construed as an express or implied promise, guarantee or implication by Admirals for any future performance. The value of the financial instrument may both increase and decrease and the preservation of the asset value is not guaranteed.
- Leveraged products (including contracts for difference) are speculative in nature and may result in losses or profit. Before you start trading, please ensure that you fully understand the risks involved.