Falling Wedge Pattern Guide for UK Traders
The falling wedge pattern is a technical analysis chart pattern that signifies a potential bullish breakout in a currency pair or stock’s price action. By understanding this pattern, traders may incorporate it with other analysis tools when developing trading strategies and risk management approaches.
This material is for informational purposes only and not financial advice. Consult a financial advisor before making investment decisions.
Table of Contents
Understanding the Falling Wedge Pattern
No technical analysis chart pattern, indicator or tool works all the time and there are often false breakout patterns. In this guide, we have used the experience of different traders to provide an understanding of what the falling wedge pattern is, its key characteristics and how it can be used for UK traders.
What is a Falling Wedge Pattern?
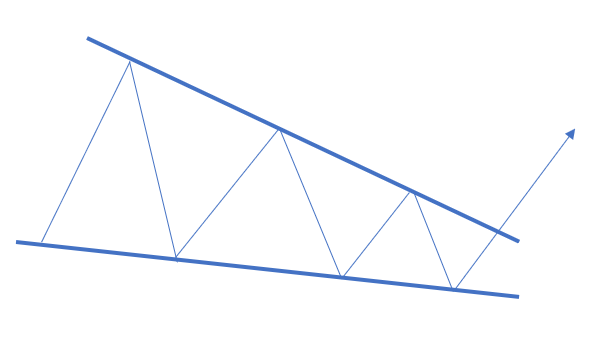
A falling wedge pattern is a technical chart formation that indicates a potential reversal or continuation in an asset’s price movement. It is formed when two downward-sloping trendlines converge, creating a narrowing price range.
Key Characteristics
The main characteristic of a falling wedge pattern is the converging trend lines, highlighting a consolidation in price action. Some traders may also look for declining trading volume as the pattern unfolds to further signify a consolidation in the market but then look for increasing volume before a potential breakout.
At some point, buyers or sellers may take control of the market, leading to the price breaking out of the wedge pattern. These patterns may develop after a significant uptrend or downtrend. However, as overall price action is falling to a lesser degree and the price is flattening out, the falling wedge pattern is known as a bullish breakout pattern. There are instances where this may not occur, which is why utilising other technical tools and analysis is essential.
Bullish vs. Bearish Falling Wedges
Bullish Falling Wedge: A Breakout Opportunity
In a bullish falling wedge, the price moves within converging trendlines before breaking out to the upside. Key confirmation signals include increasing trading volume and a breakout above the upper trendline.
These may occur after an uptrend, potentially indicating a continuation of the move higher, or following a downtrend, suggesting a possible reversal.
For example, the chart below shows the price action of the FTSE 100 company BP on the daily chart.
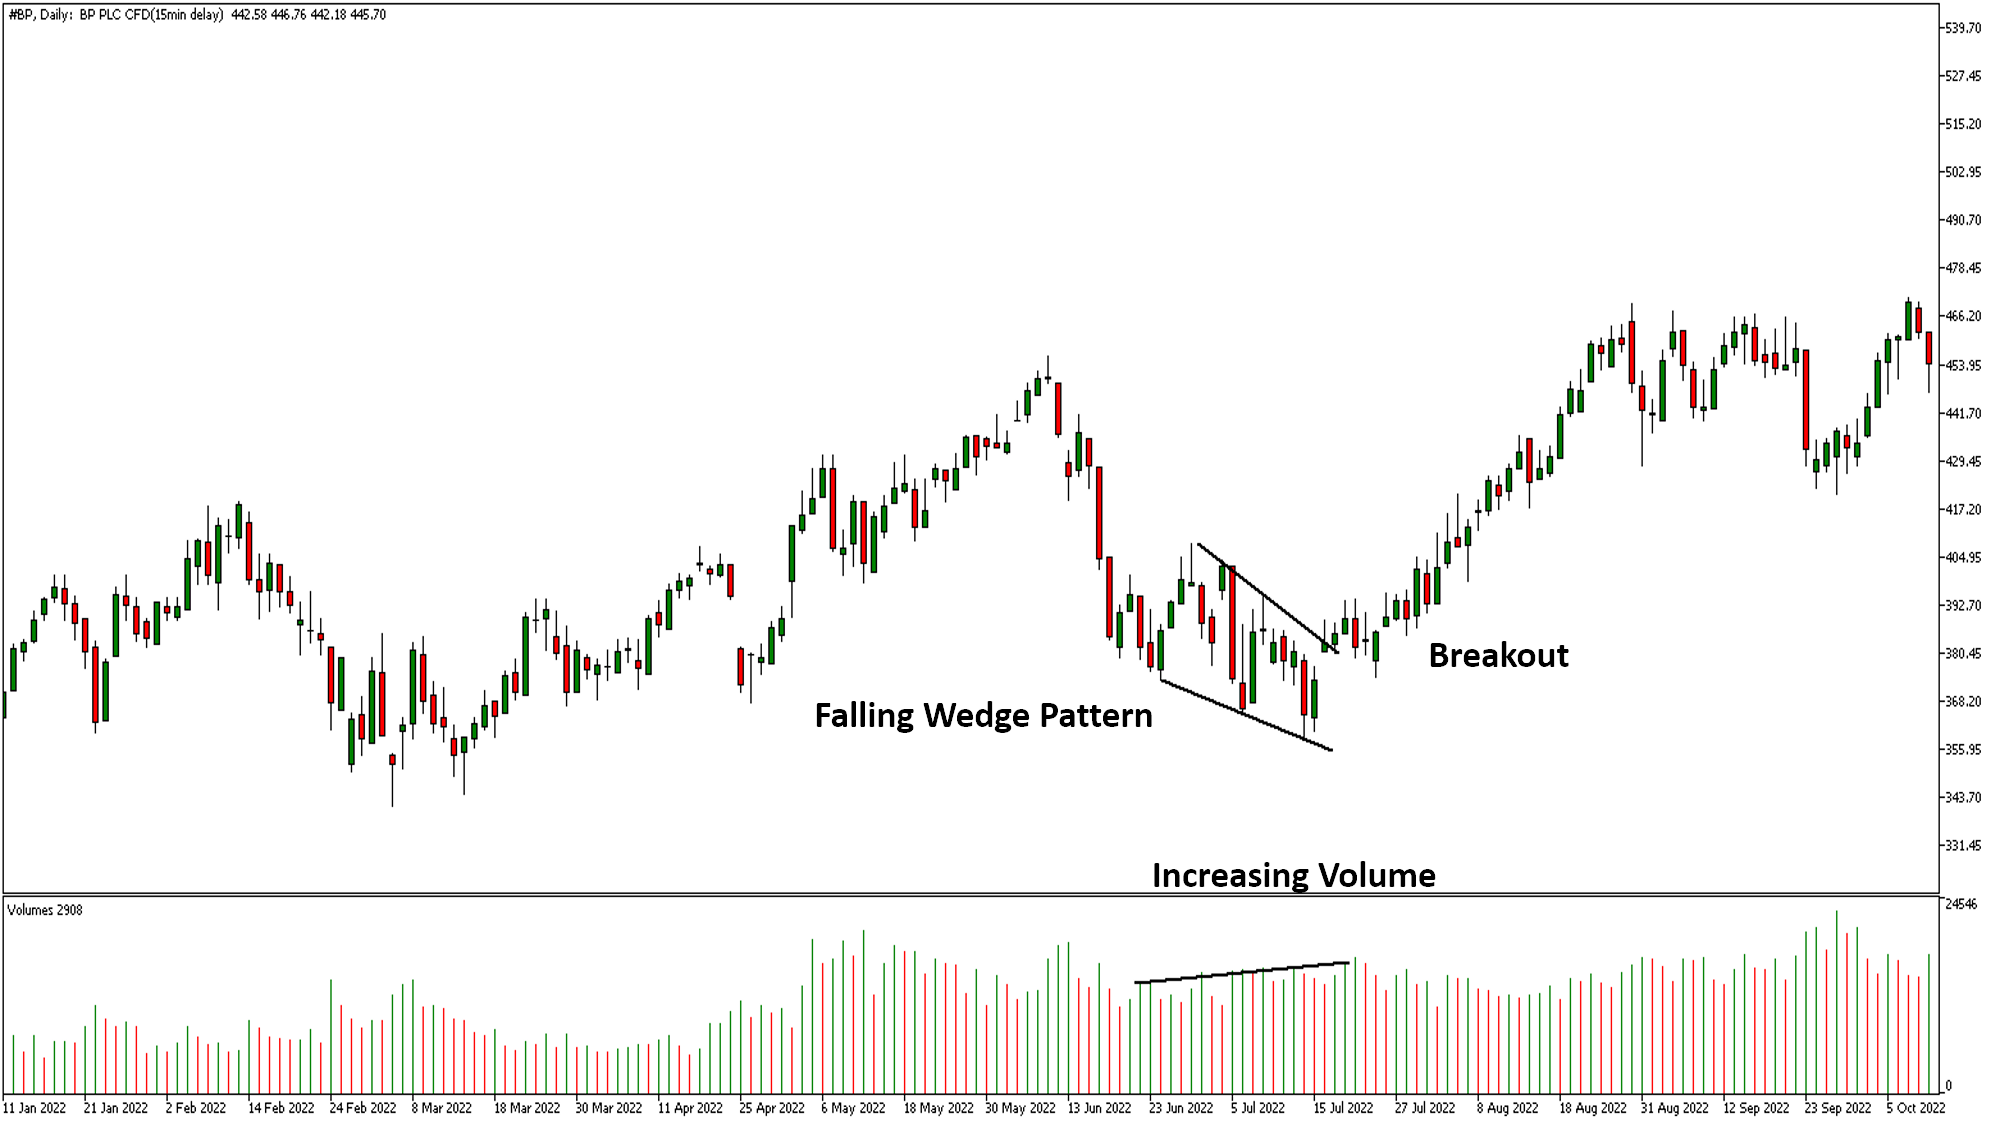
From June 2022 to July 2022, the price action exhibited a falling wedge pattern as shown by the converging black trendlines on the chart. This consolidation exhibited three lower highs at the upper trendline and three lower lows at the lower trendline.
The volume of the stock, shown at the bottom of the chart, was relatively flat during the narrowing price range. However, when the price broke out, the volume was increasing, confirming more trading activity at the breakout.
Bearish Falling Wedge: A Continuation Pattern
A bearish falling wedge appears in a downtrend and may indicate further price declines if the breakout fails to confirm a reversal and a new uptrend. If there is a lack of volume behind a breakout of the upper trendline, or the price action fails to break above the top of the wedge pattern, it may suggest a continuation of the preceding downtrend instead.
As no technical analysis chart pattern works all the time, exercising proper risk management and position sizing is essential to control the amount of loss on a losing trade.
Trading Strategies with the Falling Wedge Pattern
1. Breakout Trading
Some traders may choose to enter a trade when the price breaks above the upper trendline with increased volume, as part of a breakout strategy.
- Entry Point: This could be once the candle closes above the upper trendline resistance. If there is a volume increase, a trader’s entry point could be on the continuation of the price.
- Stop-Loss Placement: This could be placed below recent swing lows, the low of the candle which closed above the upper trendline or below the lower trendline of the wedge pattern.
- Profit Targets: This could be the next level of resistance on the chart, or a 1:1 of the price range of the wedge pattern, projected upward from the breakout point. Some traders may consider using the next level of resistance on the chart or a 1:1 projection of the wedge range as potential reference points for profit targets.
- Risk Management: It is essential to keep the risk low. Some traders may risk 0.5% or 1% of their trading account on a trade.
2. Trend Trading
Traders can also incorporate a falling wedge pattern into a broader-based trend strategy.
- Identifying Uptrends: A moving average is a technical indicator which shows the average price direction of a market over a specific number of periods. Traders can confirm an uptrend when the 50-day exponential moving average is above the 200-day exponential moving average.
- Using Additional Indicators: Some traders may also opt to add on momentum indicators such as the MACD oscillator and confirm that it is above the zero line, which signifies bullish momentum.
- Identify a Falling Wedge Pattern: After waiting for the price to consolidate in the uptrend, traders may look for a falling wedge pattern to then try and trade the bullish breakout and a continuation of the trend.
Conclusion
The falling wedge pattern is one of many different technical analysis chart patterns. Its primary use is to try and identify potential bullish breakouts after a period of consolidation, known as the wedge. This consists of two narrowing trendlines towards a specific point.
For beginners, it can be helpful to start trading on a demo account first, as this allows you to practice your skills in a virtual environment.

INFORMATION ABOUT ANALYTICAL MATERIALS:
The given data provides additional information regarding all analysis, estimates, prognosis, forecasts, market reviews, weekly outlooks or other similar assessments or information (hereinafter “Analysis”) published on the websites of Admiral Markets' investment firms operating under the Admiral Markets trademark (hereinafter “Admiral Markets”). Before making any investment decisions, please pay close attention to the following:
1. This is a marketing communication. The content is published for informative purposes only and is in no way to be construed as investment advice or recommendation. It has not been prepared in accordance with legal requirements designed to promote the independence of investment research, and that it is not subject to any prohibition on dealing ahead of the dissemination of investment research.
2. Any investment decision is made by each client alone whereas Admiral Markets shall not be responsible for any loss or damage arising from any such decision, whether or not based on the content.
3. With view to protecting the interests of our clients and the objectivity of the Analysis, Admiral Markets has established relevant internal procedures for prevention and management of conflicts of interest.
4. The Analysis is prepared by an analyst (hereinafter “Author”). The Author, Jitanchandra Solanki, is an employee of Admiral Markets. This content is a marketing communication and does not constitute independent financial research.
5. Whilst every reasonable effort is taken to ensure that all sources of the content are reliable and that all information is presented, as much as possible, in an understandable, timely, precise and complete manner, Admiral Markets does not guarantee the accuracy or completeness of any information contained within the Analysis.
6. Any kind of past or modeled performance of financial instruments indicated within the content should not be construed as an express or implied promise, guarantee or implication by Admiral Markets for any future performance. The value of the financial instrument may both increase and decrease, and the preservation of the asset value is not guaranteed.
7. Leveraged products (including contracts for difference) are speculative in nature and may result in losses or profit. Before you start trading, please ensure that you fully understand the risks involved.