Reversal Candlestick Patterns: A Trader's Guide to UK Markets
Reversal candlestick patterns can provide traders with insight into shifting market sentiment and potential changes in the direction of price. However, the signals they provide can be improved by seeking additional confirmation using technical analysis tools.
In this article, we will explore a variety of reversal candlestick patterns, explain how traders can use different tools to help confirm potential price reversals and much more!
| The information in this article is provided for educational purposes only and does not constitute financial advice. Consult a financial advisor before making investment decisions. |
Table of Contents
- Main Conclusions
- Reversal Candlestick Formations for UK Traders
- Bullish Engulfing Pattern in FTSE 100 Trading
- Trading Strategies Using Reversal Patterns
- Implementing Patterns on UK Trading Platforms
- Common Mistakes to Avoid When Trading Reversal Patterns
- Additional Confirmation Techniques for Increased Accuracy
- Conclusion
Main Conclusions
- Reversal candlestick patterns can signal potential reversals in price.
- Understanding these patterns can help traders spot price reversals.
- Candlestick patterns should be combined with other technical analysis tools to help improve the signals they provide.
- The Admirals Research Terminal can be used to screen thousands of assets to identify candlestick patterns and other important technical events.
Reversal Candlestick Formations for UK Traders
Every trading session is a battle between buyers and sellers. Whilst buyers push price higher, sellers attempt to drive it lower.
The candlesticks on a price chart provide a visual representation of each of these battles. Green-bodied candles indicate buyers have won the session in question, whilst red-bodied candles demonstrate that sellers have emerged on top.
But these candles don’t just tell us about what happened to price during the session. They can also provide insight into market sentiment and can indicate where price may be about to head next.
There are a number of different patterns which can signal a shift in market sentiment and, consequently, a potential reversal in price. These are known as reversal candlestick patterns and, throughout this article, we will identify many of these and demonstrate how they can be traded.
Bullish Engulfing Pattern in FTSE 100 Trading
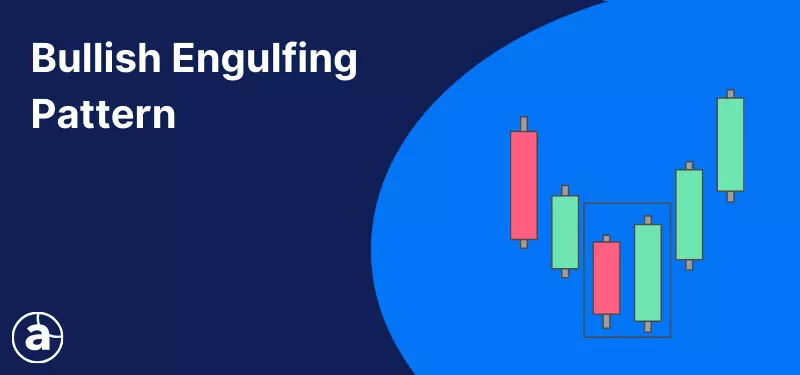
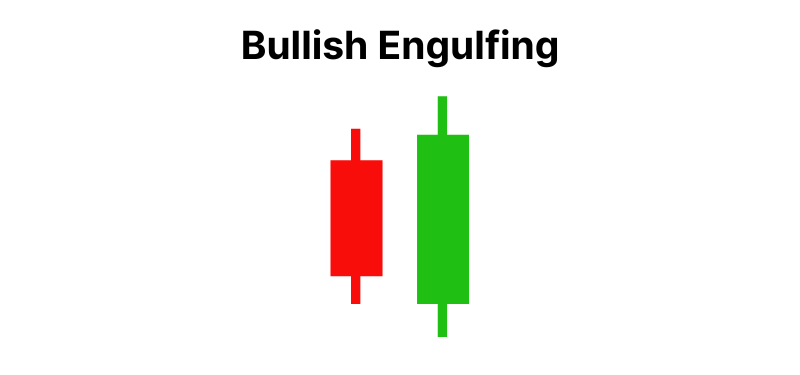
The bullish engulfing pattern is a candlestick pattern which consists of two candles and indicates a potential bullish reversal in price.
The body of the second candle, which is bullish, completely engulfs the body of the first candle, which is bearish. An example of what this looks like can be seen in the image below.
Formation Criteria and Volume Confirmation
The bullish engulfing pattern typically appears at the bottom of a downtrend and indicates that sentiment in the market may have shifted from bearish to bullish.
The second, bullish candle, opens lower than the close of the previous candle, demonstrating that sellers were in firm control when the session opened.
However, as the session progressed, buyers took control and forced the price upward to eventually close higher than the previous candle opened. If trading volume increases on this bullish candle, it is often perceived by traders as strengthening the reversal signal.
As noted previously, the visual effect of all this is that the body of the second candle completely engulfs the body of the first candle. This makes the bullish engulfing pattern easy for traders to spot.
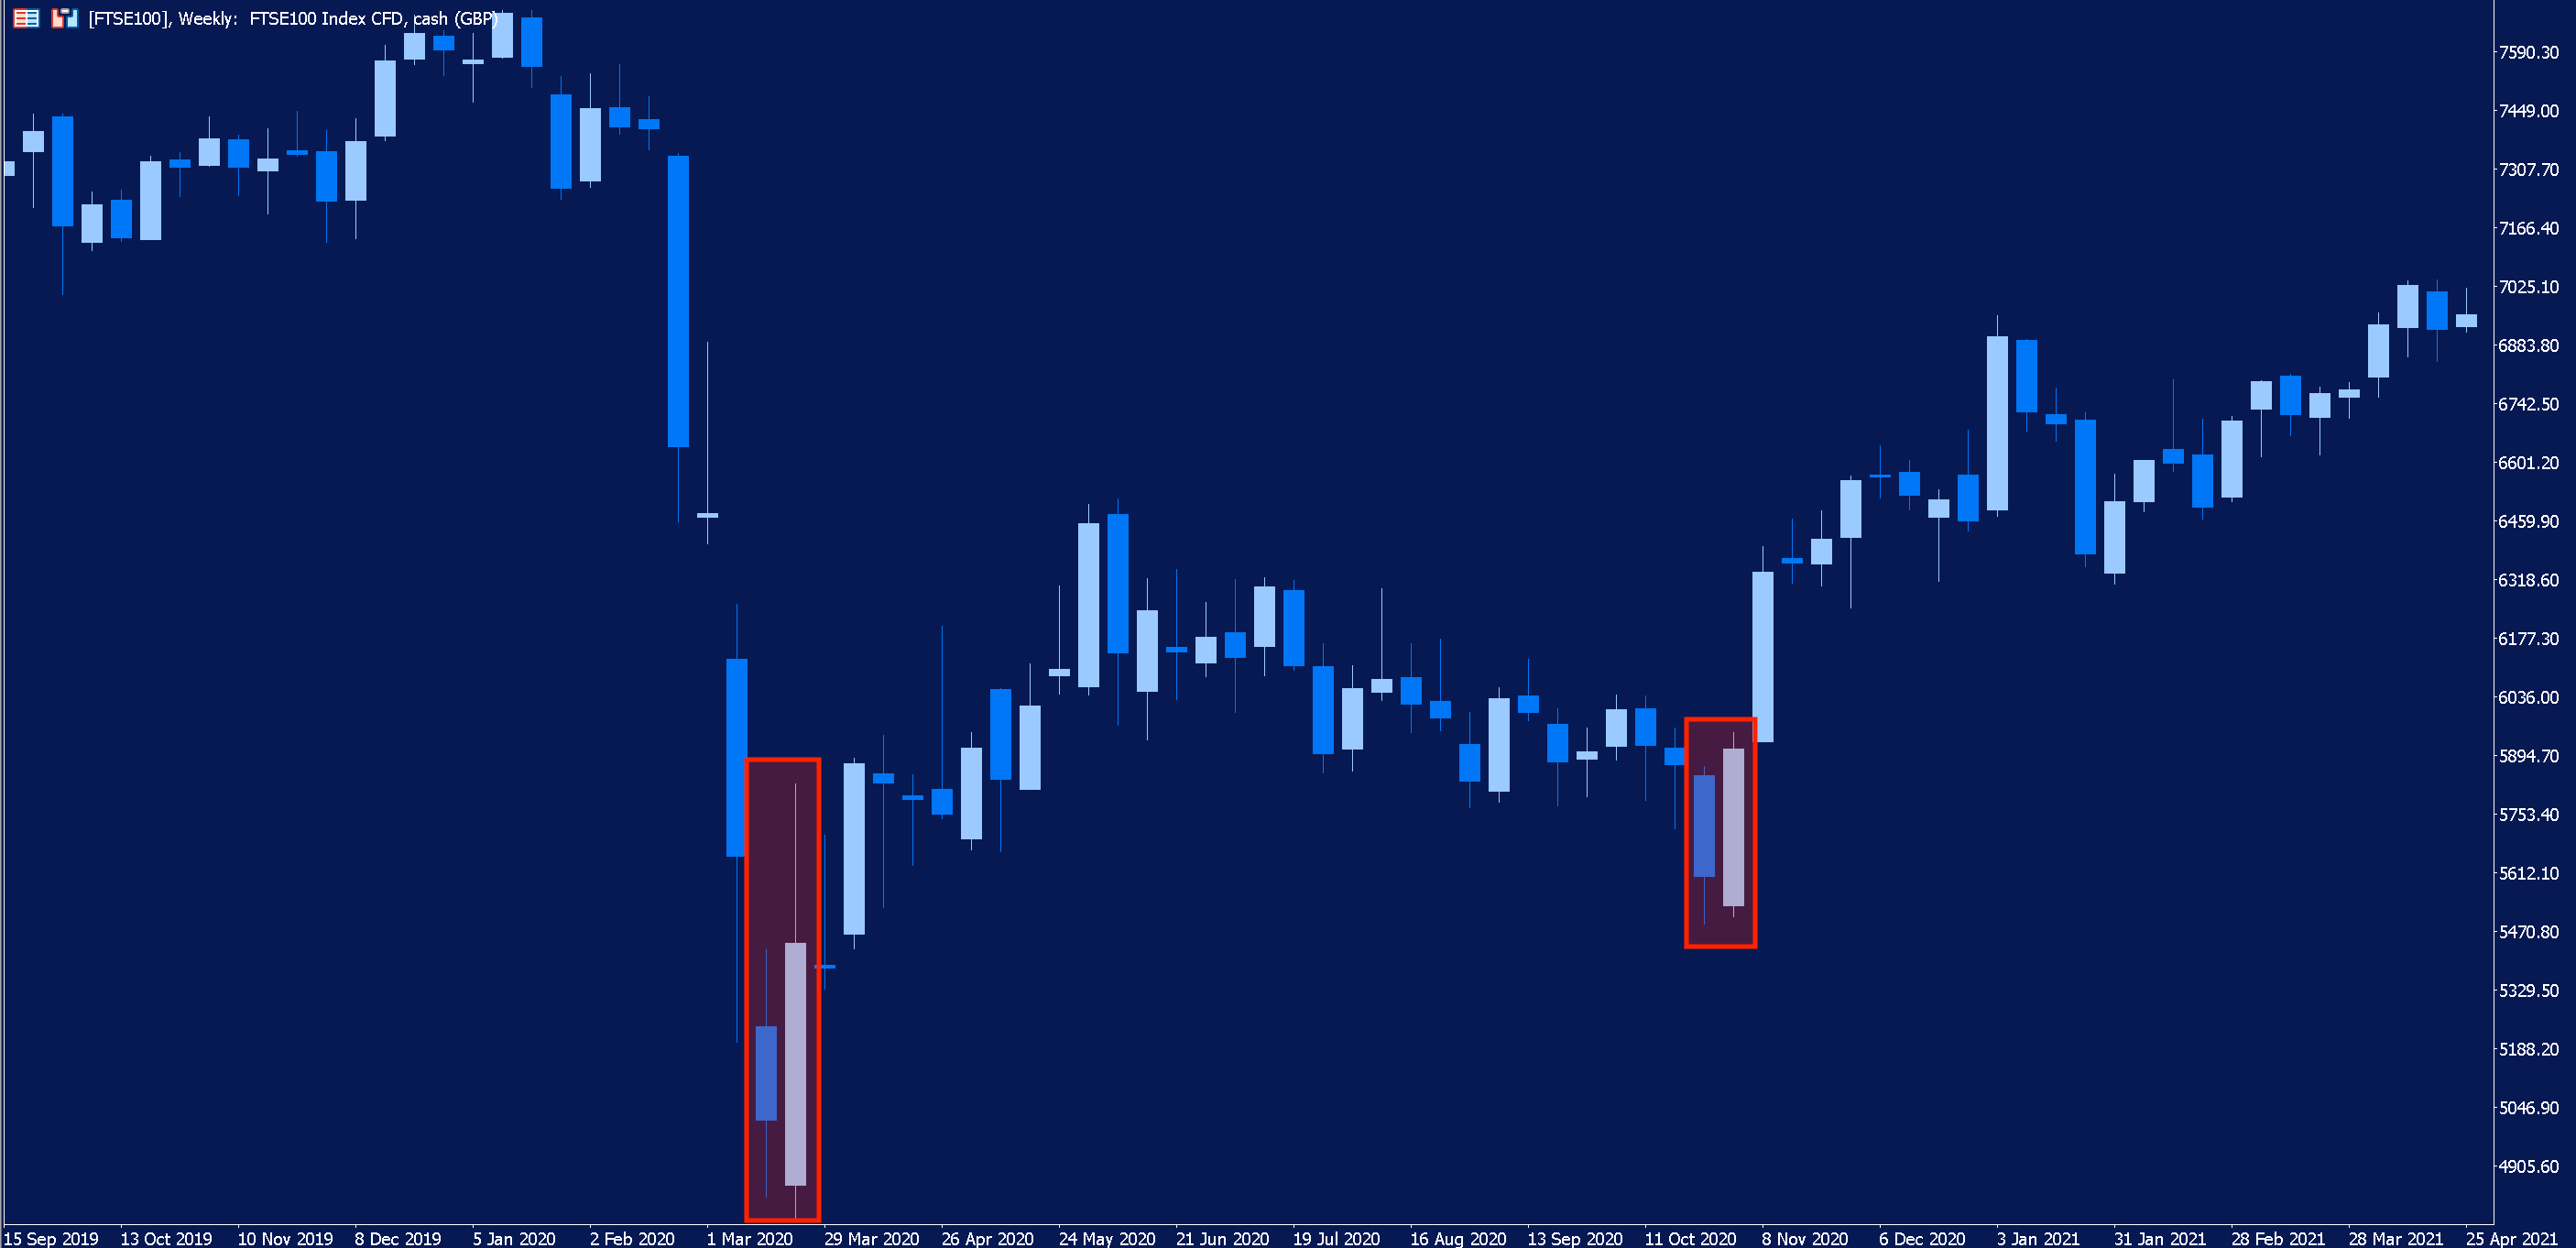
The image below shows two examples of the bullish engulfing pattern occurring on the weekly chart of the FTSE 100. In both instances, its formation was preceded by a downward movement in price and followed by a reversal.
Case Study: Bullish Reversals in LSE-Listed Stocks
Let’s take another look at an example of the bullish engulfing pattern, this time occurring in London listed pub chain, J D Wetherspoon.
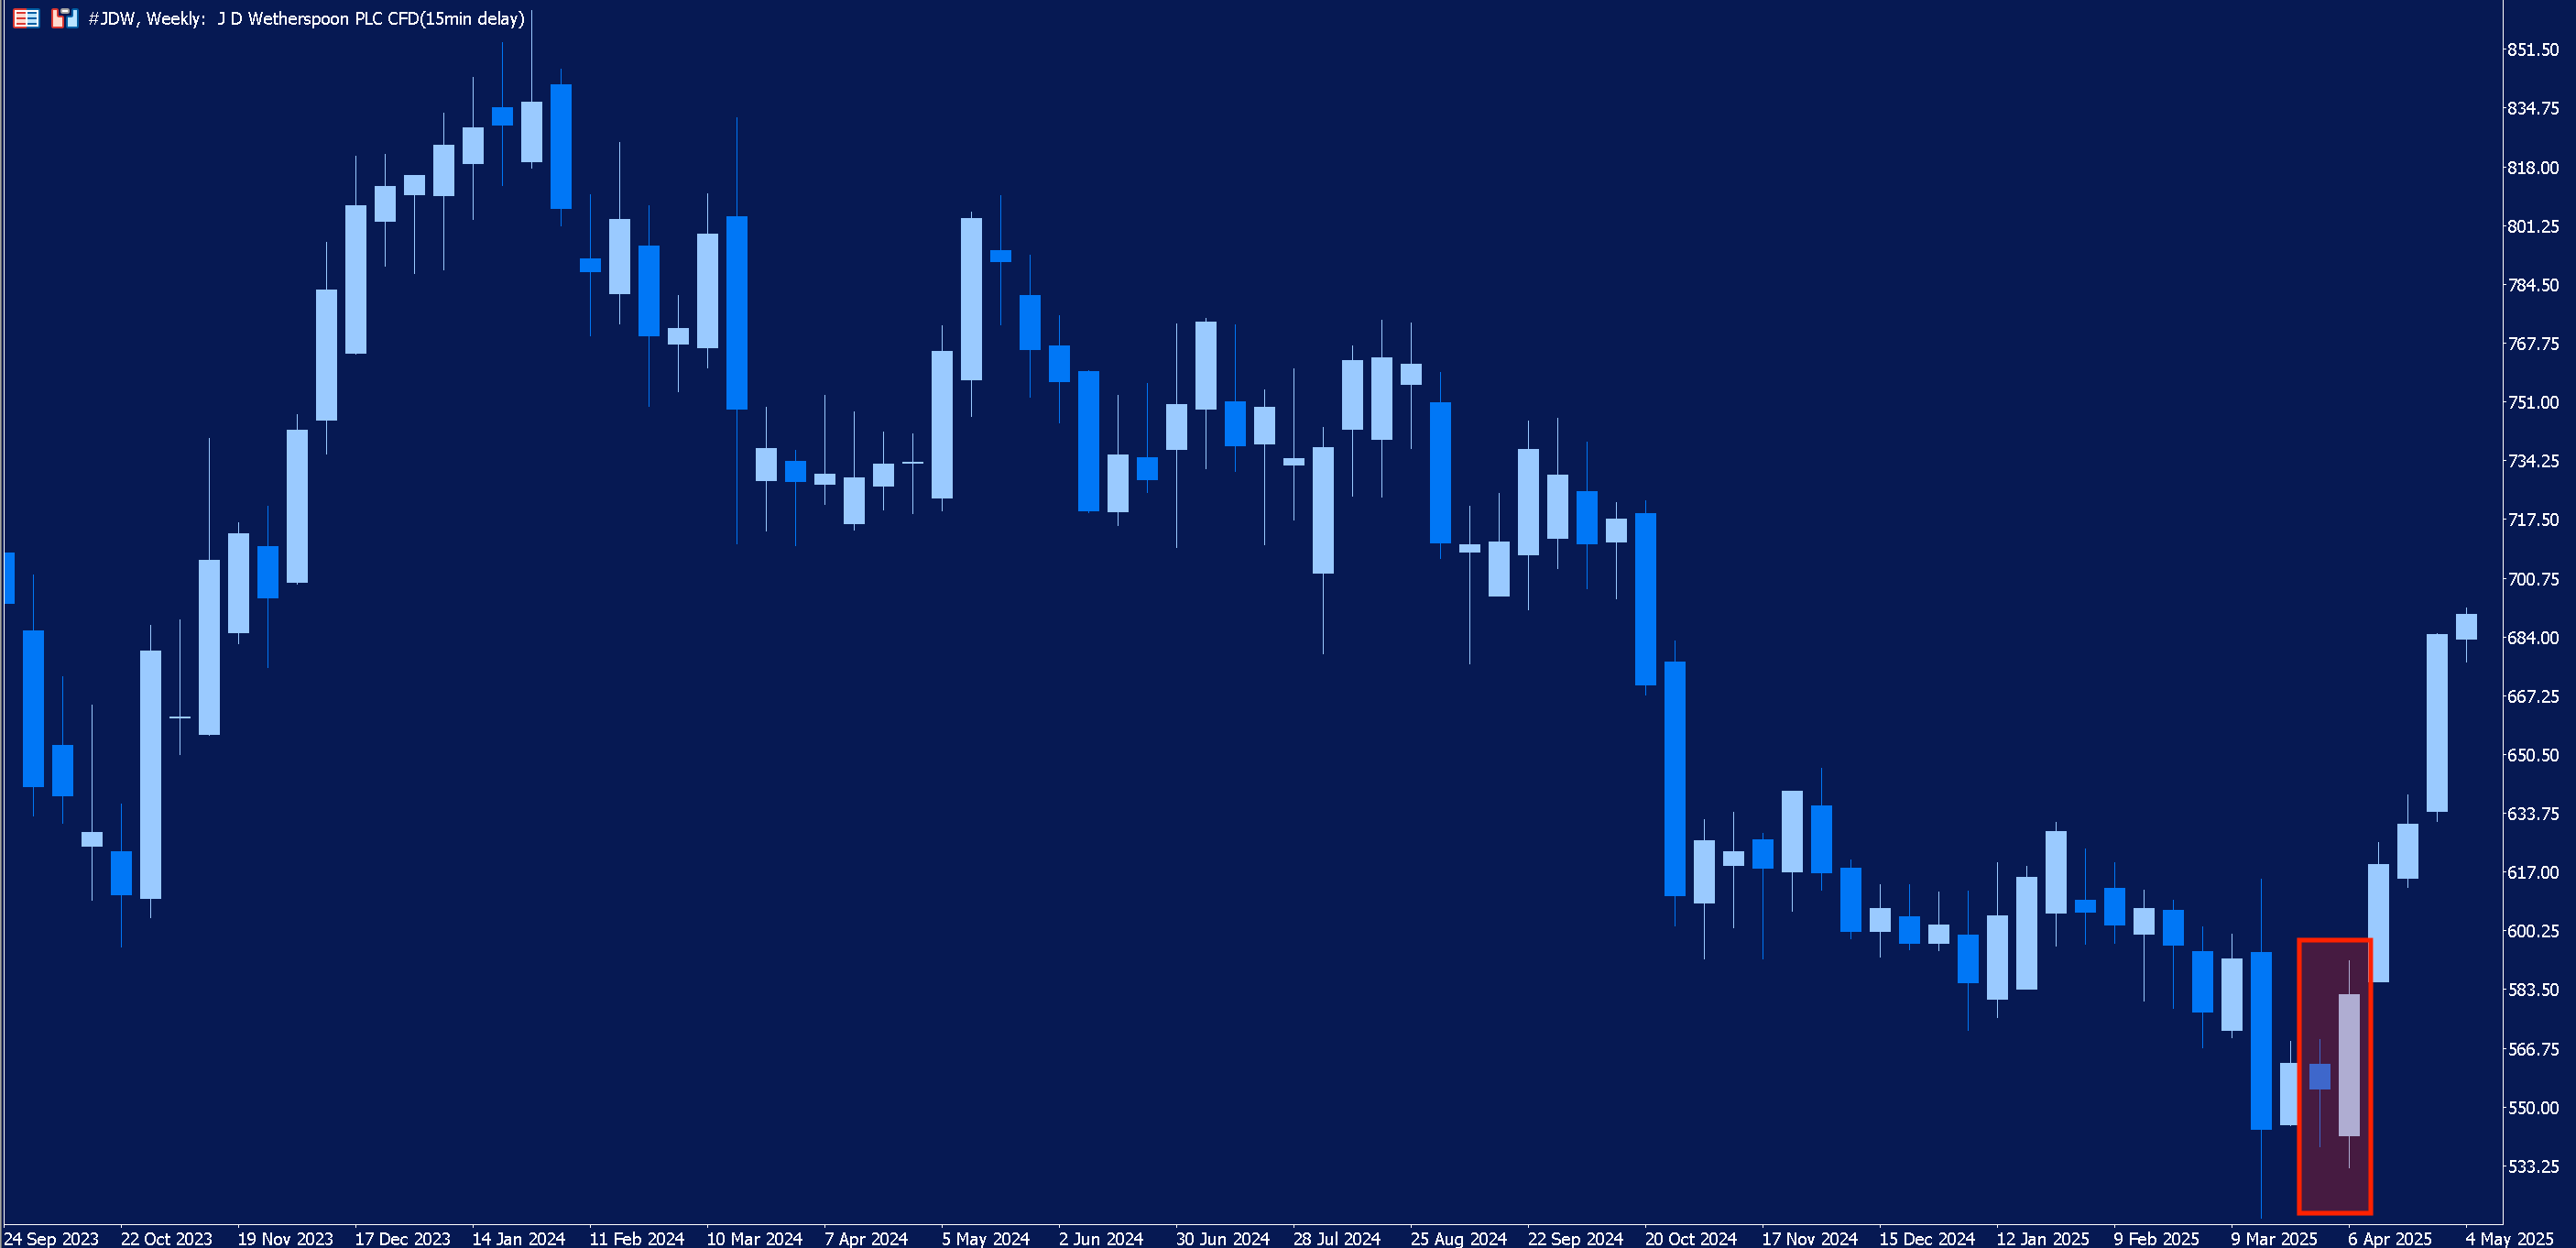
In the weekly chart of J D Wetherspoon above, we can see that, at the bottom of a downtrend which persisted for over a year, the bullish engulfing pattern appeared. As we know, the pattern can signal a potential reversal in price to the upside.
Sure enough, following its formation, share price reversed course and began a new uptrend.
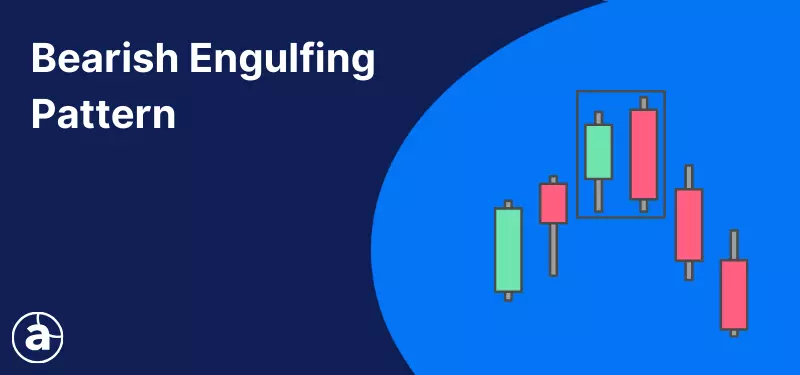
Bearish Engulfing
The bearish engulfing pattern is essentially the opposite of the bullish engulfing pattern. It typically appears at the top of an uptrend and signals a potential bearish reversal in price.
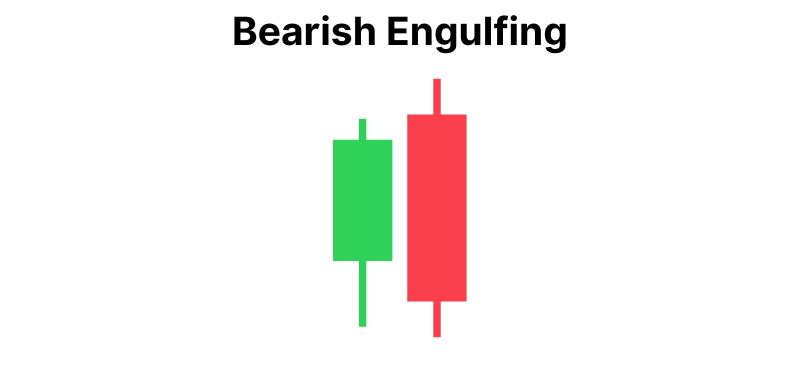
The pattern consists of two candles: a bullish candle followed by a bearish candle. The second, bearish, candle opens higher than the close of the first candle, indicating that buyers are in control when the session opens.
However, as the session progresses, sellers overcome buying pressure, pushing price down until it closes lower than the opening price of the previous candle. The visual effect of this is that the body of the bearish candle completely engulfs that of the bullish candle.
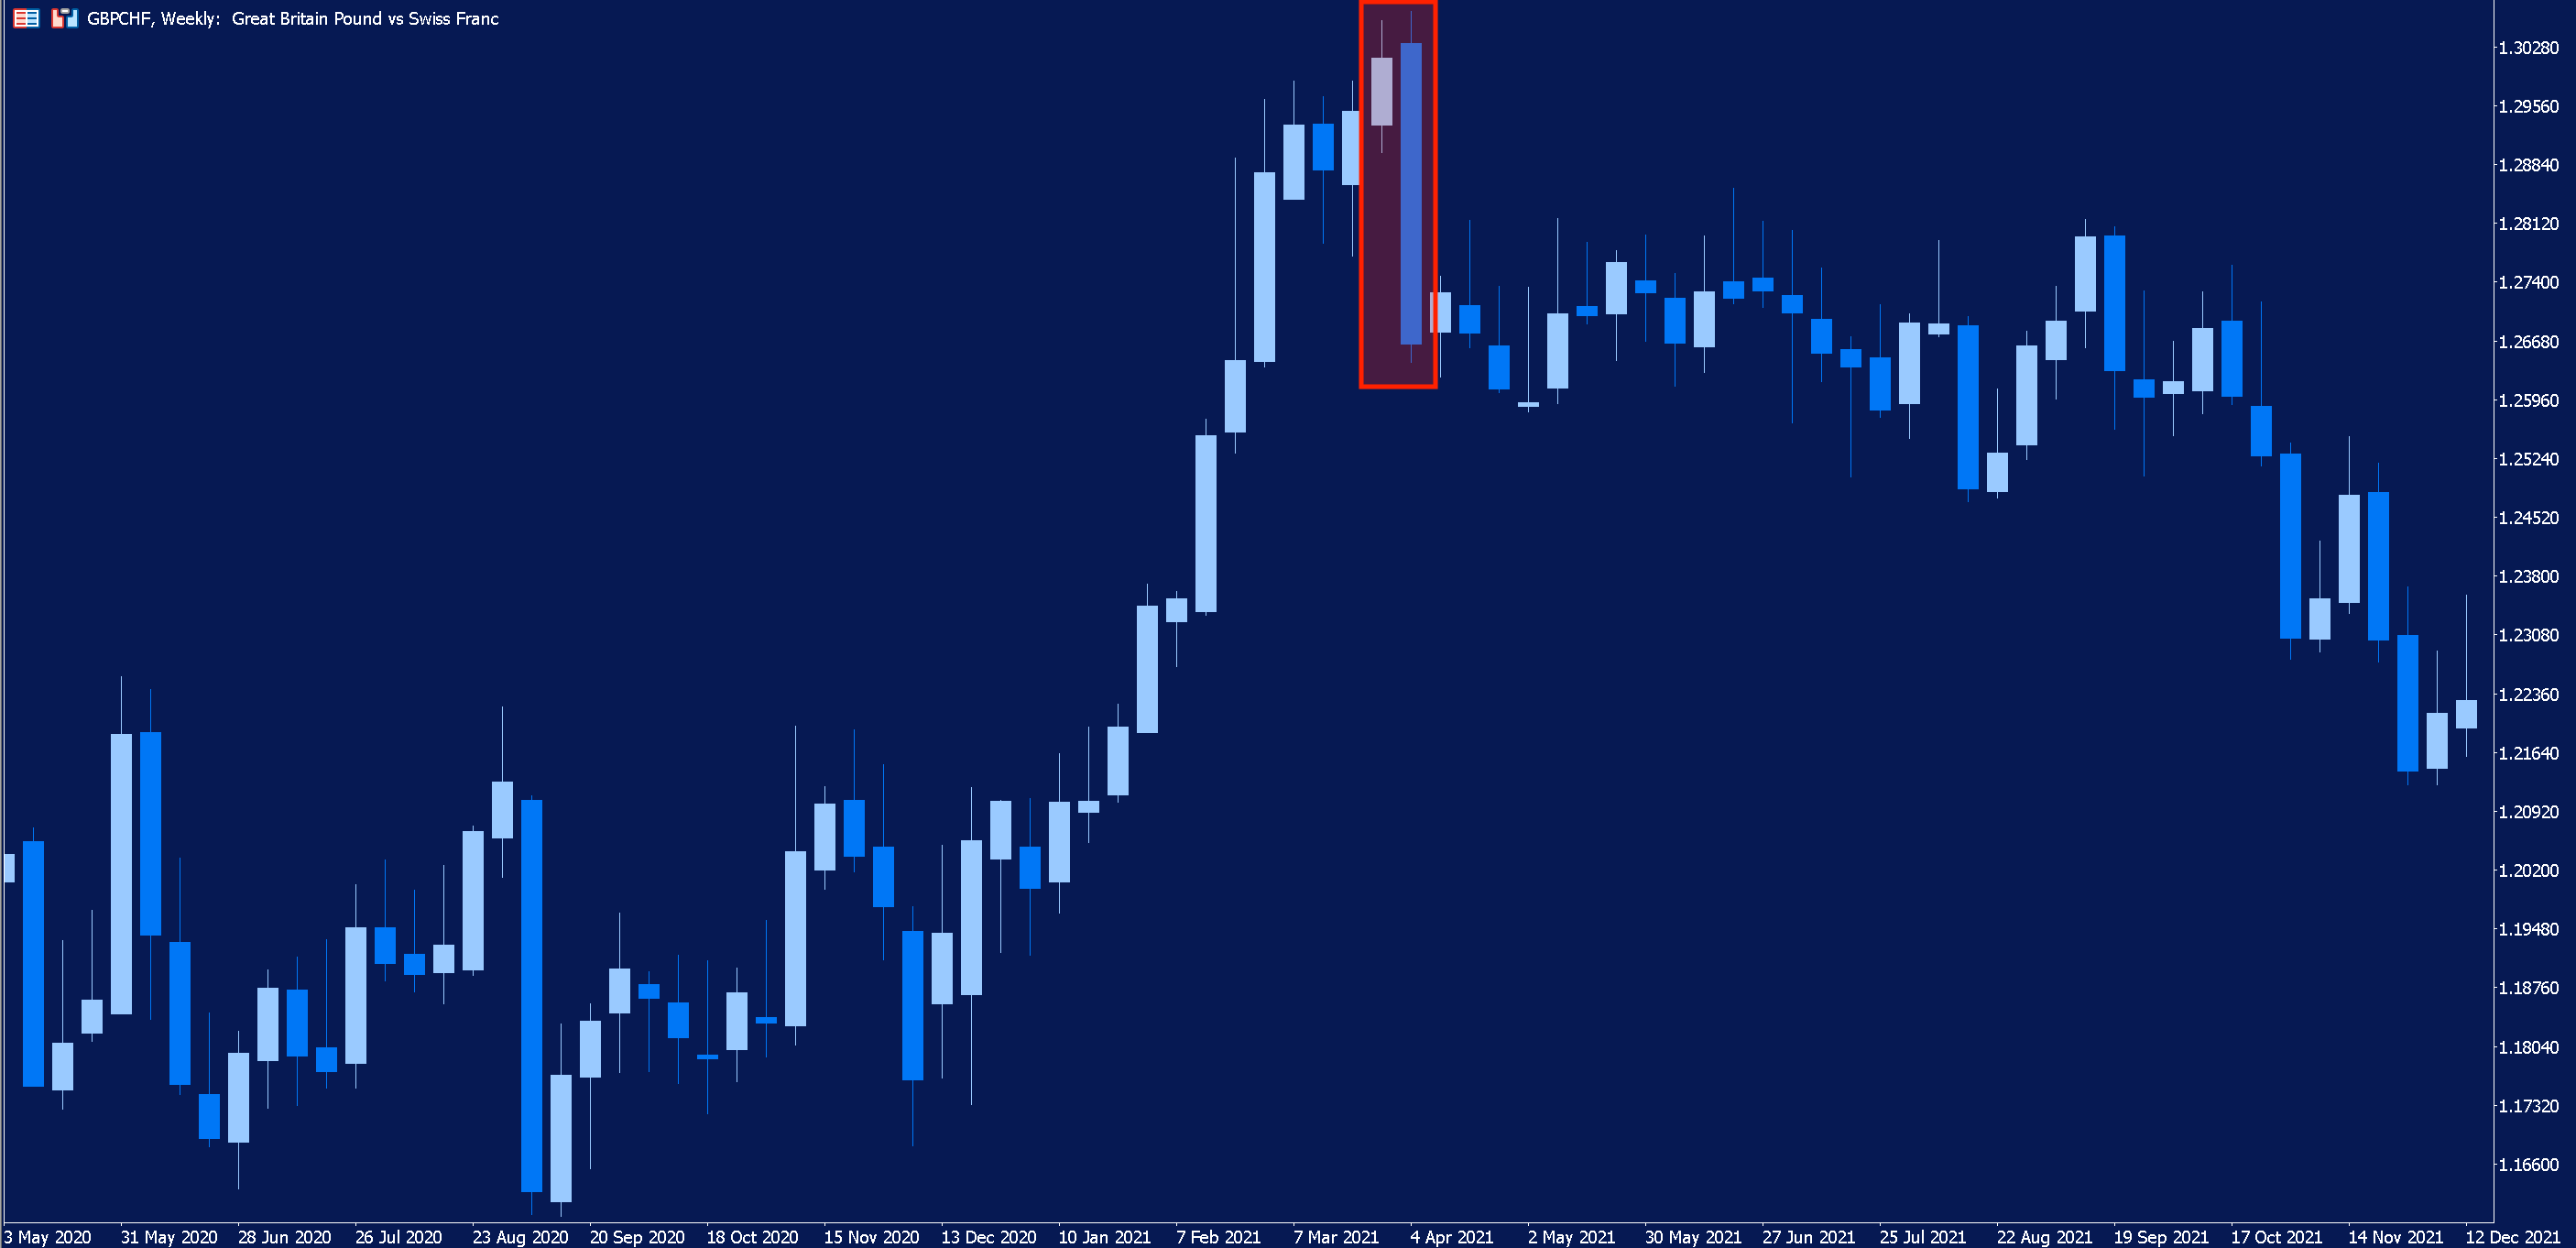
Identifying Bearish Engulfing in GBP Currency Pairs
Below is a weekly chart of the currency pair GBPCHF. In the chart, we can see that, at the top of an upward movement in price, the bearish engulfing candlestick forms, after which price starts to follow a downward trajectory.
Trading Strategies Using Reversal Patterns
Reversal candlestick patterns can signal a potential reversal in an asset’s price; however, not every pattern will necessarily be followed by a change in the direction of price.
Consequently, rather than entering the market strictly based on the appearance of a reversal candlestick pattern, it is prudent for traders to seek confirmation of a potential reversal.
There are several ways in which traders may choose to do this, such as the following:
-
Technical Indicators
- There are a number of technical indicators which can be used to look for evidence of a potential reversal in price. These include the Relative Strength Index (RSI), Stochastic Oscillator and the Moving Average Convergence/Divergence (MACD).
-
Support and Resistance Analysis
- If a reversal candlestick pattern occurs near a historic level of support or resistance, this might be interpreted by traders as additional evidence of a price reversal.
-
Volume Analysis
- If a reversal candlestick pattern is accompanied by increasing trading volume, traders might consider it to be a more robust reversal signal. The reason being that the increasing volume might imply that the move is supported by increased market participation.
In the following sections, we will take a look at how to trade using reversal patterns and provide examples of how traders might seek confirmation of the signals these patterns provide.
Day Trading Techniques with Morning Star Formations
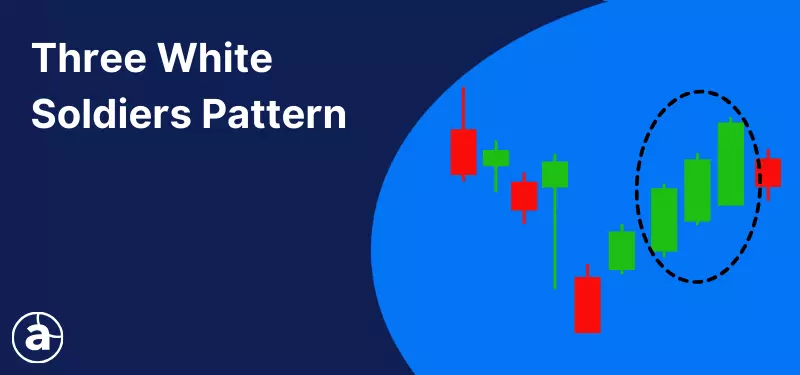
The morning star is a pattern consisting of three candlesticks which can signal a potential bullish reversal in price.
The first of the three candlesticks is long and bearish; this is followed by a short-bodied candle, which can be either bullish or bearish; and, finally, a long bullish candle.
The short, middle candle opens lower than the close of the first candle. The third candle opens higher than the close of the middle candle and should close above the midpoint of the first candle’s body.
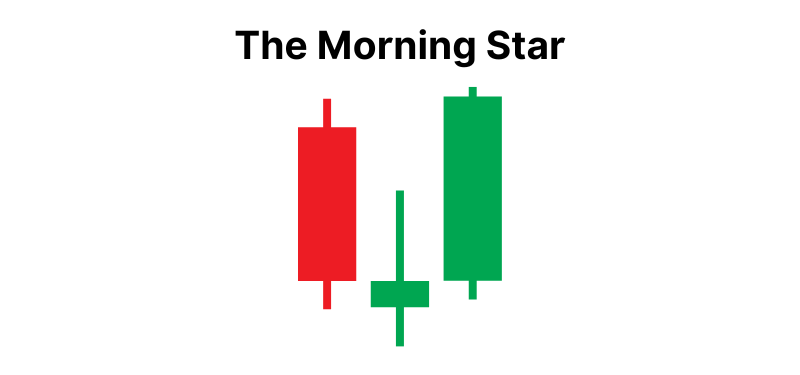
The candlestick pattern signals that a downtrend may be breaking down, as selling pressure yields to a moment of market indecision – highlighted by the short-bodied, middle candle – before buyers step in and force the price back up.
Day traders might use this signal to either enter a long position or to exit an existing short position.
For those that only trade with the trend, as is particularly common for day traders, they may use reversal patterns, such as the morning star, to take positions which align with the overall direction of the market.
Consequently, traders could use the morning star pattern to help find potential entry points after a price correction.
For example, below is a 30-minute chart of FTSE 100 stock Diploma in which an uptrend is in progress.
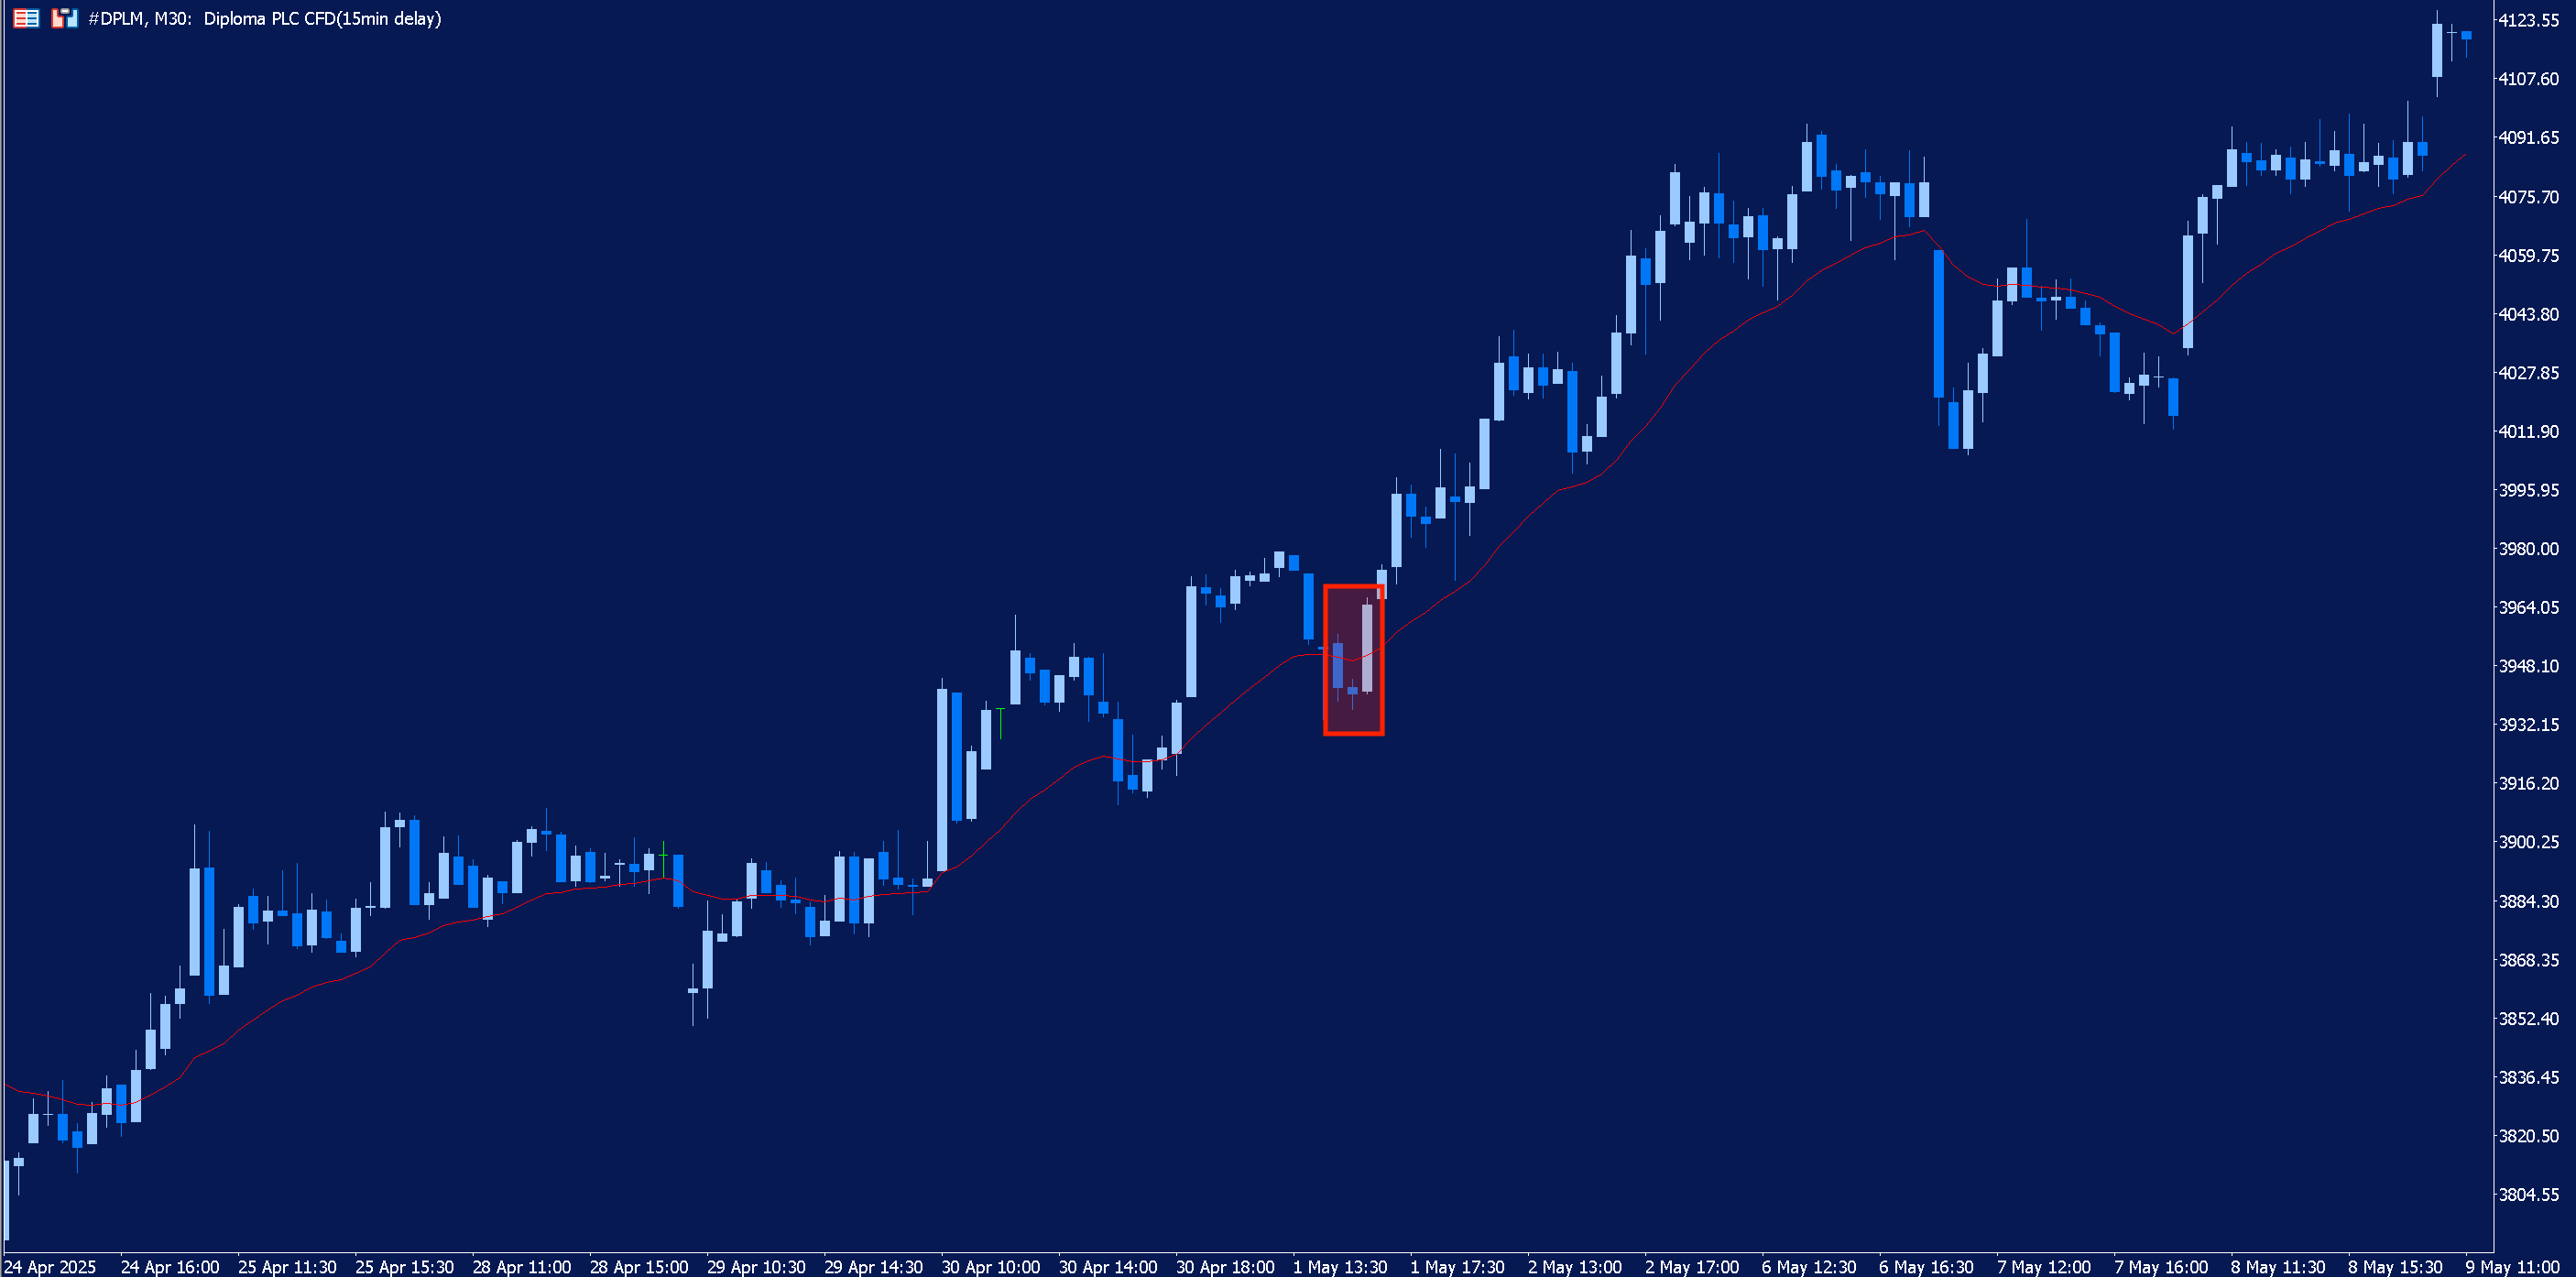
The red line is a 20-period moving average, whilst share price is above this line, it indicates that an uptrend is in process. We can notice that, on several occasions, price appears to treat this line as an area of support.
Typically speaking, candlestick patterns which form around an area of historic support or resistance tend to carry more weight with traders.
We can see that, on one occasion, as share price pulls back towards the moving average, the morning star pattern appears. This could indicate that price is about to resume its upward trajectory and, sure enough, the pattern signals the end of the brief price correction the uptrend continues.
Combining Hammer Patterns with RSI Indicators
The hammer candlestick pattern consists of a single candlestick, typically appearing after a downward movement in price and signalling a potential bullish reversal.
The candle is characterised by a short body, a long lower wick and a small, or no, upper wick.
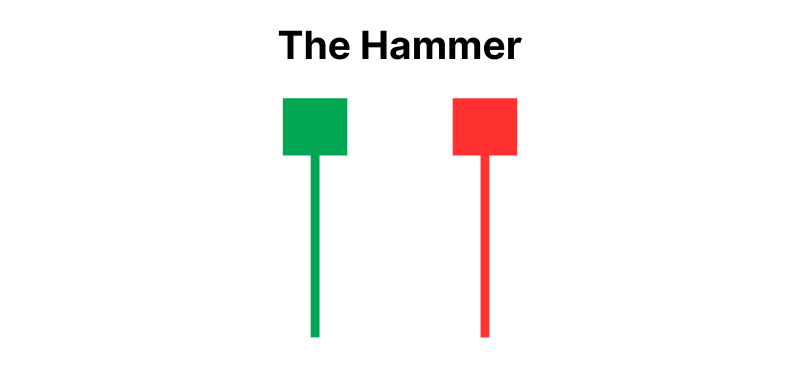
The long lower shadow indicates that, during the session, sellers were successful in driving price down. However, subsequent buying pressure forced price back up towards its opening level.
Consequently, when it appears after a downward movement in price, the hammer indicates that sellers may have lost control of the market, and we might be about to witness a bullish change in sentiment.
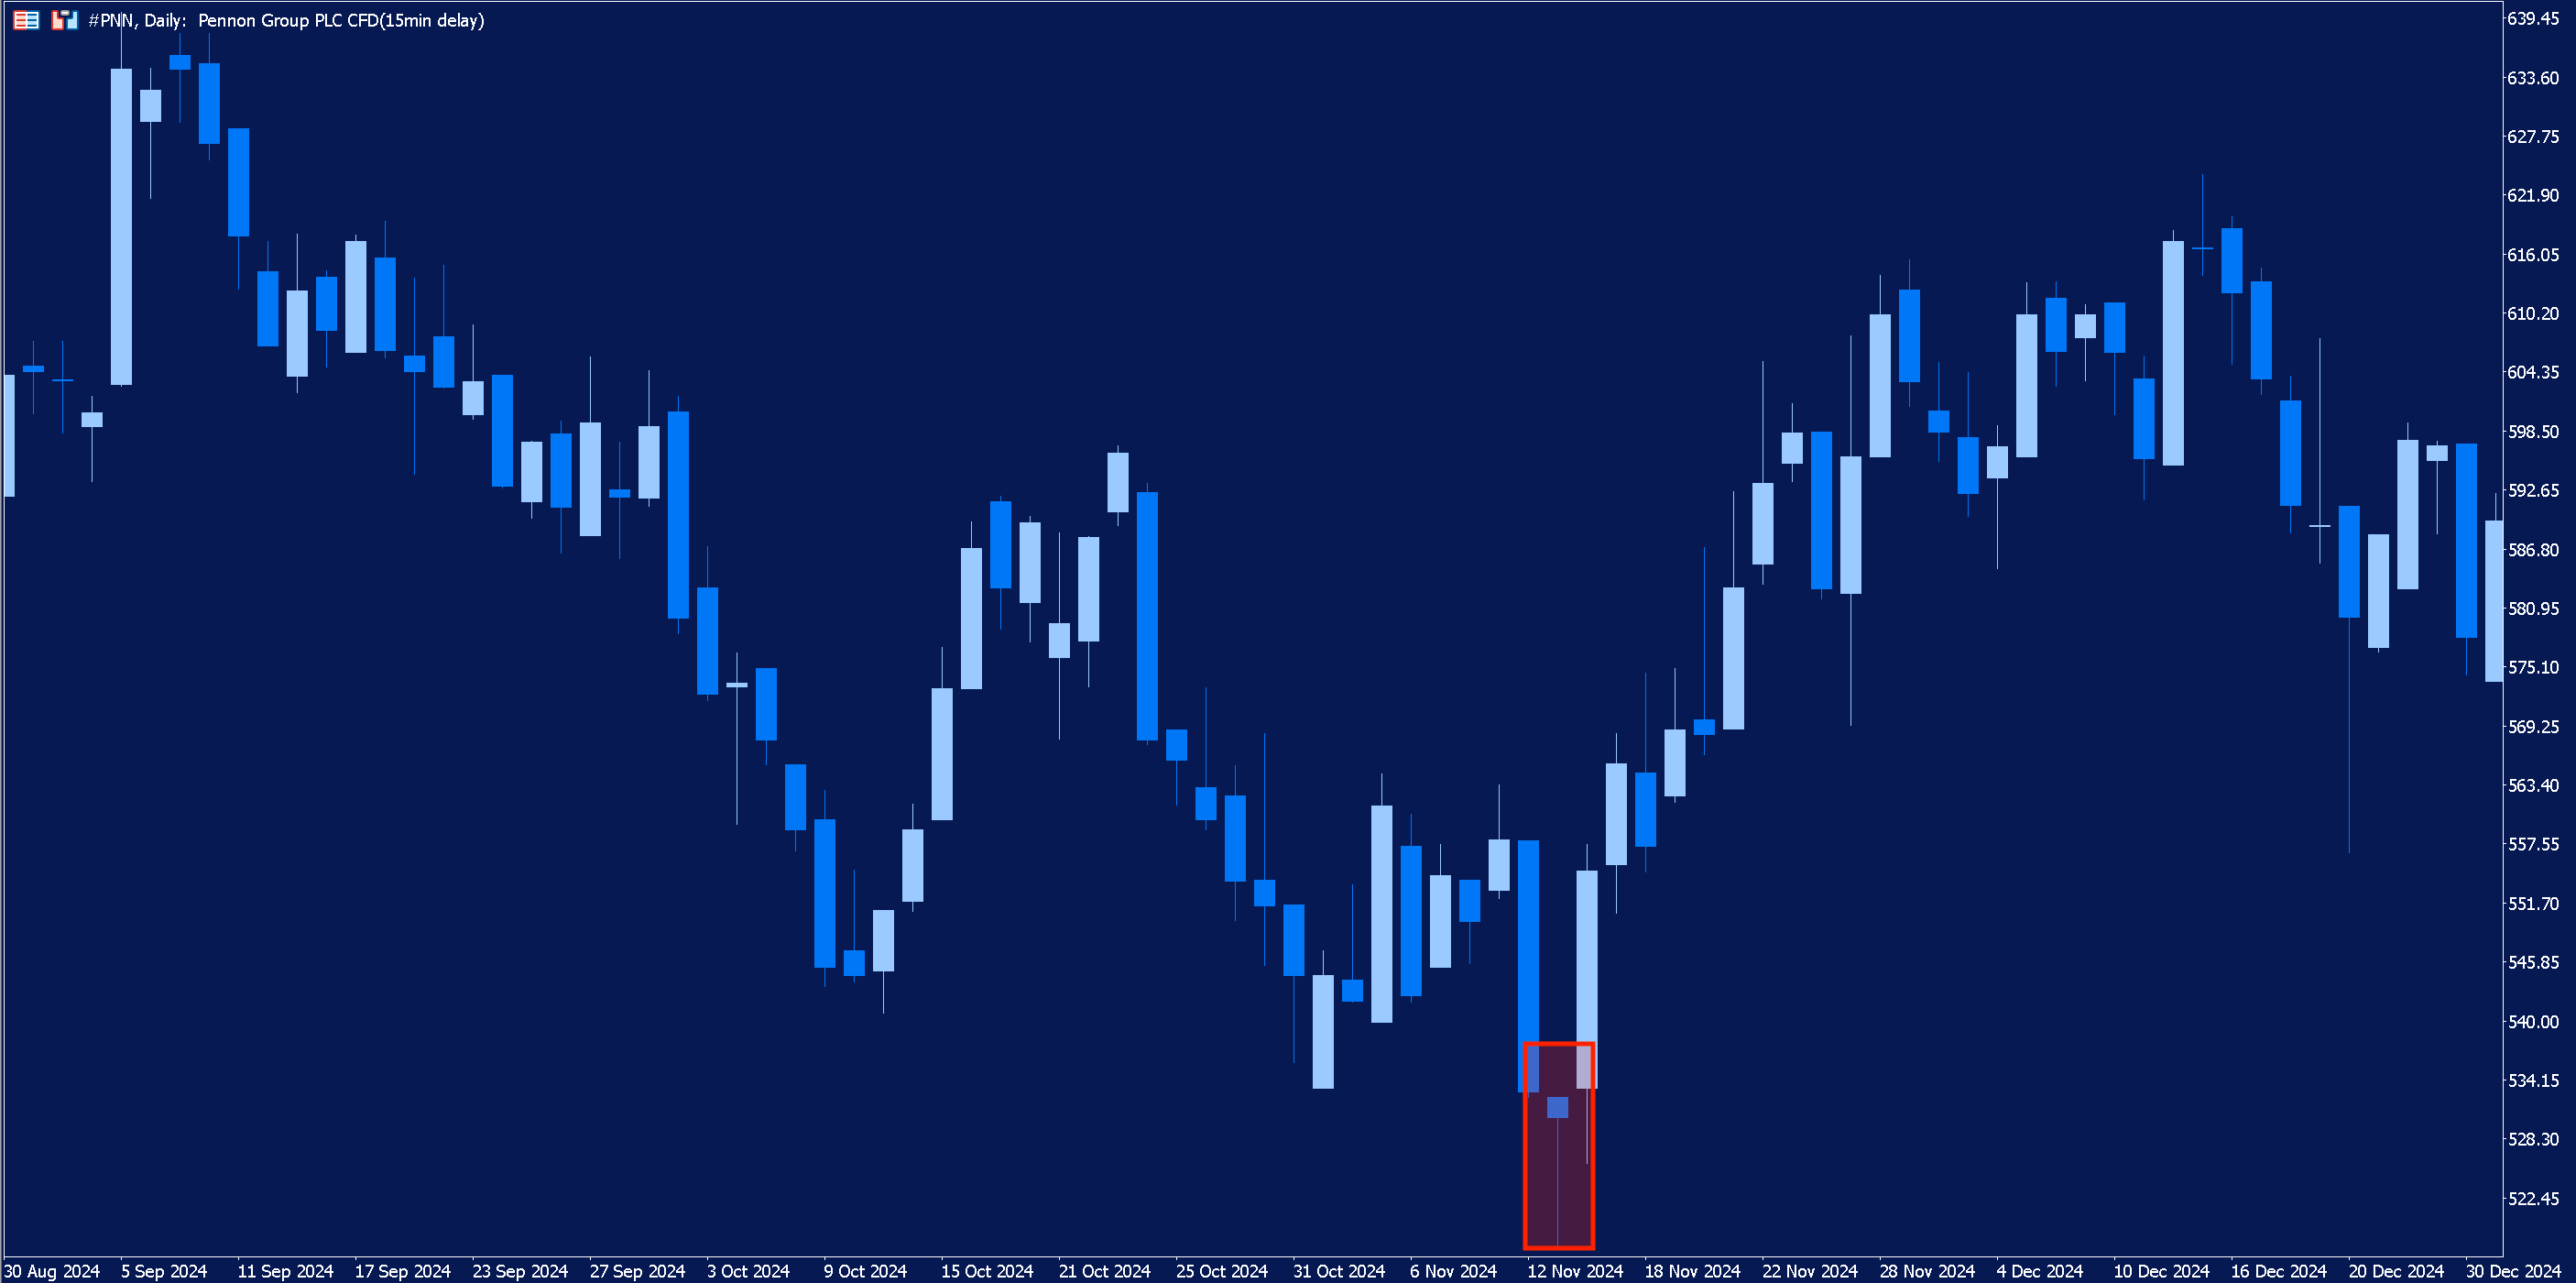
Above is a daily chart of UK utility stock Pennon Group. After a downward movement in price, a hammer candlestick appears. In this case, the hammer indicates the bottom of the downward movement in price and, following its appearance, price begins moving higher.
If trading this formation in real time, a prudent trader would look for additional evidence of an imminent price reversal. One of the ways in which this can be done is by using the Relative Strength Index (RSI).
The RSI can be used by traders to identify overbought and oversold levels in the market. It can also be used to spot divergences, which occur when the RSI and the asset’s price start moving in opposite directions and signal a potential reversal in price.
Below is the same chart of Pennon Group as before but, this time, we have added the RSI.
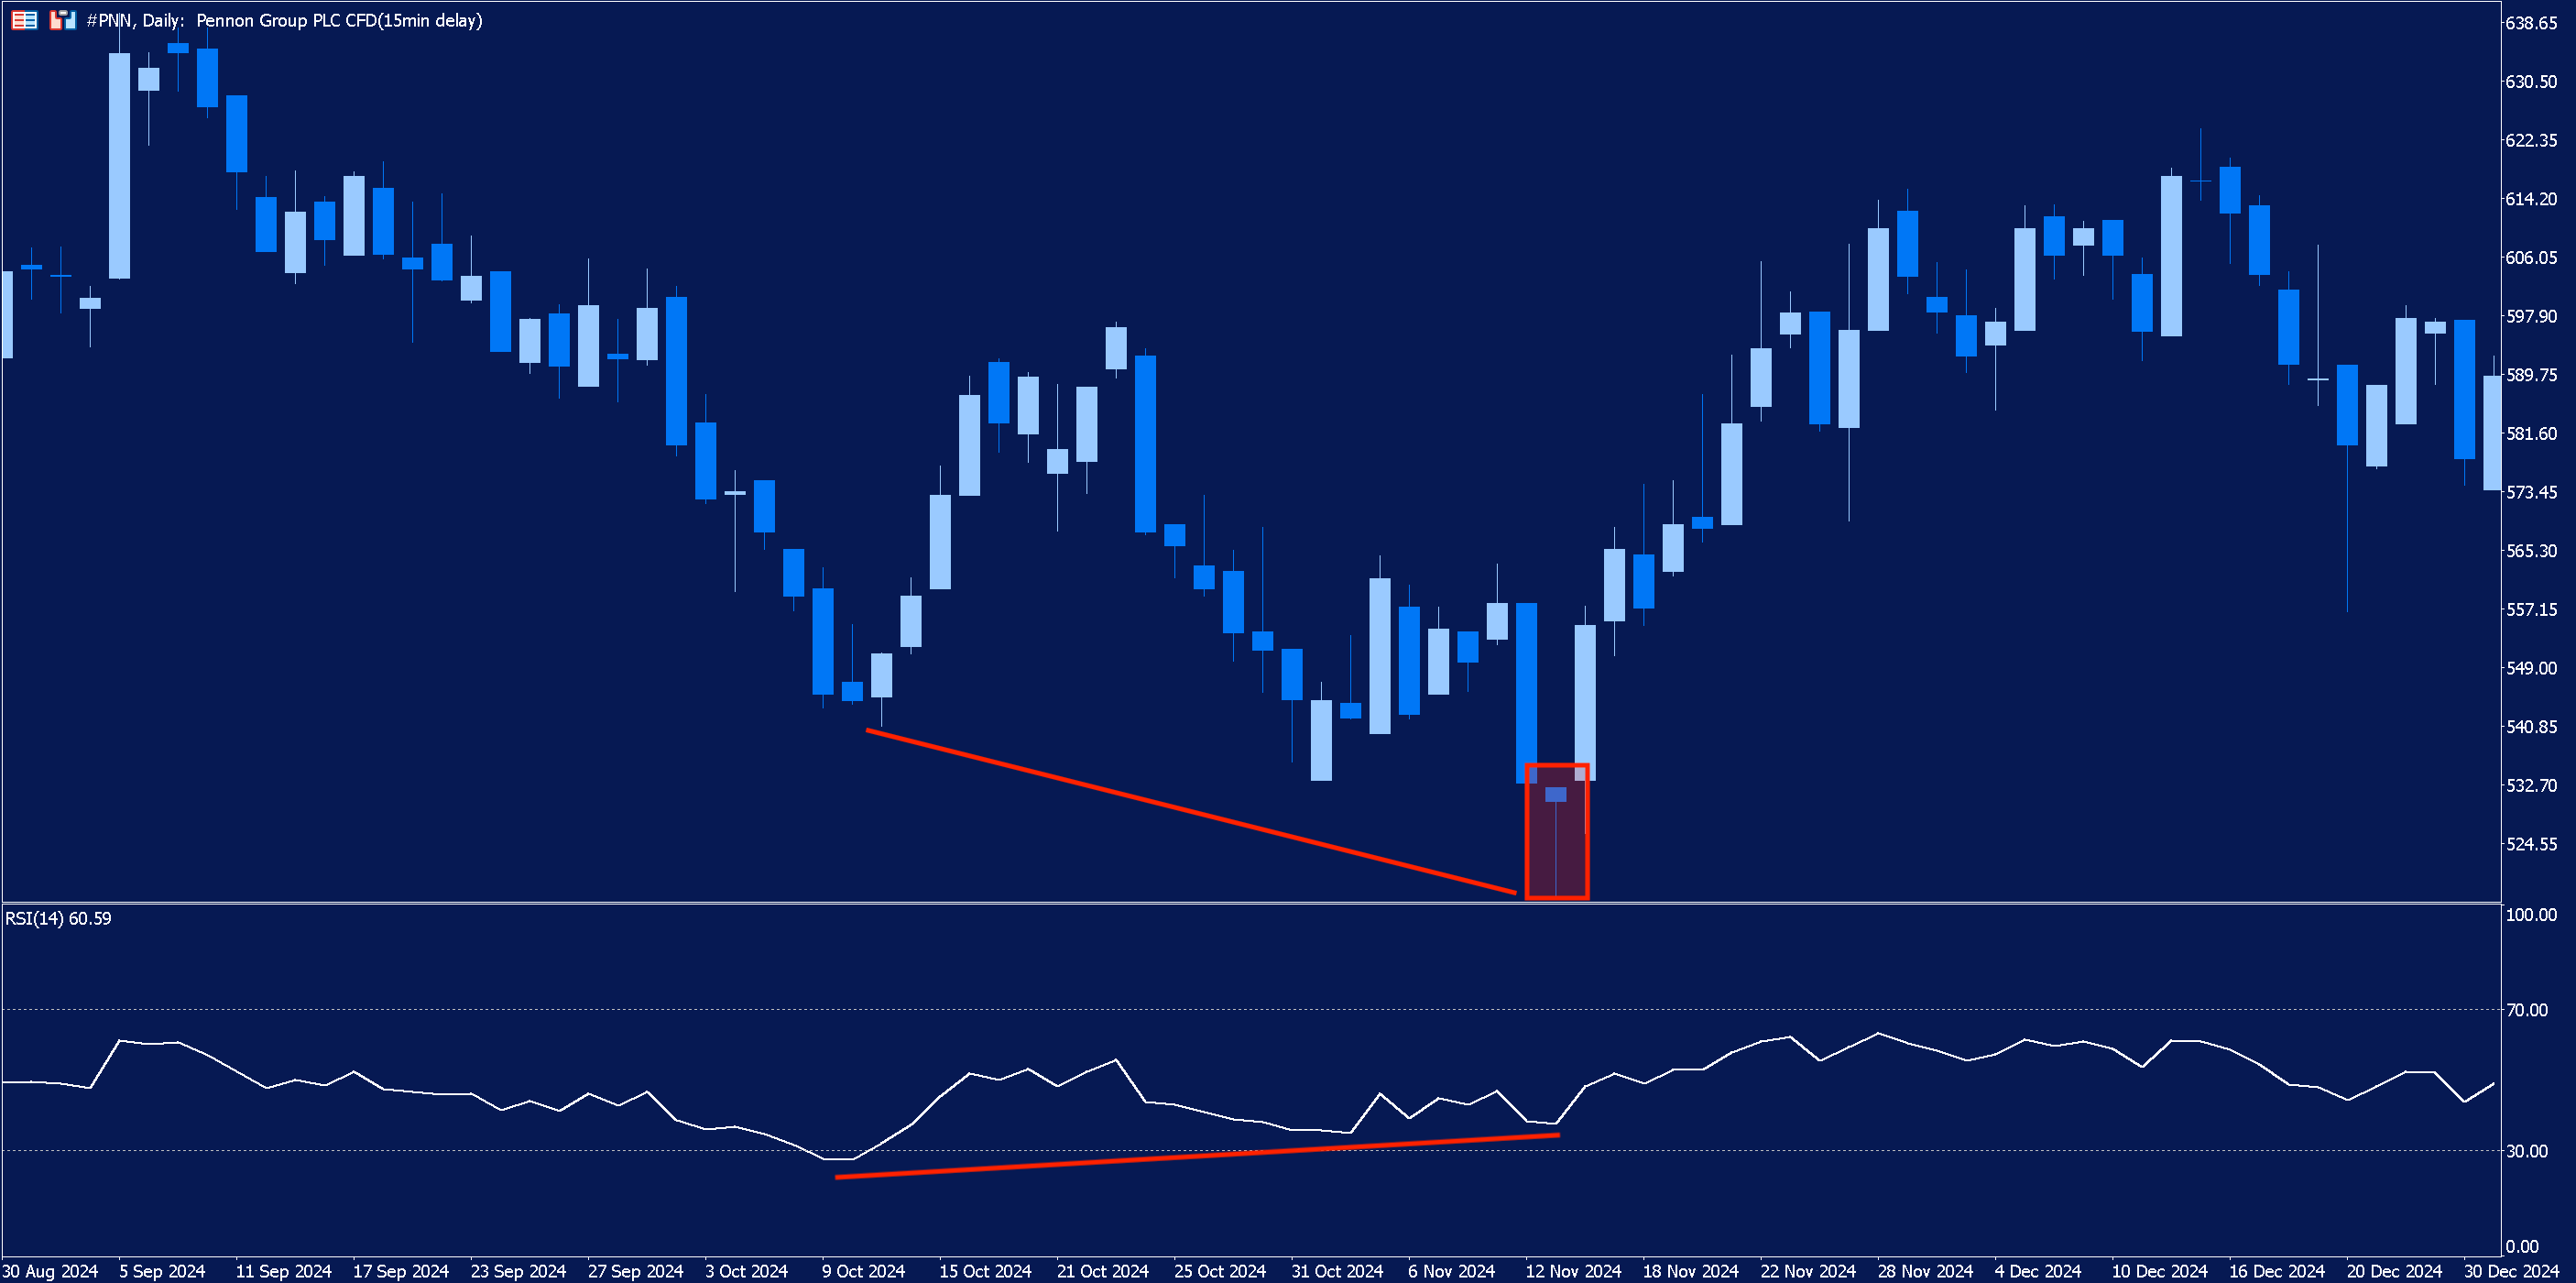
We can observe that, whilst share price is making lower lows, the RSI indicator starts making higher lows. This is an example of divergence and could be perceived by traders as additional evidence of a potential reversal.
A trader may choose to enter a trade based on this information. However, they may also wish to look for other signs of confirmation either by using multiple technical indicators or by analysing support and resistance levels or trading volume.
Swing Trading Evening Star Signals
The evening star is a candlestick pattern which consists of three candles and indicates a potential bearish reversal in price. Essentially, it is the opposite of the morning star pattern which we looked at earlier.
It is formed by a short-bodied candle sandwiched between a long bullish candle and a long bearish candle. The middle candle should gap up from the first candle, whilst the third candle should gap down and close below the midpoint of the first candle.
Swing trading is a style of trading which sees traders operate over the medium-term, typically holding positions anywhere from a few days up to several weeks. Swing traders might use the evening star pattern as a signal to either enter a short position or exit an existing long position.
Let’s look at an example. Below, is the weekly chart of FTSE 100 stock Pearson, in which we can observe the three candles characteristic of the evening star pattern.
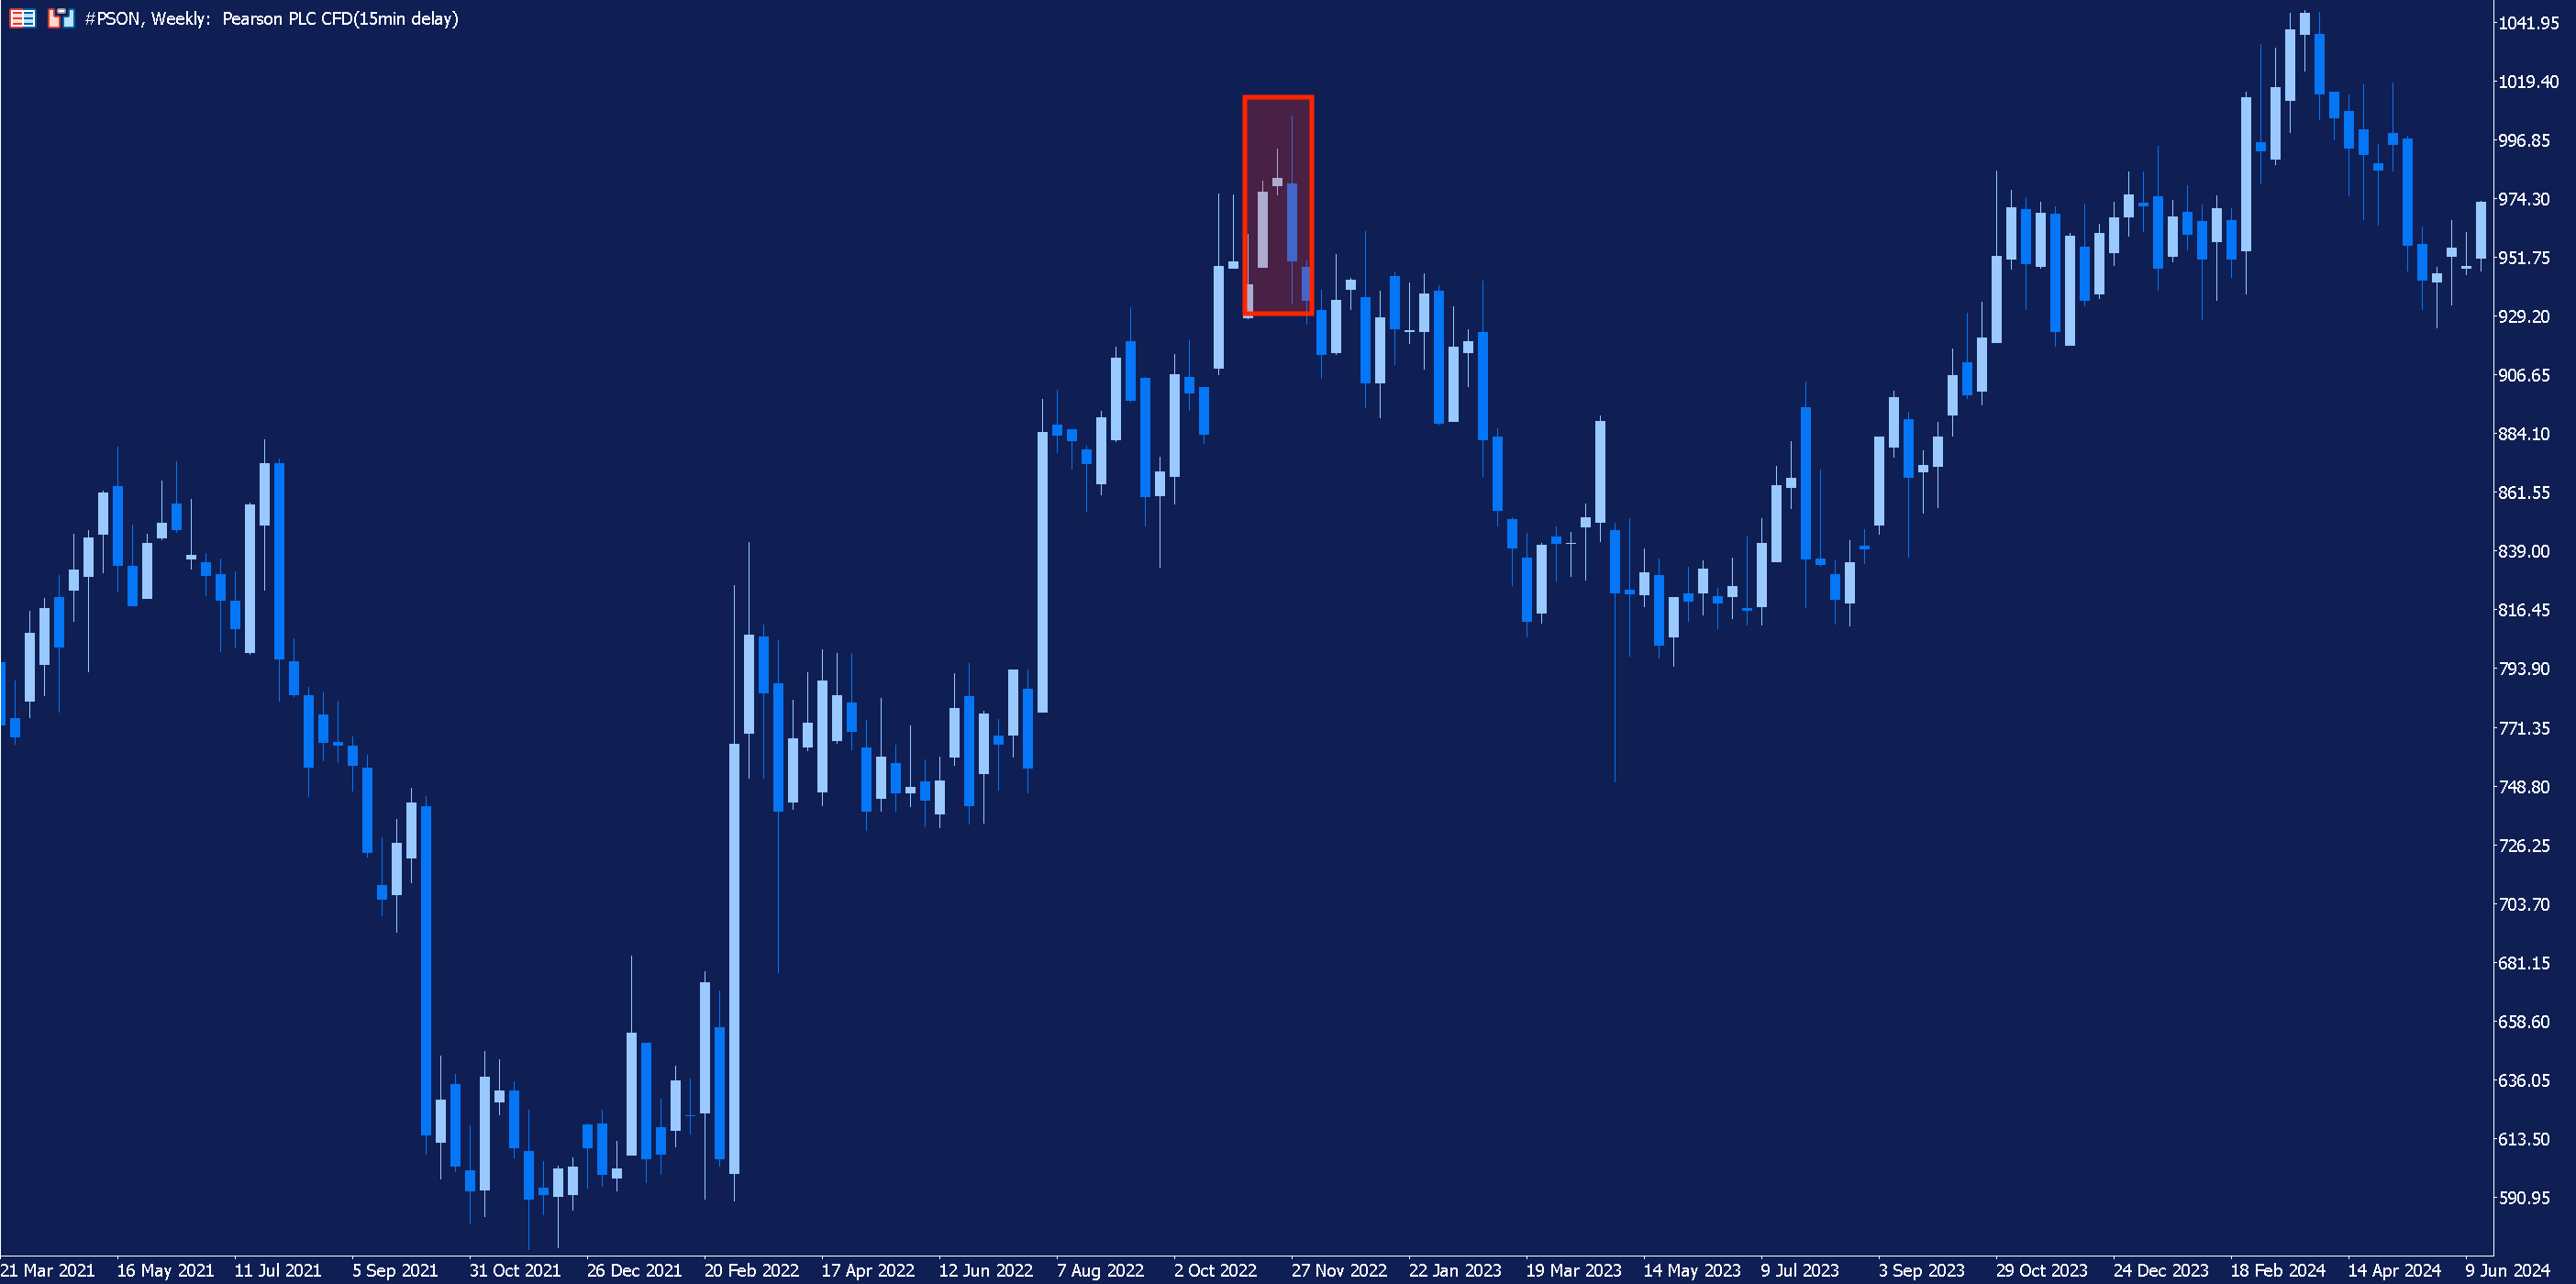
At the top of an upward movement in price, the evening star forms and is immediately followed by a downward movement which persists for around six months.
Rather than enter the market based solely on the appearance of the reversal pattern, a swing trader could have looked for additional confirmation using technical indicators. Instead of relying on just one indicator, more prudent traders may wish to consult multiple.
Below is the same weekly chart of Pearson. However, this time, we have added a Stochastic Oscillator and the Commodity Channel Index (CCI), both of which can be used to spot divergences.
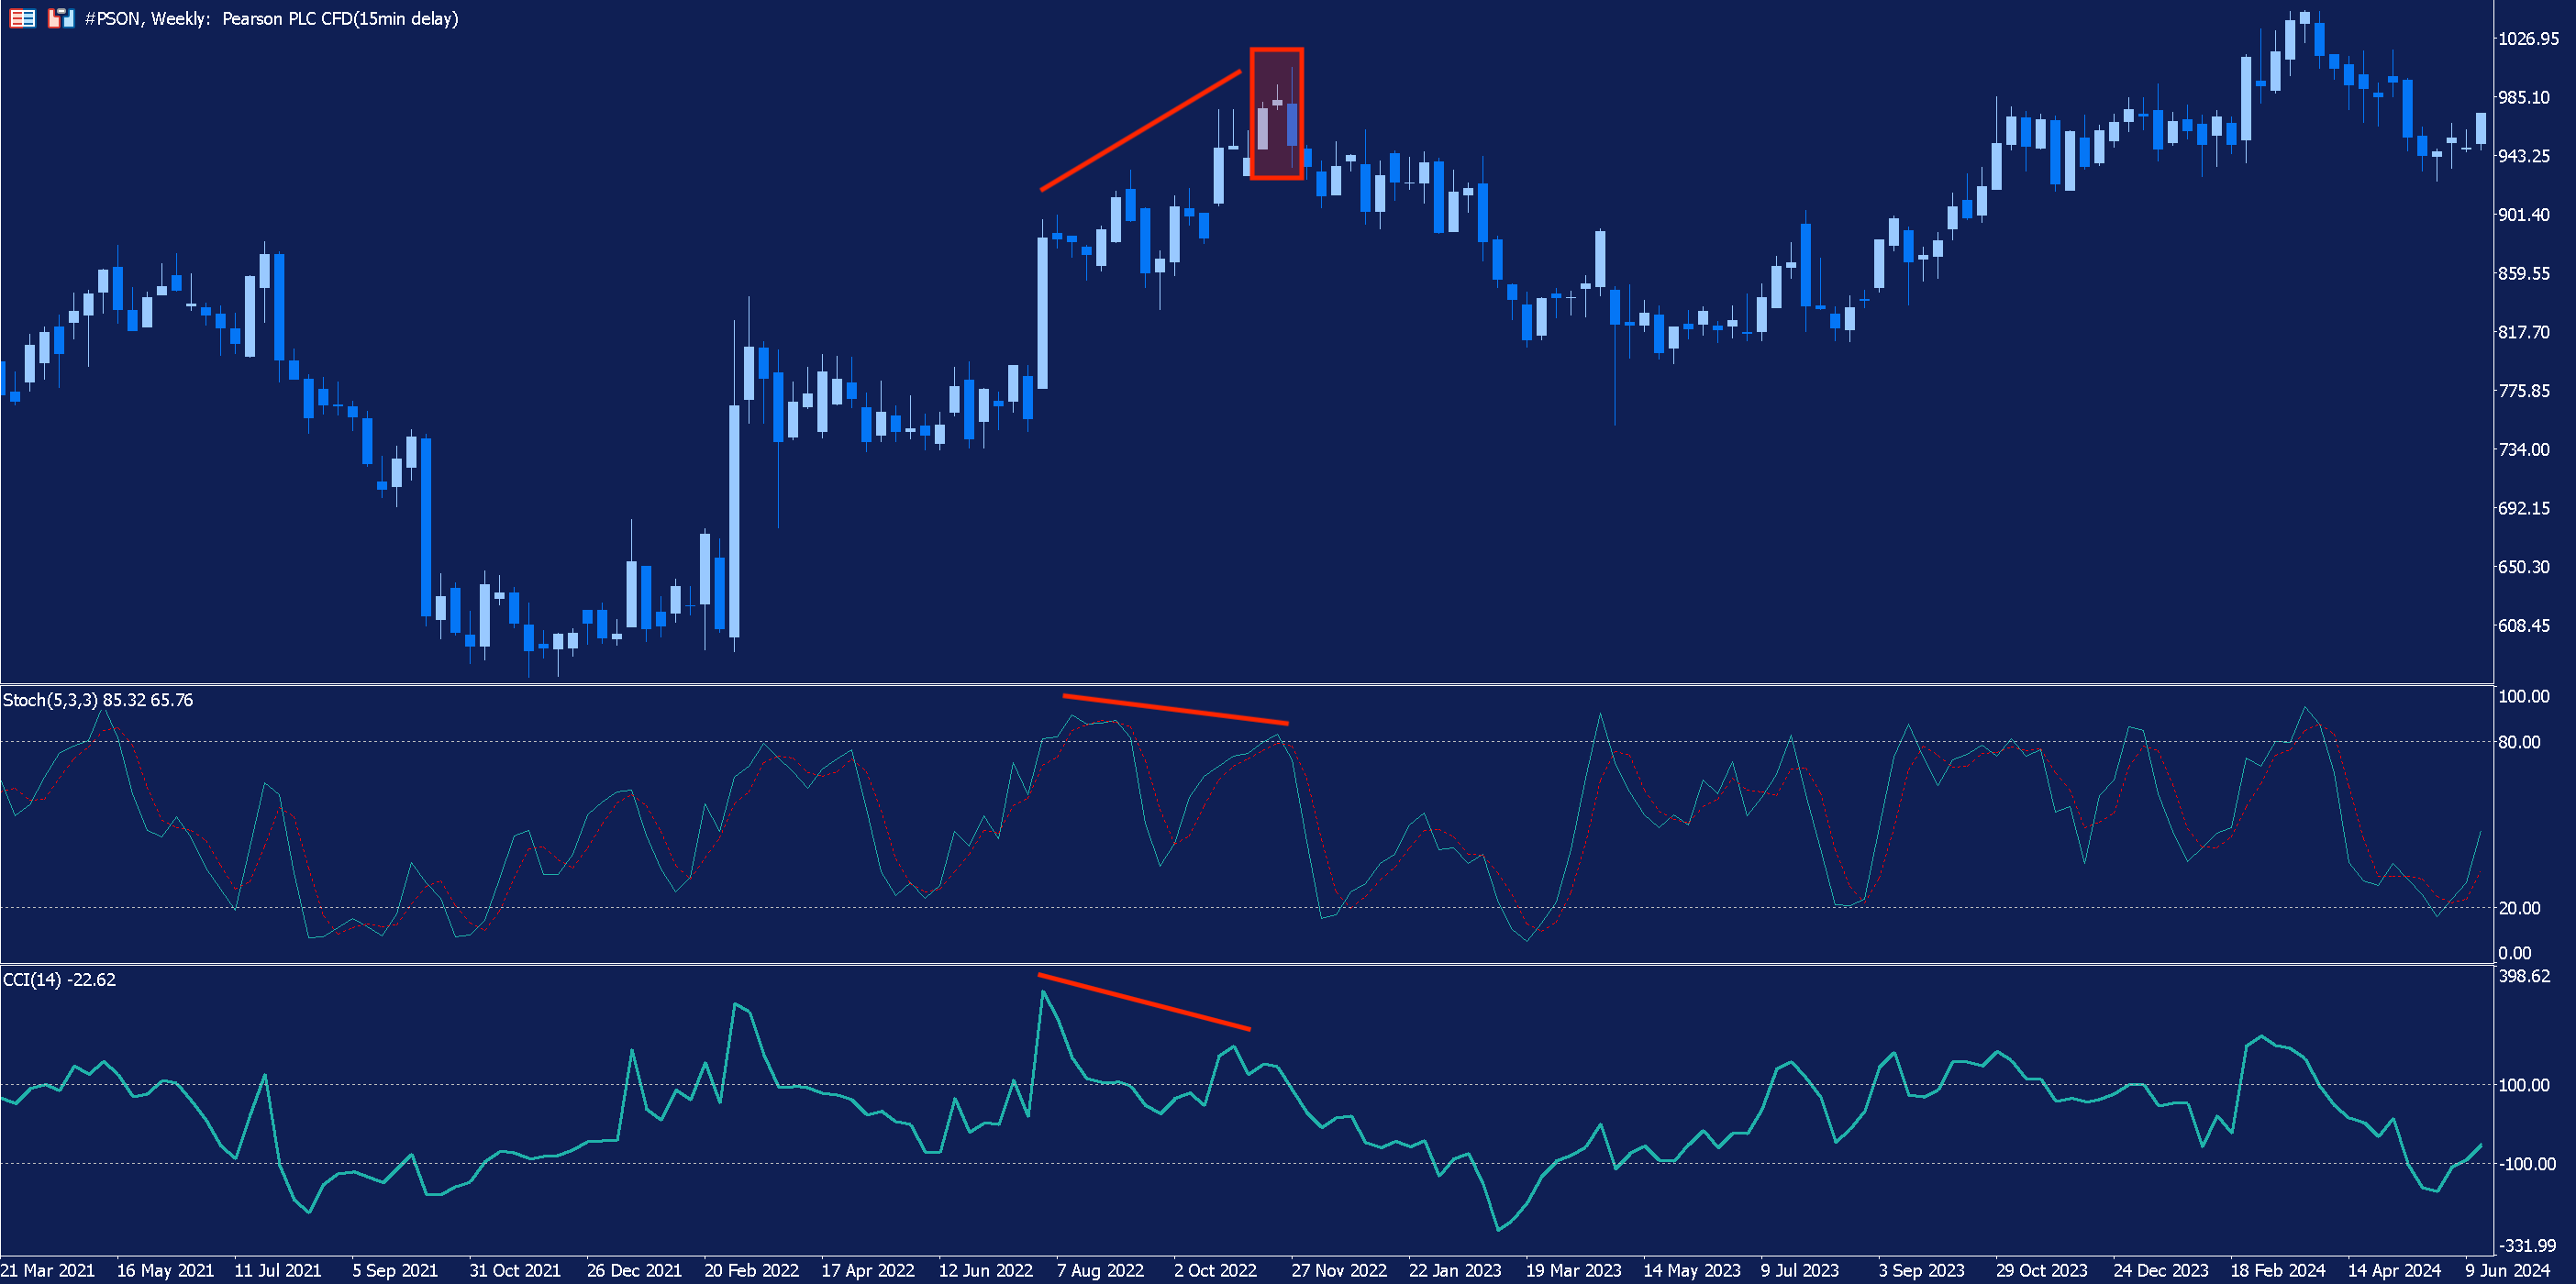
We can see that, in the buildup to the evening star, there is divergence between the two indicators and the Pearson share price.
Provided the trader was satisfied with this evidence, they may have chosen to initiate a short position in the market. Traders may wish to wait for a bearish candle to form after the pattern as further confirmation of a downward move, placing a stop loss above the high of the final candle in the pattern.
Risk Management
Reversal candlestick patterns can provide traders with a visual signal of shifting sentiment within the market. However, they will not produce valid signals every time they appear.
Consequently, traders should use other technical analysis tools, such as indicators, to look for additional clues of a potential reversal. But, even with this additional confirmation, candlestick patterns will produce false signals from time to time.
This is why it is absolutely crucial for traders to exercise proper risk management when trading. Among other things, traders should use a stop loss and never risk too much on any one trade by using appropriate position sizes.
Interested in learning more about technical analysis and candlestick patterns? At Admirals, we have a range of educational articles covering a wide range of topics, including a section dedicated entirely to different candlestick patterns. Click the banner below to browse our article library.

Implementing Patterns on UK Trading Platforms
Traders who choose Admirals benefit from access to both the MetaTrader 4 (MT4) and MetaTrader 5 (MT5) trading platforms.
Both of these popular trading platforms provide a wide range of technical analysis capabilities to help traders implement trading strategies involving reversal candlestick patterns.
Charting Tools for Technical Analysis
Both MT4 and MT5 come with a variety of technical indicators as standard, including all the indicators used in the examples throughout this article.
However, clients of Admirals can also supercharge their experience by downloading the MetaTrader Supreme Edition (MTSE) and/or the MetaTrader Research Terminal.
MTSE provides traders with a range of additional technical indicators and other handy tools to enhance your trading experience, such as the Trade Terminal, Mini Terminal and a trading simulator.
The Research Terminal comes with a number of insightful tools to assist traders in their research and analysis, including a screener tool which can be used to scan stocks, indices and Forex pairs for important technical events.
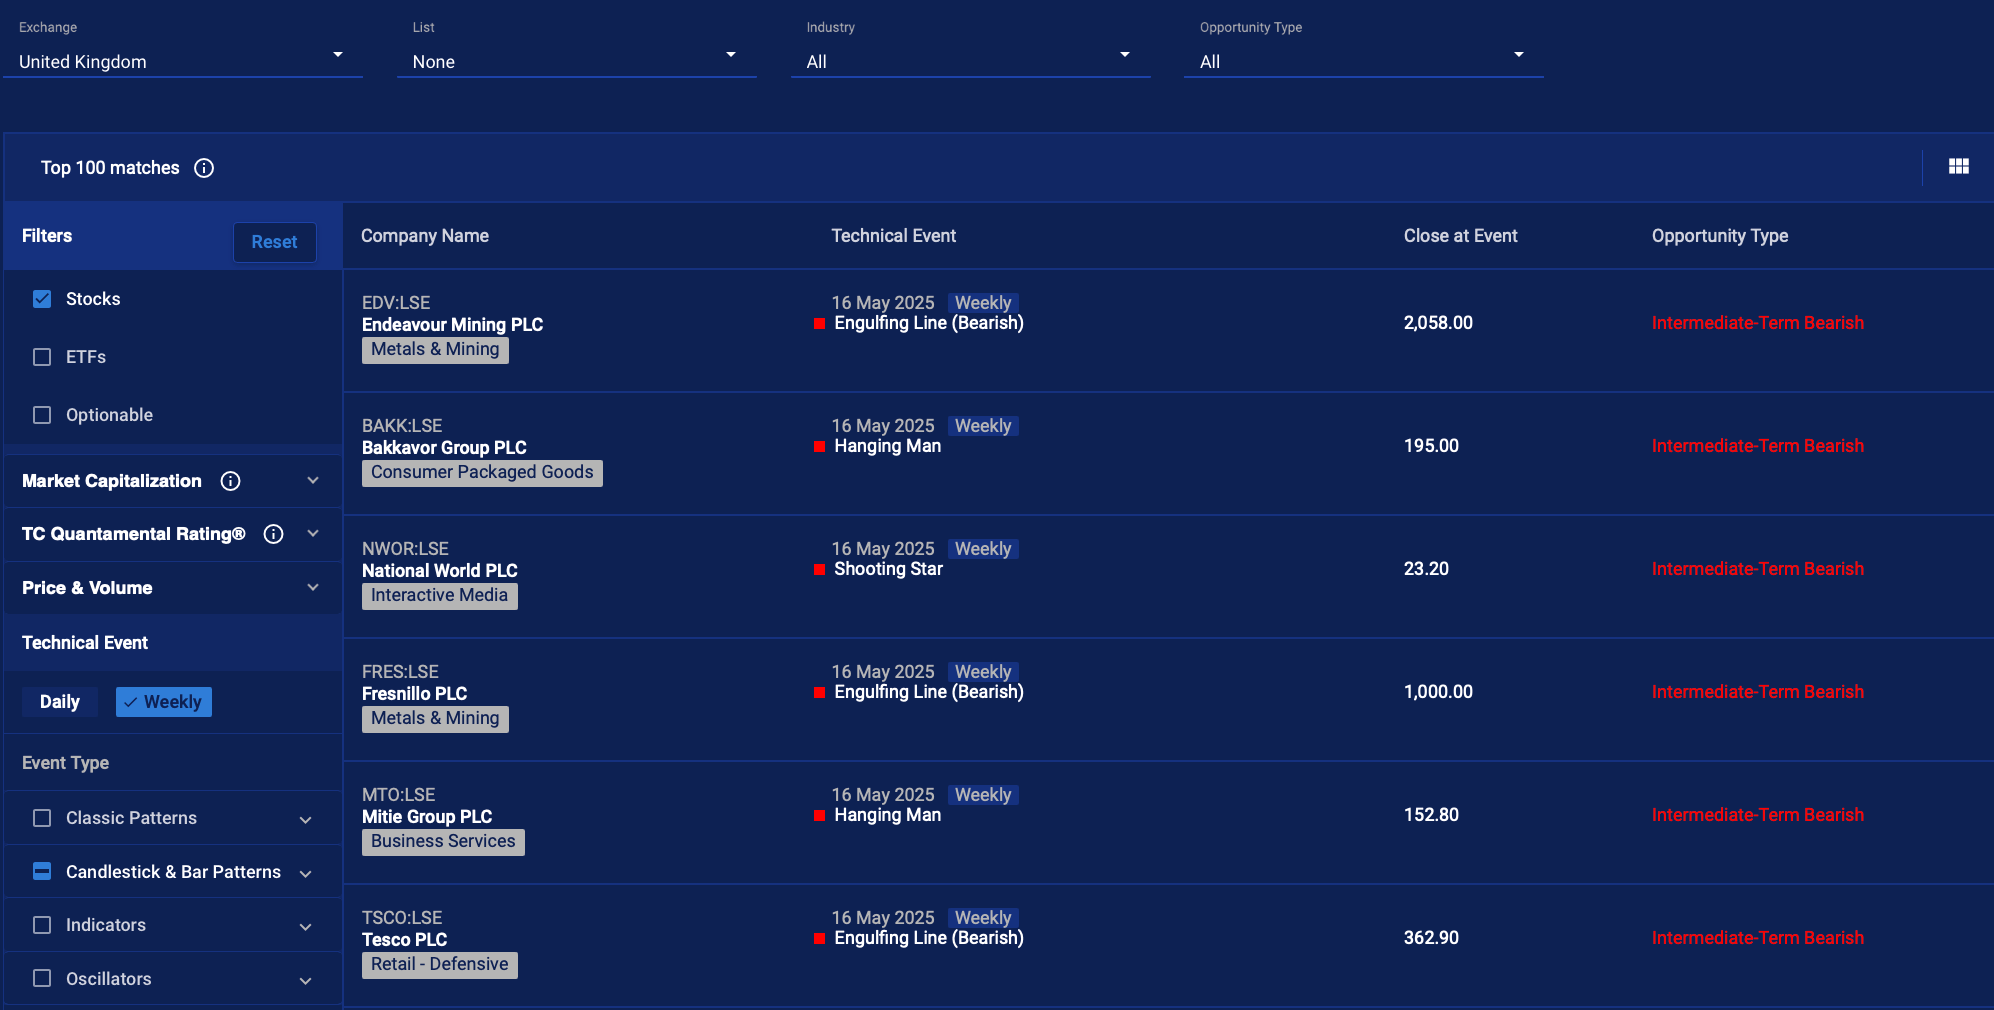
The screener can be filtered to identify candlestick patterns specifically in UK stocks.
Backtesting Strategies with Historical Data
Once a trader has constructed a strategy for trading reversal candlestick patterns, they might choose to go back through historical price charts, identify instances where these patterns have appeared and backtest their strategy to see how it would have hypothetically fared.
Backtesting can provide insight into how effective a strategy might be on the live markets. Traders can use this information to help finetune their strategies or, perhaps, to realise that a strategy is not worth pursuing on the live market.
Of course, it’s important to note that past performance is not a reliable indicator of future results. Just because a strategy would have worked well in the past, it does not guarantee it will continue to do so in the future.
Start Trading with MetaTrader 5
Clients of Admirals benefit from access to MetaTrader 5, one of the world’s most popular trading platforms. MT5 offers advanced charting and trading tools and access to a wide range of financial markets. Click the banner below to start your download:

Common Mistakes to Avoid When Trading Reversal Patterns
Whilst reversal candlestick patterns can serve as useful indicators in identifying shifting market sentiment, they can often be misused by traders. Below, we have listed some common mistakes traders should try and avoid when trading reversal patterns.
-
Not Confirming the Signal
- Traders should avoid using reversal candlestick patterns in isolation. The far more prudent approach to use confirmation techniques to try and validate what the candlestick pattern is telling you. This can help filter out false signals.
-
Poor Risk Management
- We’ve already covered risk management, but it’s importance can’t be overstated. Failure to use stop losses or sensible position sizing can exacerbate losses when the market moves against you.
-
Ignoring Market Context
- Market context is important. Reversal candlestick patterns are typically considered to signal potential reversals if they appear following a noticeable uptrend or downtrend (depending on the pattern in question). If these patterns occur in a choppy or sideways moving market, their signals may not be as effective.
Additional Confirmation Techniques for Increased Accuracy
We have already covered the importance of looking for additional confirmation when trading candlestick patterns. In the following sections, let’s take a look at some additional techniques.
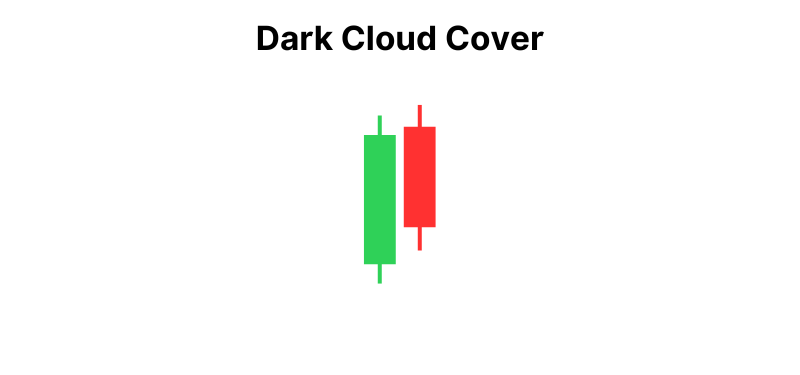
Combining Dark Cloud Cover with Moving Averages
The dark cloud cover pattern consists of two candles which typically appears after an upward movement in price and signals a potential bearish reversal.
The first candle is bullish, with a long body. The second candle gaps higher but then turns bearish and closes below the midpoint of the first candle.
We already saw earlier how day traders might combine a moving average with reversal candlestick patterns to help identify entry point whilst trading with the trend.
The same indicator could also be used by traders, in conjunction with other methods, to look for additional confirmation of a reversal in price.
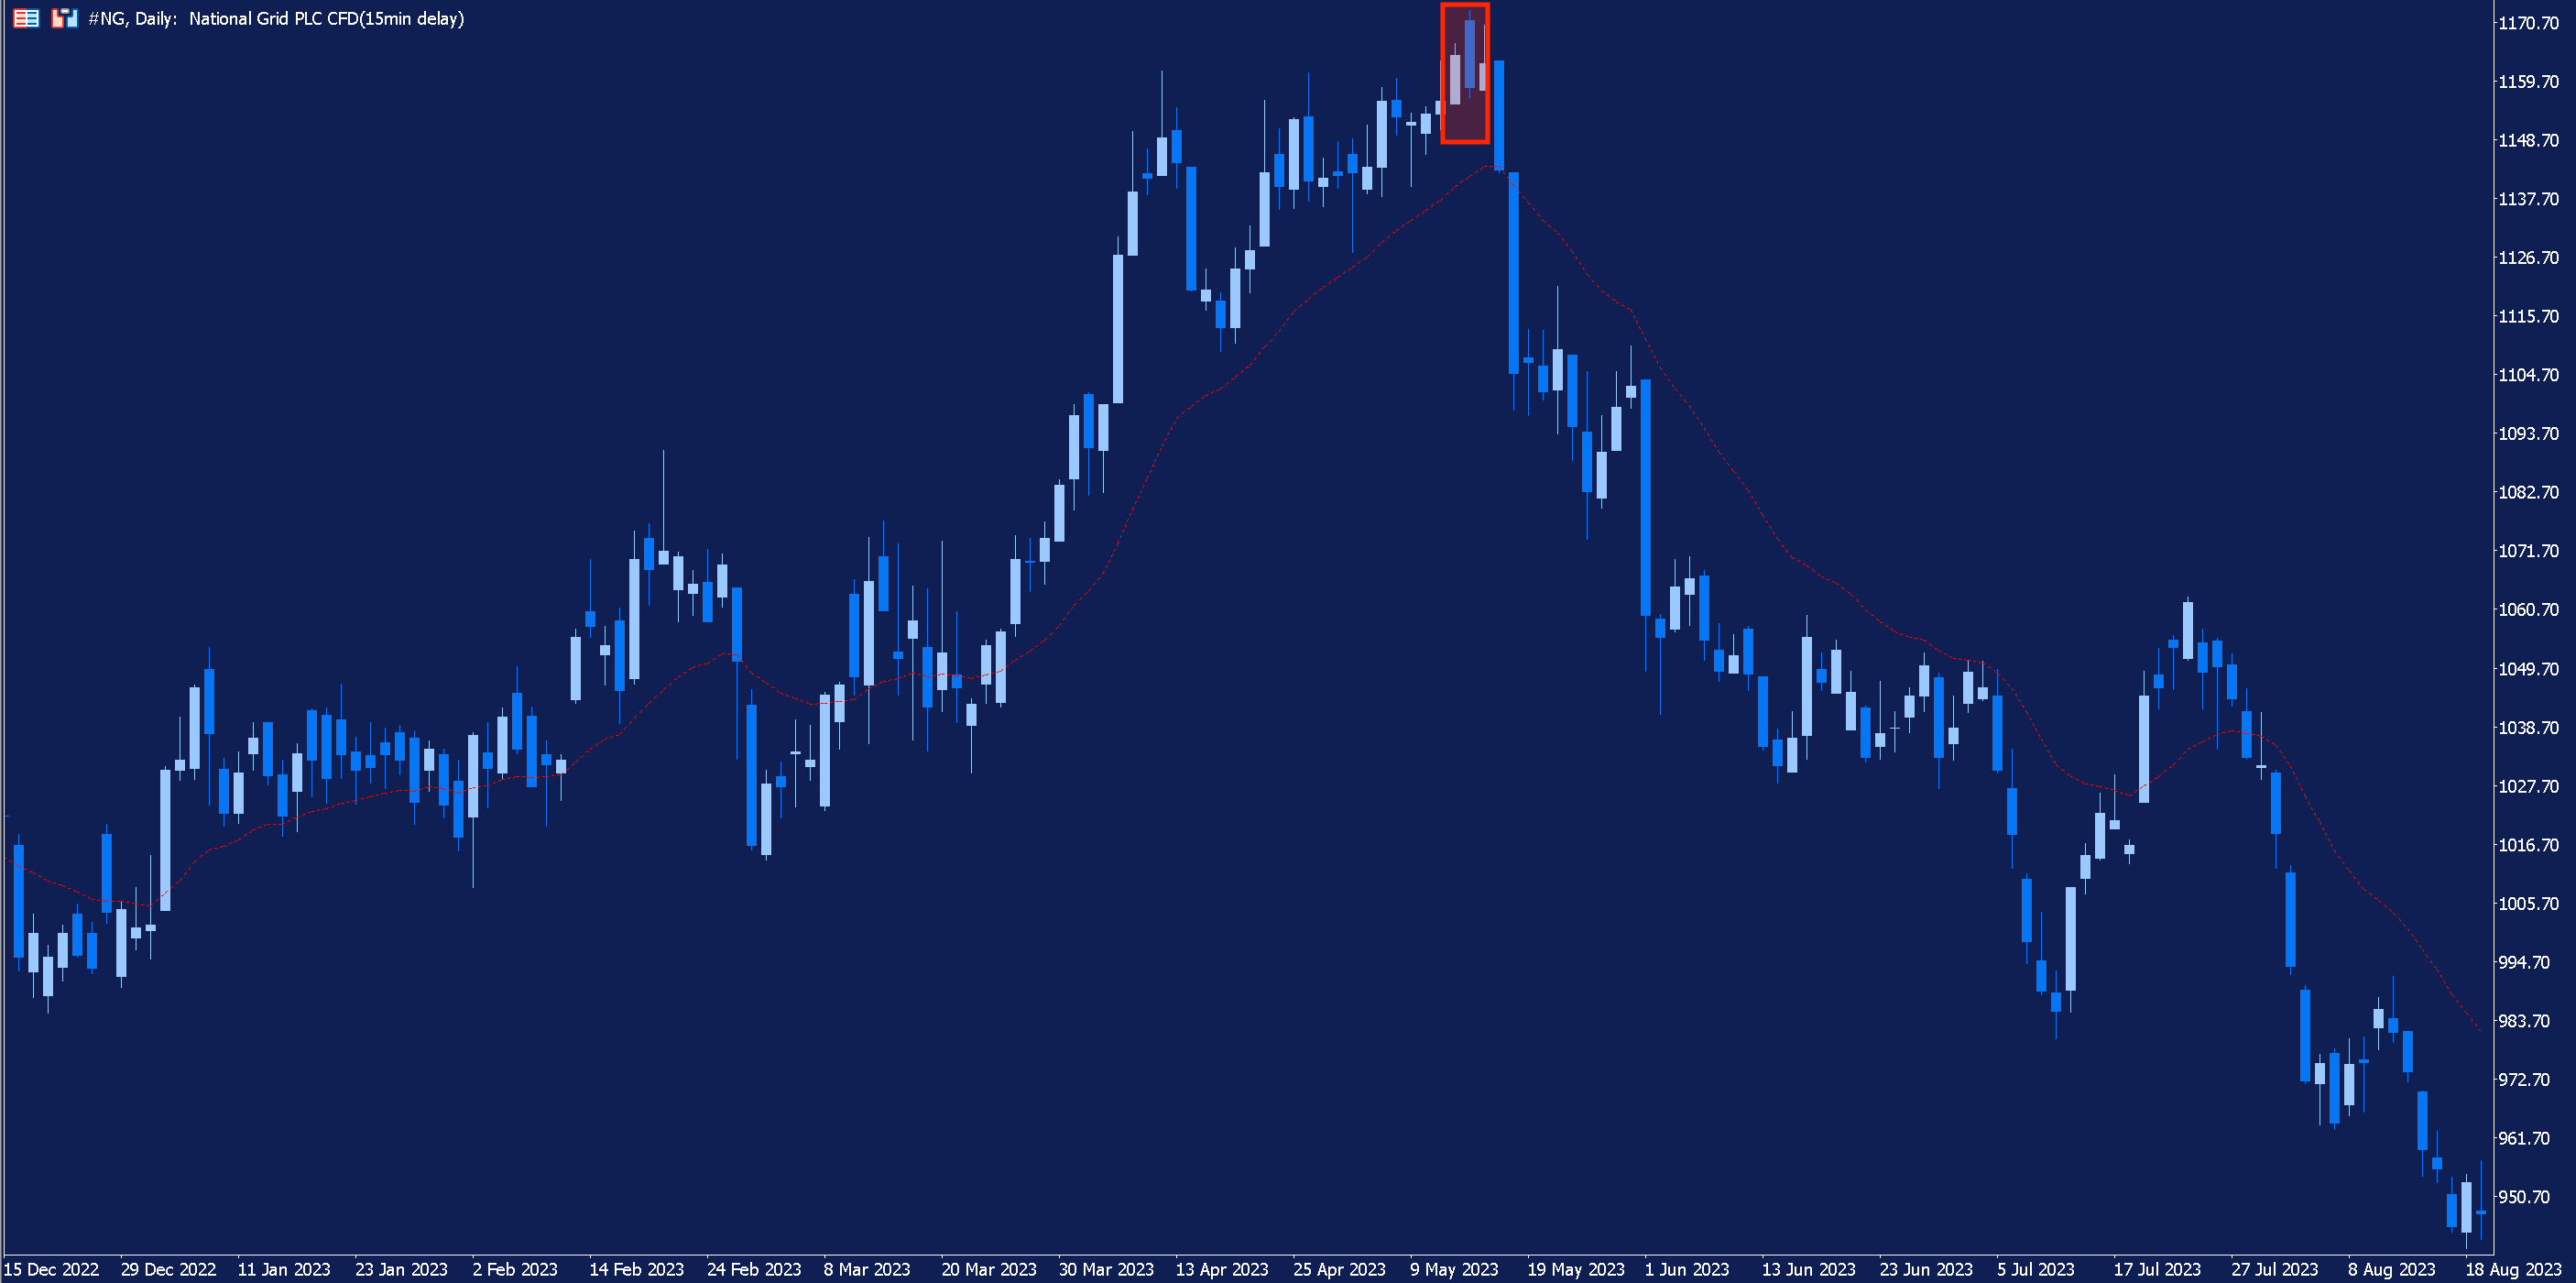
Above is a daily chart of UK utility stock National Grid, with a 20-period exponential moving average (EMA) added and a dark cloud cover pattern highlighted.
In the build-up to the formation of the candlestick pattern, the EMA is moving higher and share price remained above it. This signifies that an uptrend is in progress. At the top of that uptrend, the two candles characteristic of the dark cloud cover pattern appear but, for the moment, price remains above the EMA.
In addition with other analysis, traders may wait for share price to close decisively below the EMA before considering taking a short position in the market, as this could serve as additional evidence that a reversal is taking place.
Volume Analysis for Piercing Line Validations
Traders can also use volume analysis to help assess the validity of a reversal candlestick patterns, such as the piercing line.
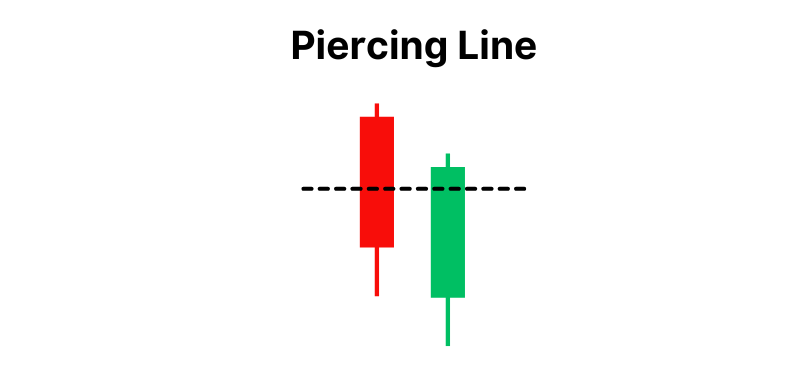
The piercing line is essentially the opposite of the dark cloud cover, which we examined in the last section.
After a downward movement in price, a long bodied bearish candle is followed by a bullish candle, which gaps lower before closing above the midpoint of the first candle, as in the image below.
Typically speaking, if trading volume significantly increases during the second candle of the piercing line it may be viewed as strengthening the signal. The logic here is that increased trading volume suggests more participants are entering the market, supporting the potential change in sentiment.
In a centralised market, such as the stock market, traders can access real volume data to help conduct their volume analysis. Let's take a look at an example in the UK stock market, where actual volume data is available.
Traders using MetaTrader 5 can add volume data to a share price chart by right-clicking on the chart and selecting 'Volumes'. For UK-listed stocks, traders can also find detailed trading volume data on the relevant instrument page of the London Stock Exchange website.
Below is a weekly chart of FTSE 250 stock Clarkson, the green bars at the bottom of the chart indicate trading volume.
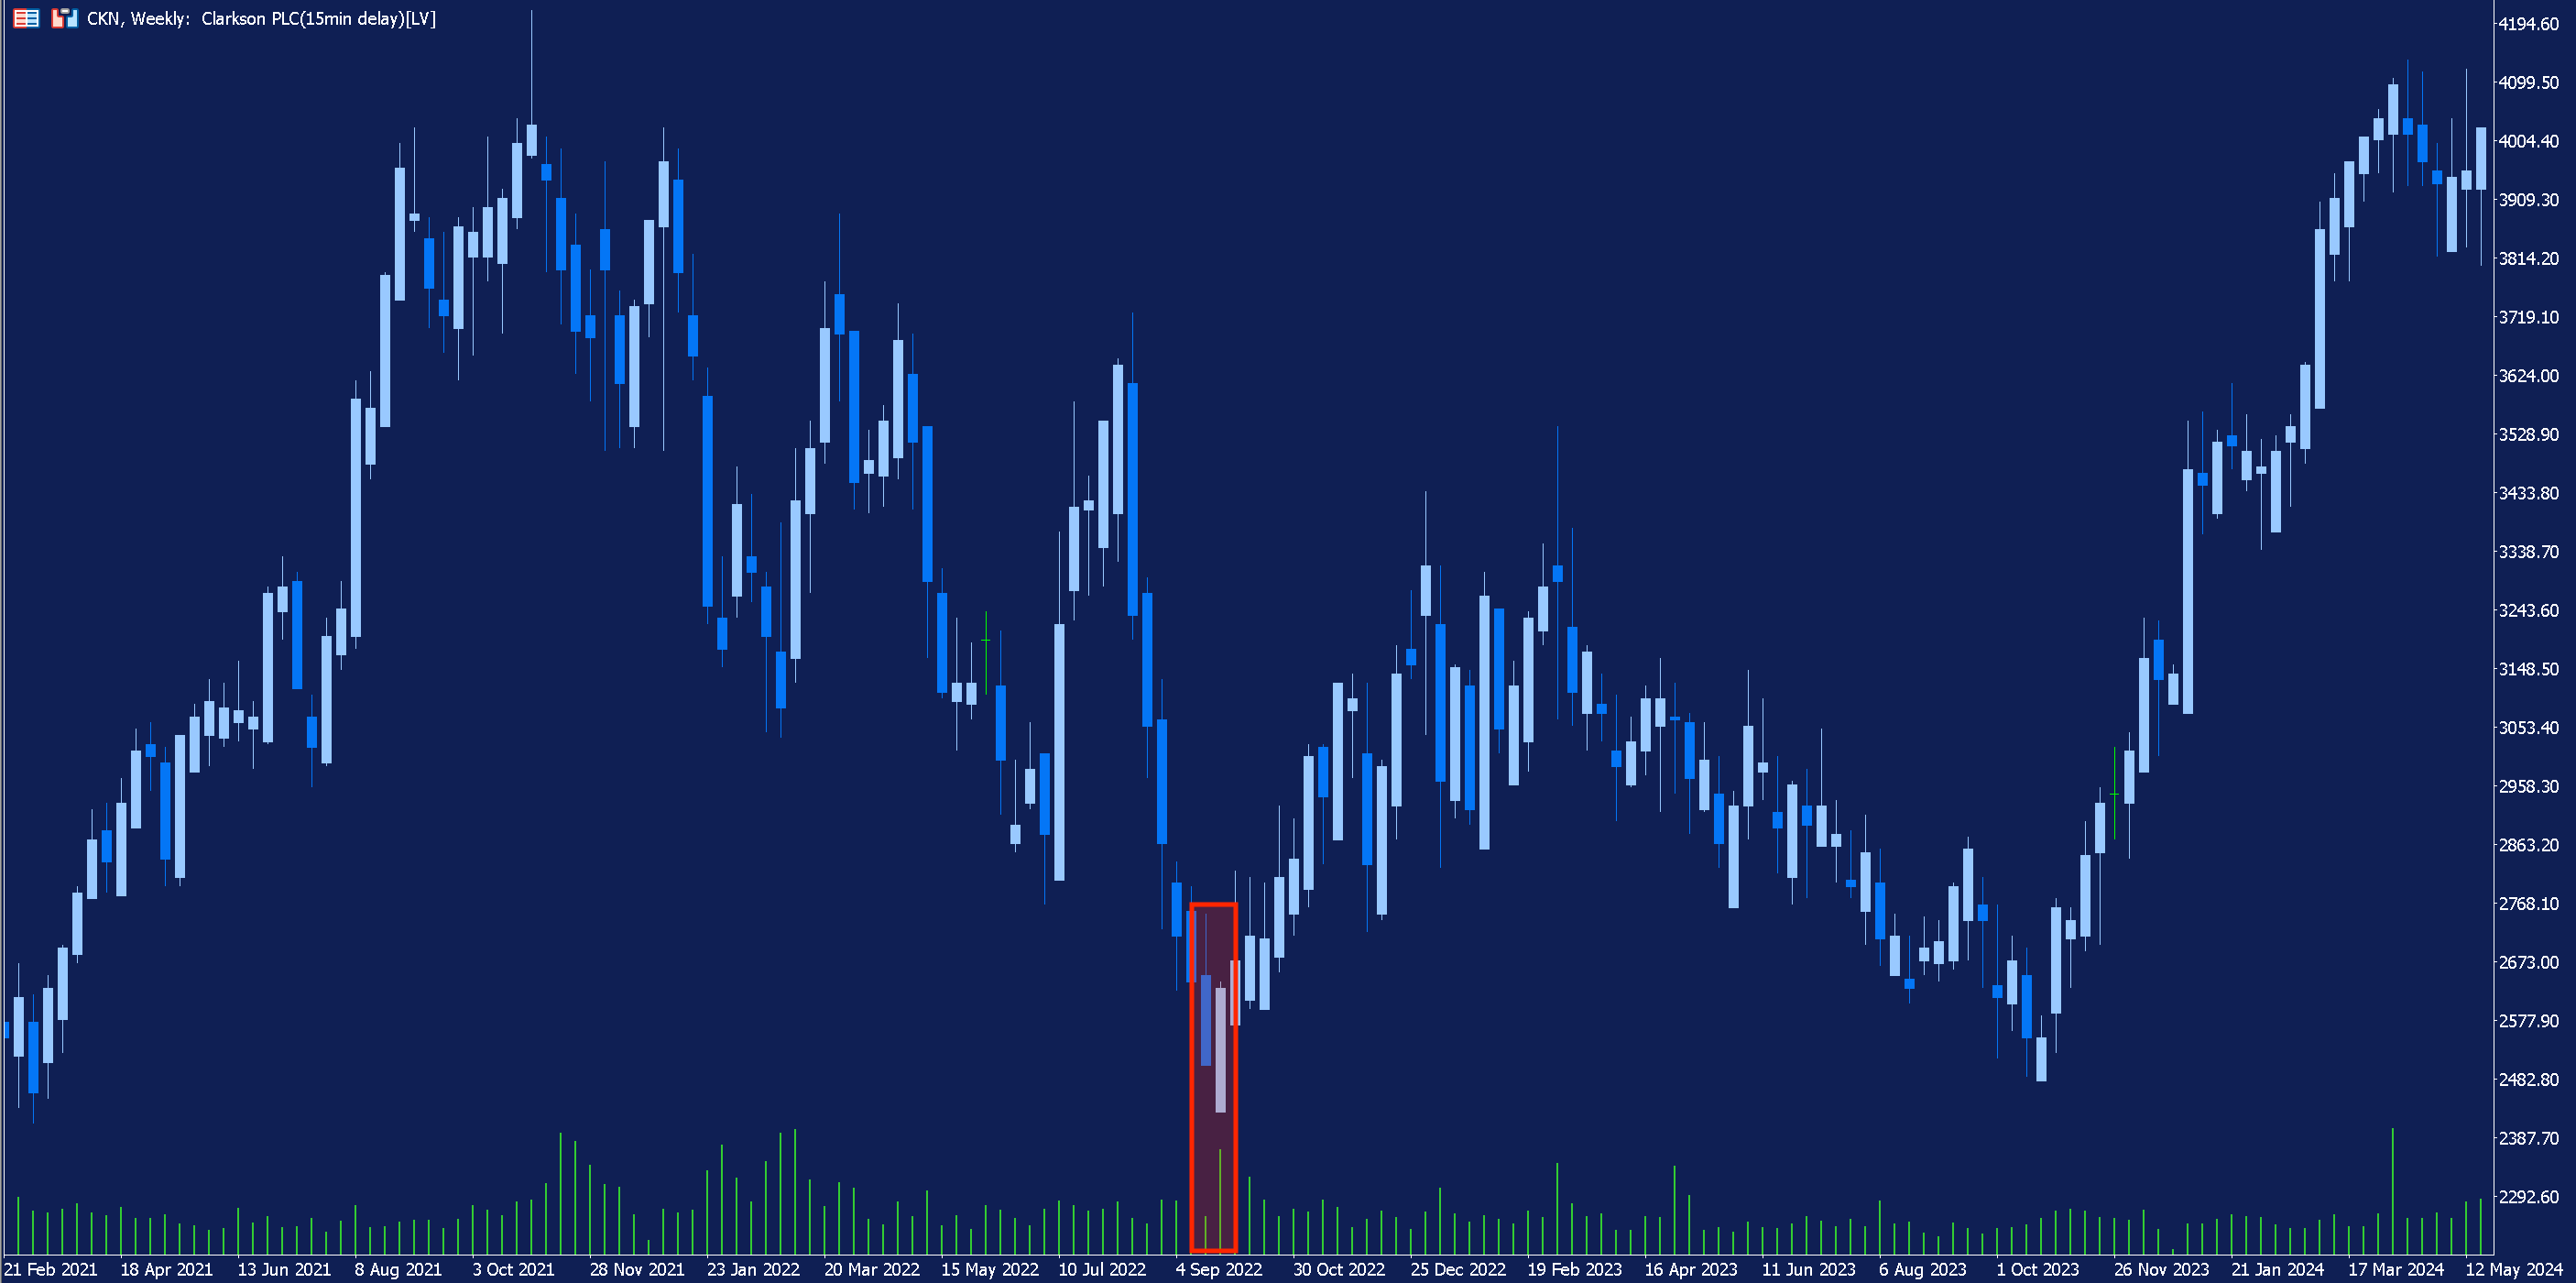
In the chart, the piercing line candlestick pattern has been highlighted. It appears after a downward price movement and is followed by an upward movement which lasts for several months.
Look at the volume bars at the bottom of the chart. You will note that the second candle of the piercing line pattern coincides with a jump in trading volume.
Unlike the stock market, a decentralised market, such as the Forex market, lacks concrete volume data. Nevertheless, in decentralised markets, traders can analyse tick volume, which is based on the number of price changes that occur within a certain time period.
Unlike volume measurements which count the number of shares or contracts traded within a specified period, tick volume measures the frequency of price changes.
This certainly has its limitations but - in a decentralised market, where volume data is not recorded - it can serve as an alternative to actual volume. There are also a number of volume based technical indicators, such as the On Balance Volume (OBV) indicator which can help traders can use to assess volume.
Conclusion
Reversal candlestick patterns can help traders spot turning points in the market caused by shifting sentiment. However, it’s important for traders to seek additional confirmation of a price reversal before entering the market.
Traders can seek additional evidence of a reversal in price by using technical indicators, analysing historic support and resistance levels and assessing changes in trading volume.
If you’re interested in learning more about technical analysis and other trading and investing topics, why not explore the wide array of educational articles on our website? Click the banner below to get started:
INFORMATION ABOUT ANALYTICAL MATERIALS:
The given data provides additional information regarding all analysis, estimates, prognosis, forecasts, market reviews, weekly outlooks or other similar assessments or information (hereinafter “Analysis”) published on the websites of Admirals' investment firms operating under the Admirals trademark (hereinafter “Admirals”). Before making any investment decisions please pay close attention to the following:
- This is a marketing communication. The content is published for informative purposes only and is in no way to be construed as investment advice or recommendation. It has not been prepared in accordance with legal requirements designed to promote the independence of investment research, and that it is not subject to any prohibition on dealing ahead of the dissemination of investment research.
- Any investment decision is made by each client alone whereas Admirals shall not be responsible for any loss or damage arising from any such decision, whether or not based on the content.
- With view to protecting the interests of our clients and the objectivity of the Analysis, Admirals has established relevant internal procedures for prevention and management of conflicts of interest.
- The Analysis is prepared by an analyst (hereinafter “Author”). The Author, Roberto Rivero, is a contractor for Admirals. This content is a marketing communication and does not constitute independent financial research."
- Whilst every reasonable effort is taken to ensure that all sources of the content are reliable and that all information is presented, as much as possible, in an understandable, timely, precise and complete manner, Admirals does not guarantee the accuracy or completeness of any information contained within the Analysis.
- Any kind of past or modeled performance of financial instruments indicated within the content should not be construed as an express or implied promise, guarantee or implication by Admirals for any future performance. The value of the financial instrument may both increase and decrease and the preservation of the asset value is not guaranteed.
- Leveraged products, including Contracts for Difference (CFDs) are speculative in nature and may result in losses or profit. Before you start trading, please ensure that you fully understand the risks involved.