74% of retail investor accounts lose money when trading CFDs with this provider.
Investments involve risks and are not suitable for all investors. CFDs are complex instruments and come with a high risk of losing money rapidly due to leverage.
74% of retail investor accounts lose money when trading CFDs with this provider.
You should consider whether you understand how CFDs work and whether you can afford to take the high risk of losing your money.
Weekly Wave Analysis EUR/USD, GBP/USD, USD/JPY 23 October 2017
Weekly Wave Analysis EUR/USD, GBP/USD, USD/JPY 23 October 2017
October 23, 2017 11:30
Hello trader,
Please find here below this week's wave analysis on the EUR/USD, GBP/USD and USD/JPY daily, weekly and monthly charts. More education, analytics, articles, and webinars can be found daily on Admiral Markets.
EUR/USD
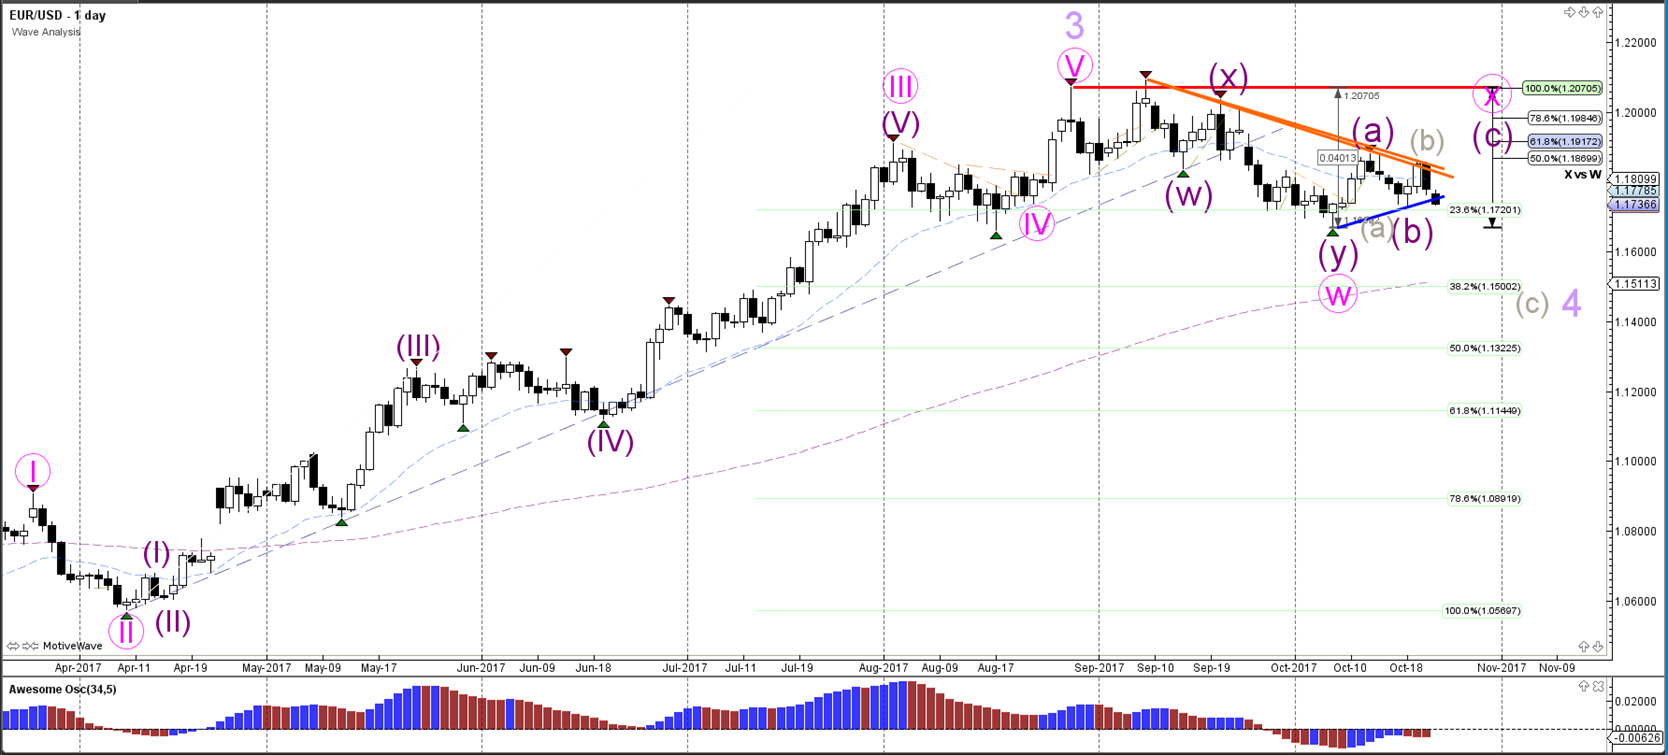
The EUR/USD is testing the support trendline (blue). A bearish candle makes a bullish ABC (purple) unlikely and a bearish ABC (grey) within a larger wave 4 (light purple) more probable.
Daily chart:
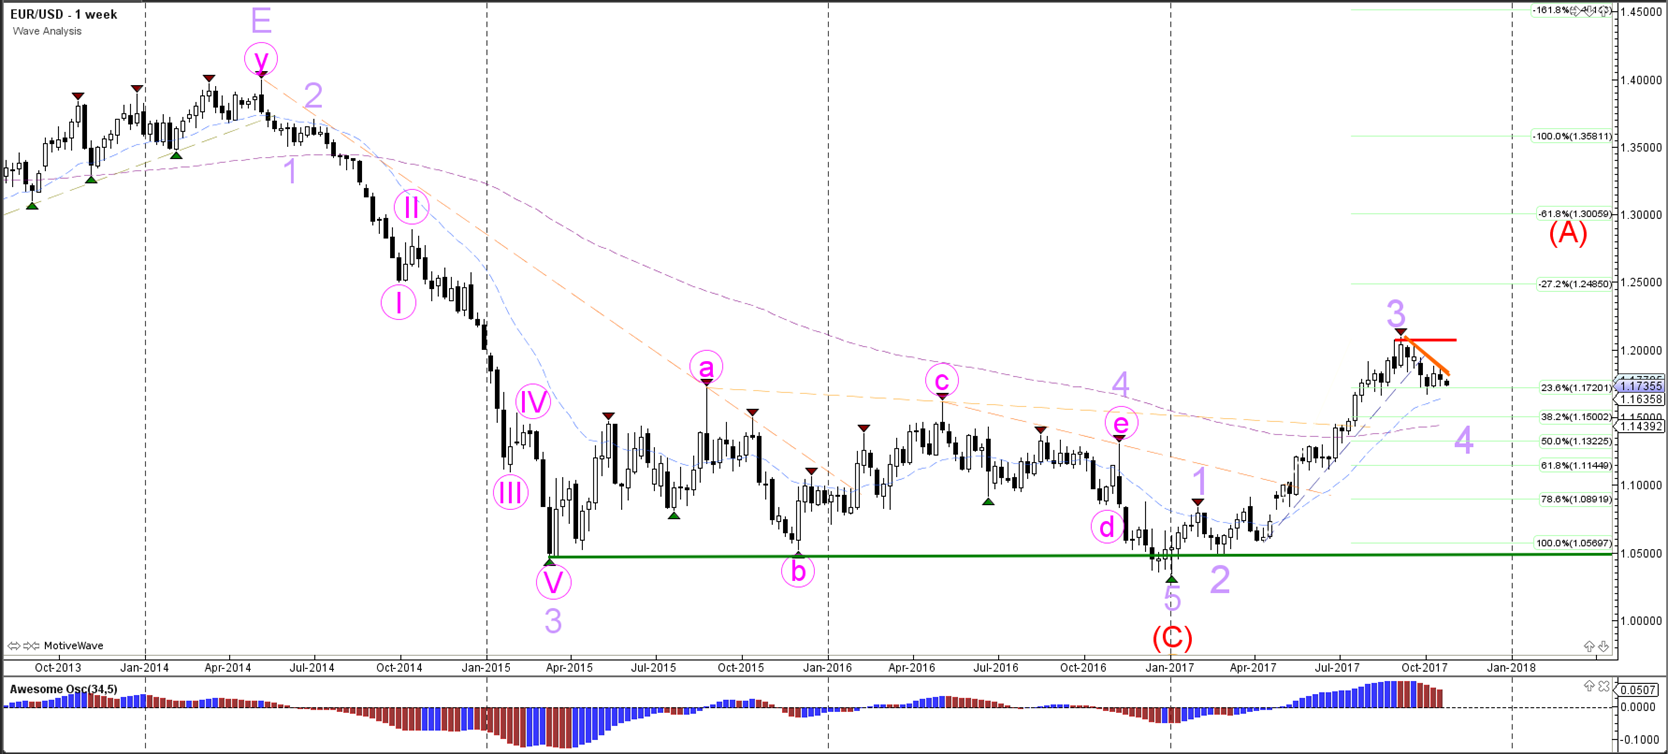
The EUR/USD correction could be part of a wave 4 (purple) within a larger wave A (red).
Weekly chart:
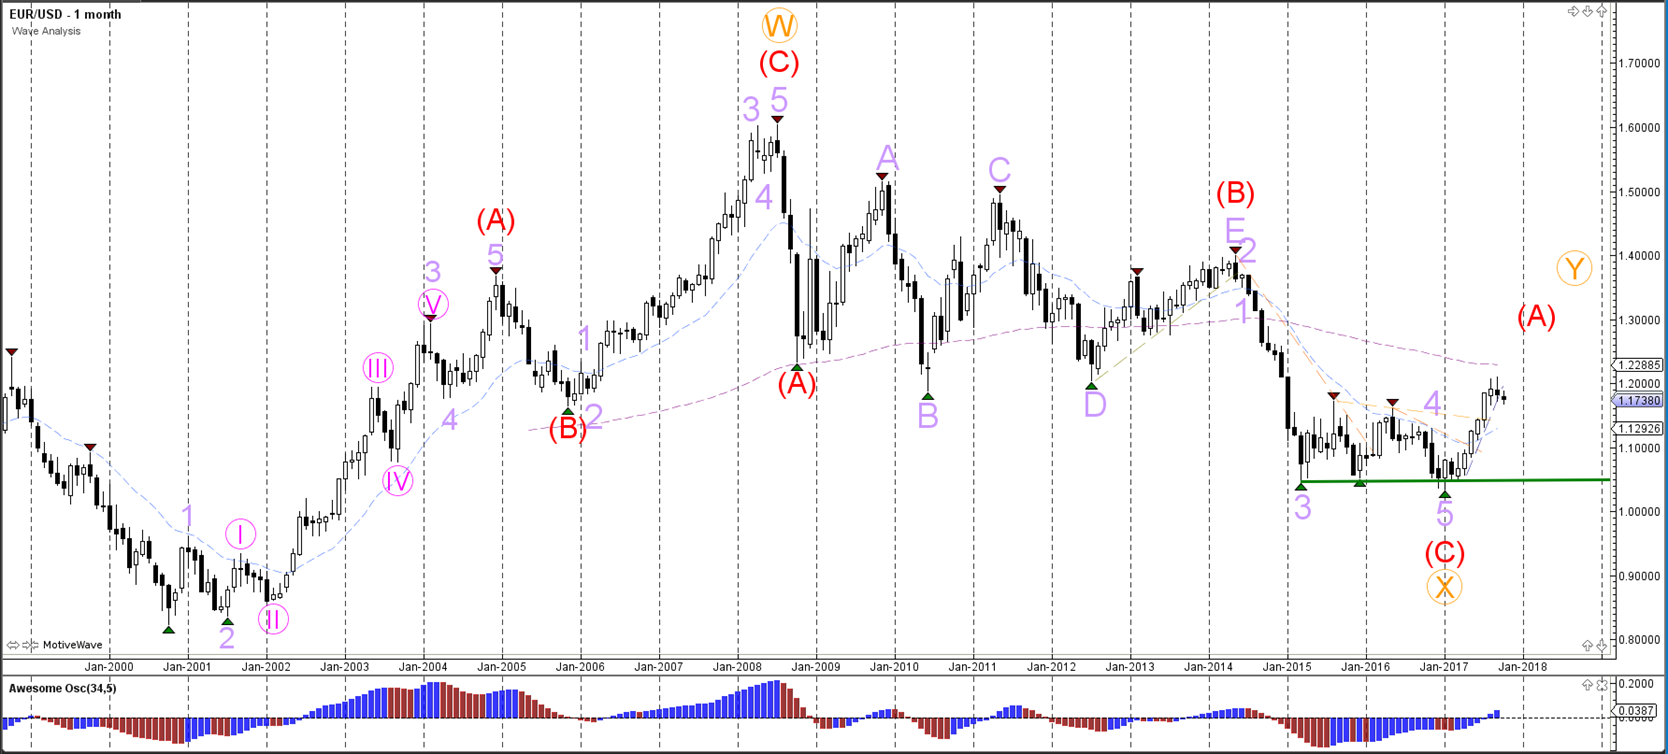
The EUR/USD bullish momentum could be part of a wave A (red). The strong bullish momentum seems to indicate that the bearish wave 5 (purple) of wave C (red) is most likely completed.
Monthly chart:
GBP/USD
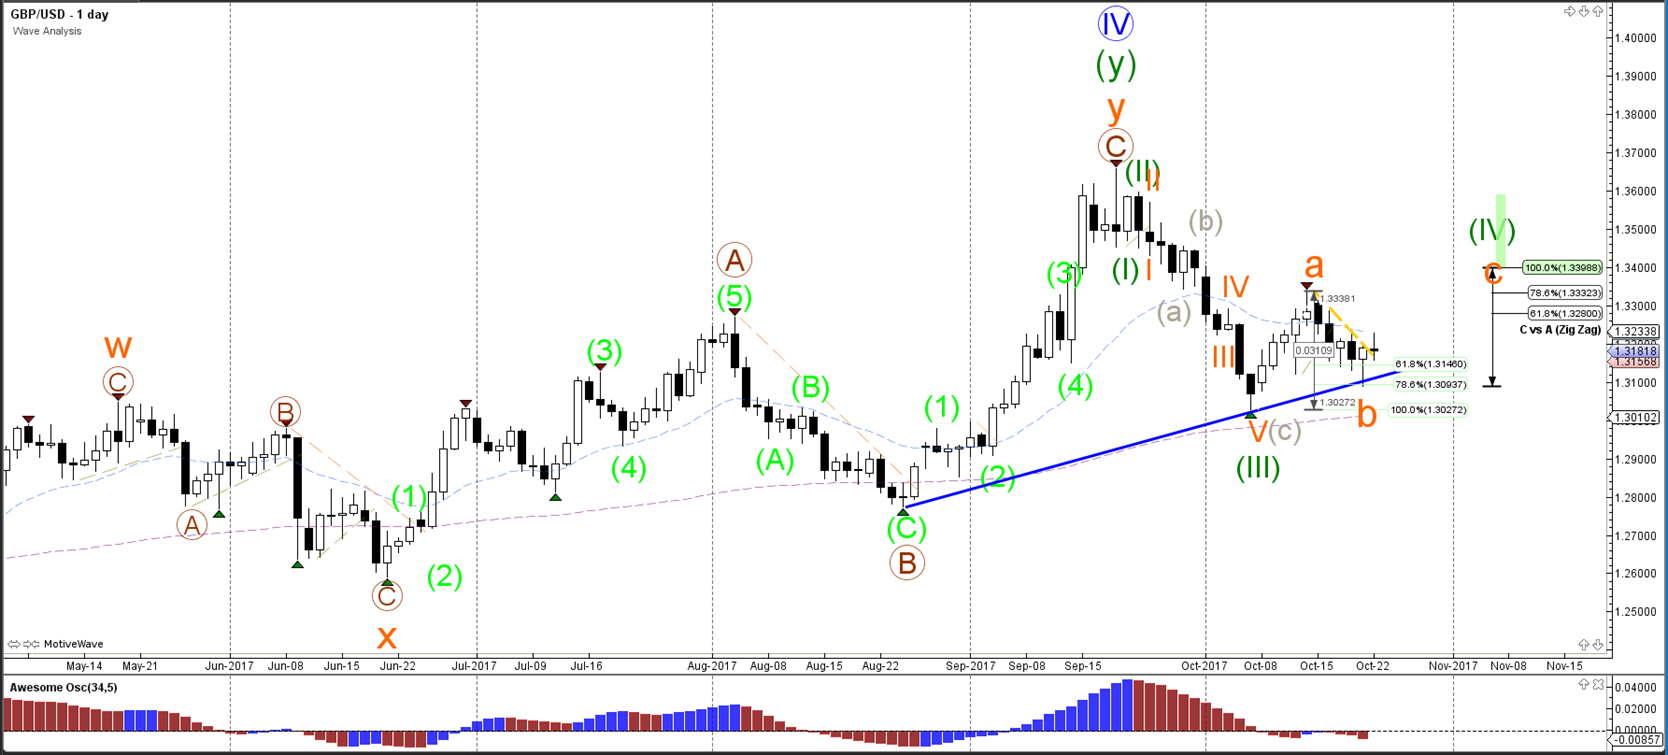
The GBP/USD is showing a bullish daily pinbar at the support trend line (blue). A break below the trend line could indicate a continuation of the bearish momentum whereas a failure to break the candle low could indicate a bullish wave C (orange).
Daily chart:
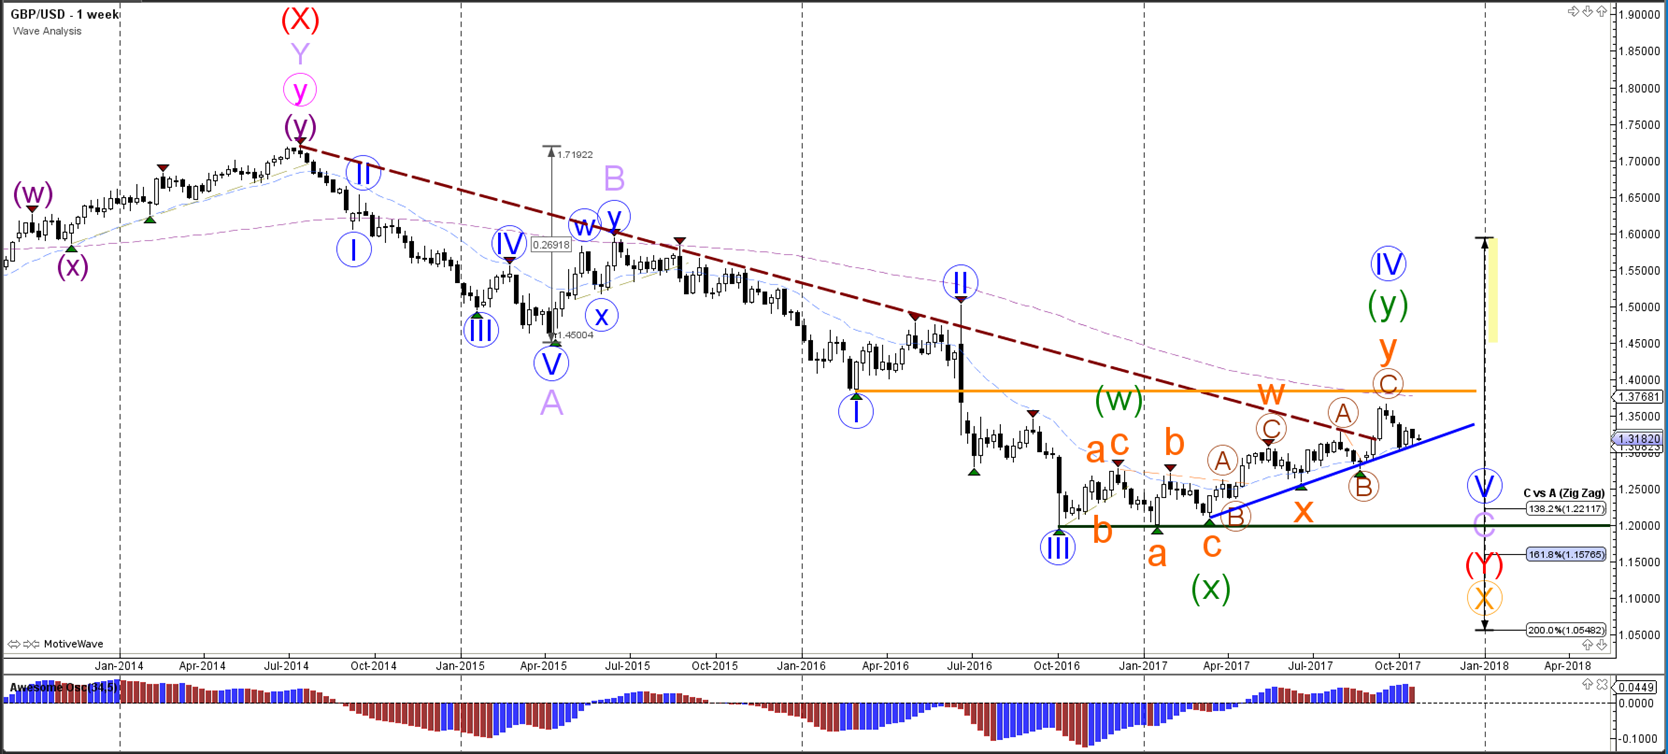
The GBP/USD needs to break below support (blue) for a larger downside becomes more likely.
Weekly chart:
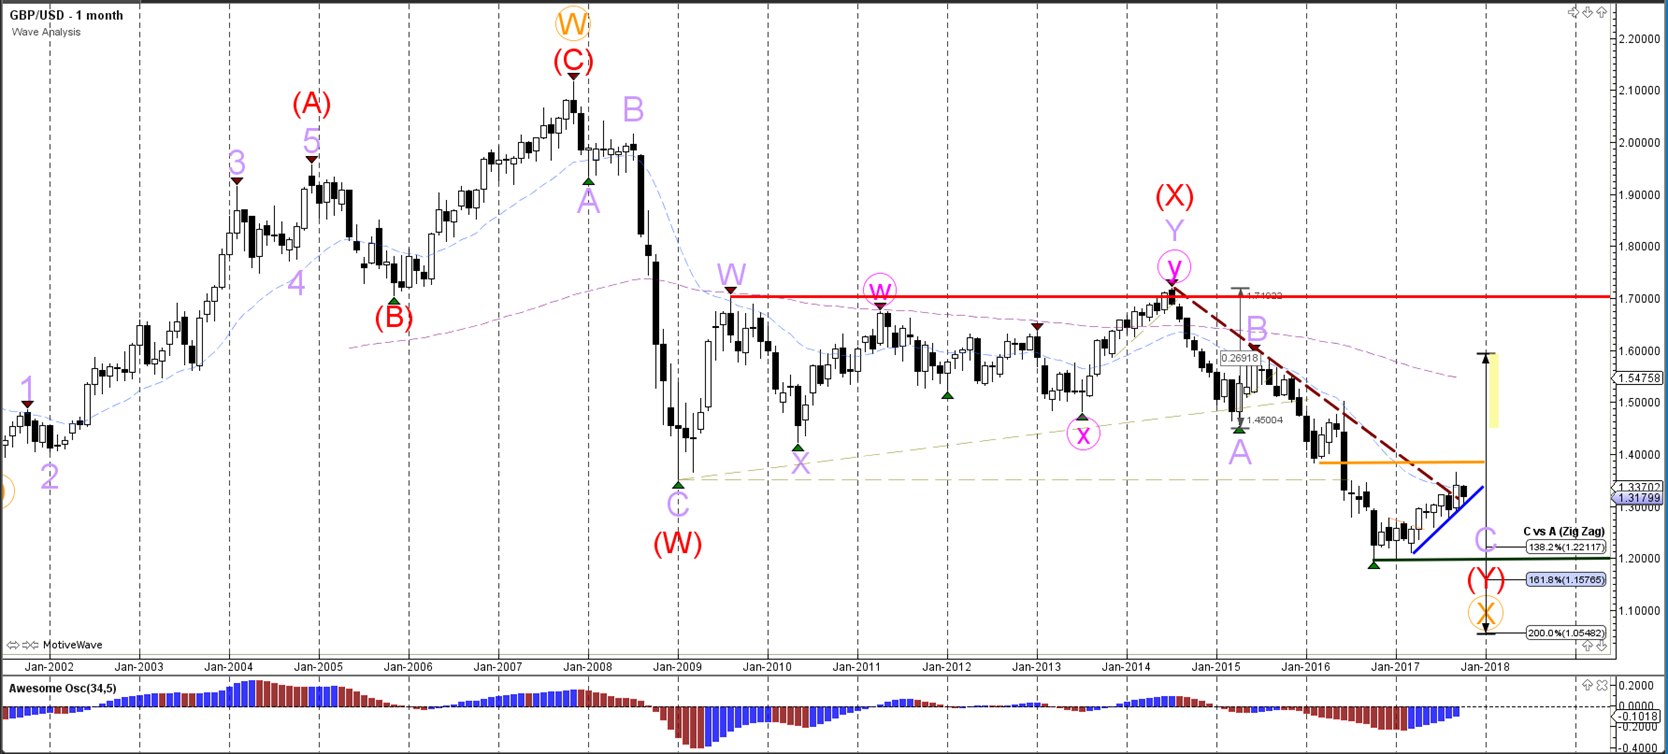
The GBP/USD is testing a larger support trend line (blue). A bearish breakout could indicate the continuation of the wave C (purple).
Monthly chart:
USD/JPY
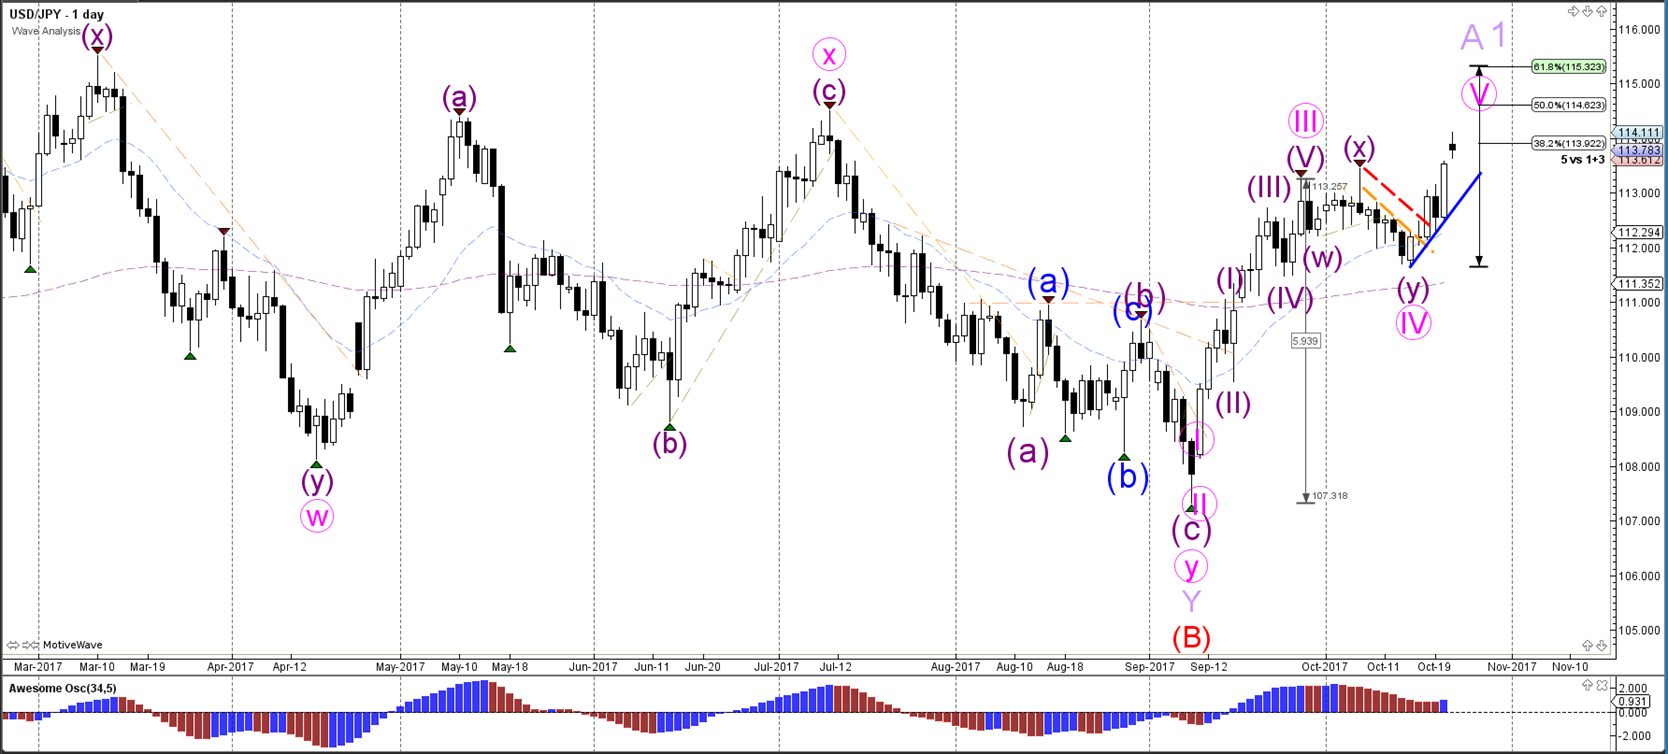
The USD/JPY bullish momentum is either part of a wave A or wave 1 (purple). In both cases a bearish retracement (wave 2/B) could take place before a 3rd bullish wave occurs.
Daily chart:
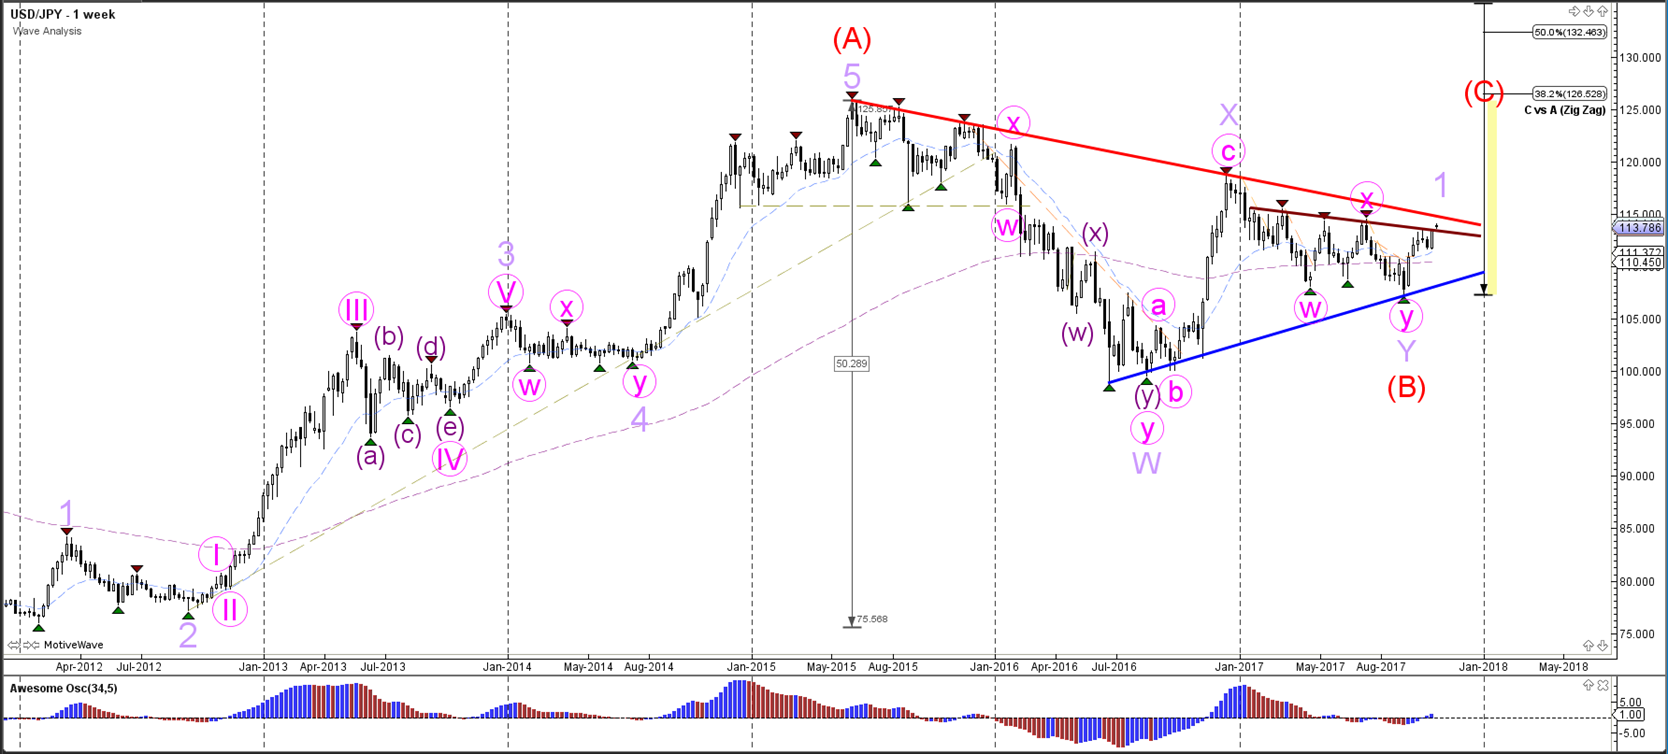
The USD/JPY is in a larger triangle chart pattern with support (blue) and resistance (brown/red) nearby. The wave B (red) seems to be completed at the most recent bottom.
Weekly chart:
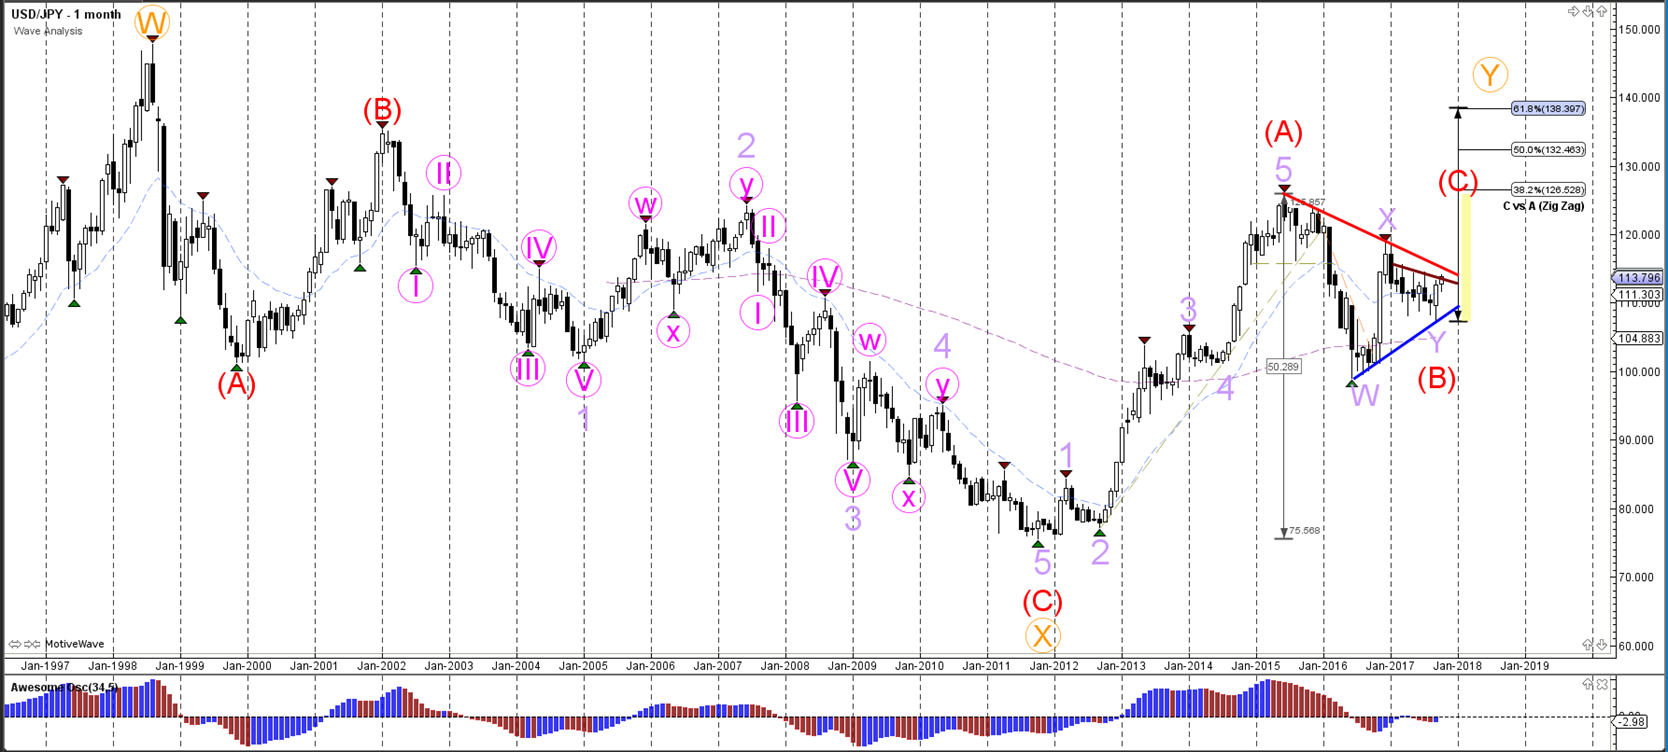
The USD/JPY is looking for a breakout of the triangle pattern.
Monthly chart:
Follow @ChrisSvorcik on twitter for latest market updates. Connect with Chris Svorcik on Facebook for latest market updates.