USD Decision Zone to Reveal Bullish or Bearish Trend
USD/JPY
4 hour
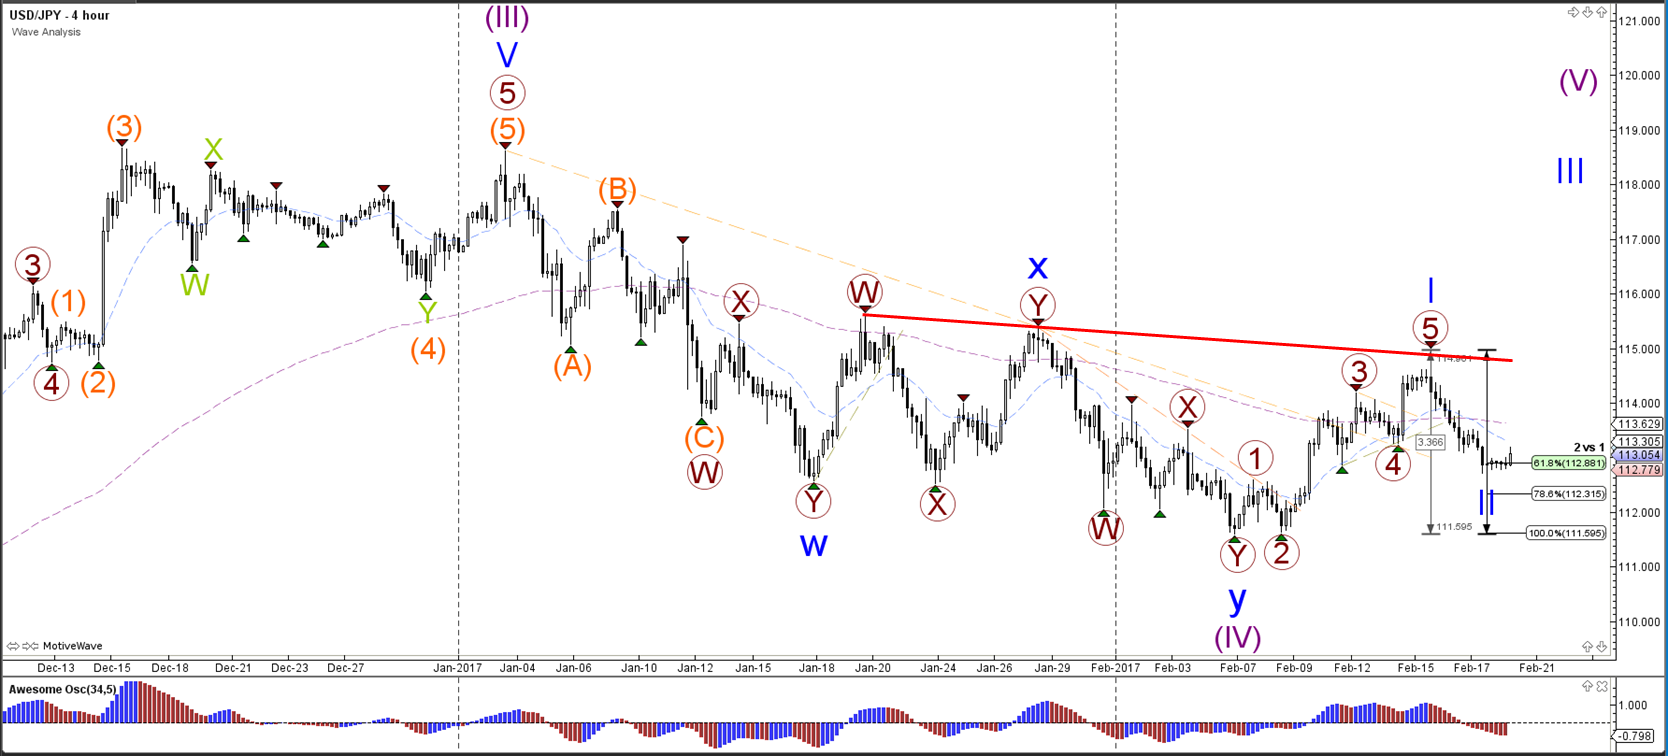
The USD/JPY seems to have completed a bullish 5 wave (brown) pattern as part of a wave 1 (blue). Price could now be retracing back to the Fibonacci levels of wave 2 vs 1. A break below the 100% level invalidates this wave structure. A breakout above resistance (red) could confirm and start the wave 3 (blue).
1 hour
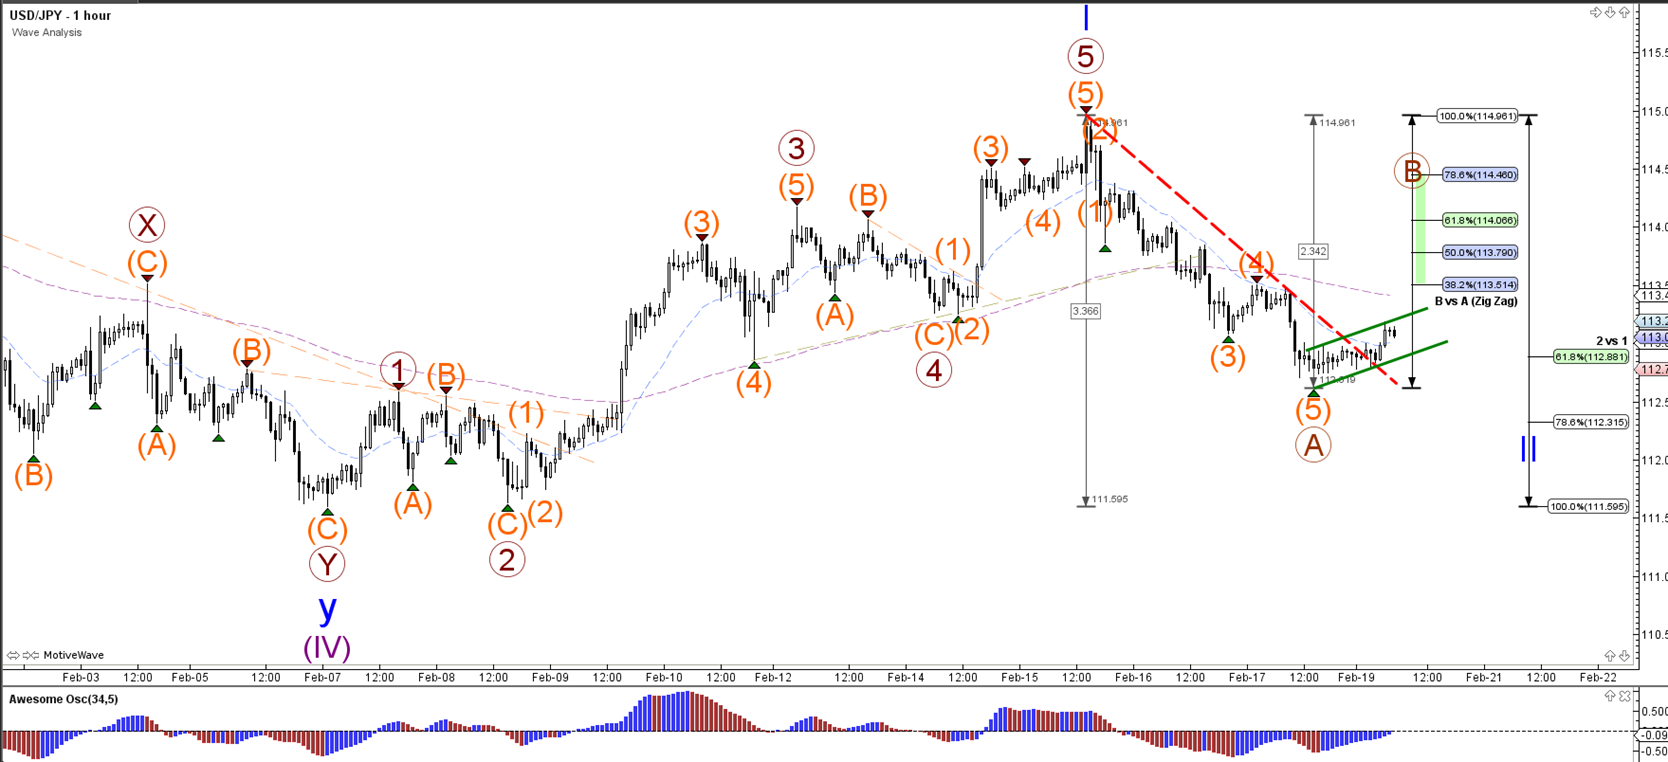
The USD/JPY is probably building a bearish ABC zigzag (brown) correction within wave 2 (blue). Price could bounce at the Fibonacci levels of wave B vs A (brown) price could move lower within wave 2 (blue). A break above the 100% level of wave B vs A invalidates wave B (brown) and below 100% of wave 2 vs 1 invalidates wave 2 (blue).
EUR/USD
4 hour
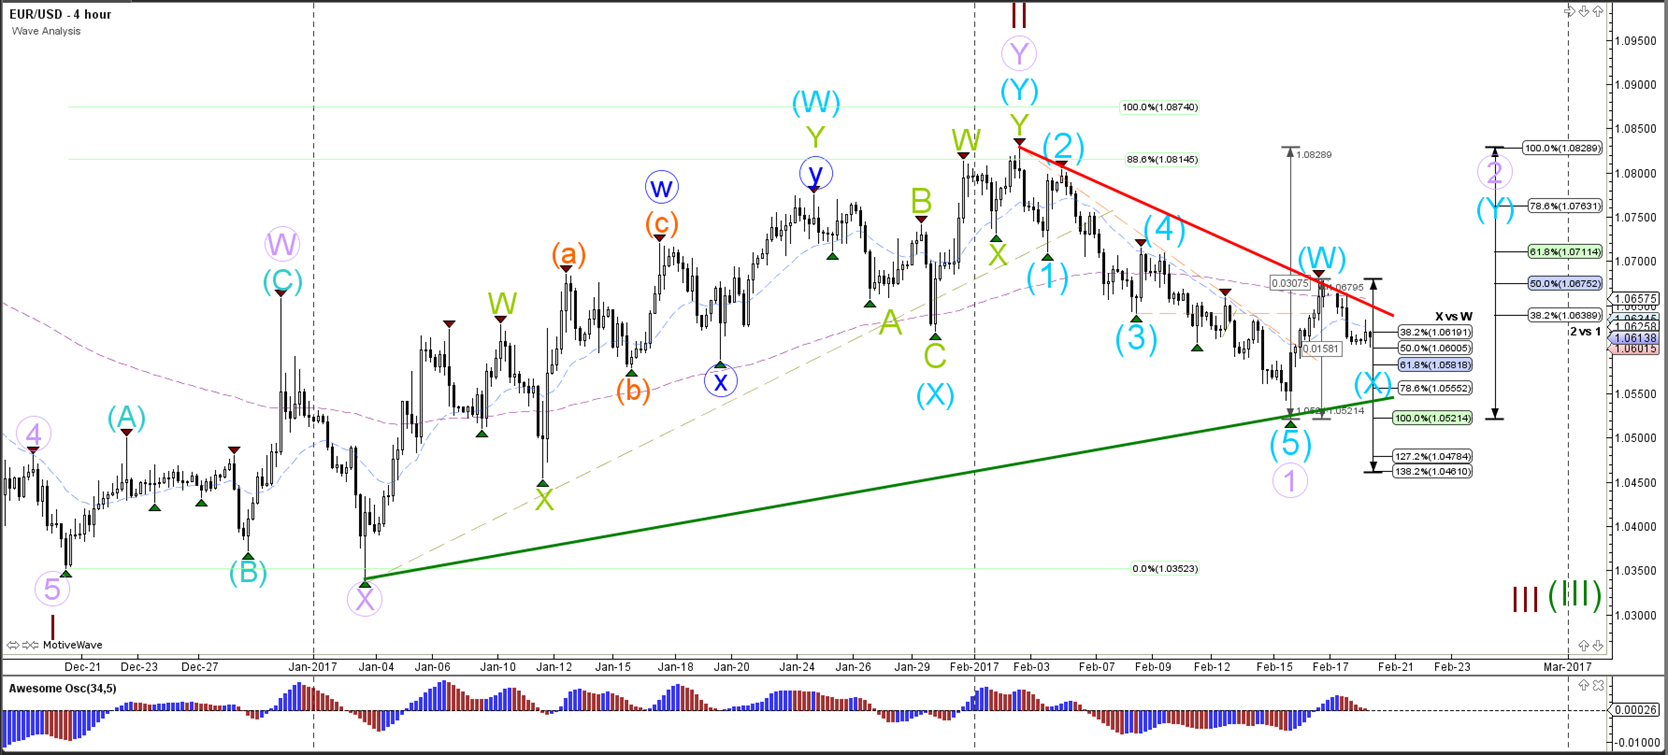
The EUR/USD retraced back to the Fibonacci levels of wave X (blue) as price builds a WXY correction within a larger wave 2 (puple). The Fibonacci levels of wave 2 (purple) could therefore act as resistance. A break above the 100% level of wave 2 vs 1 invalidates the wave 1-2 (purple).
1 hour
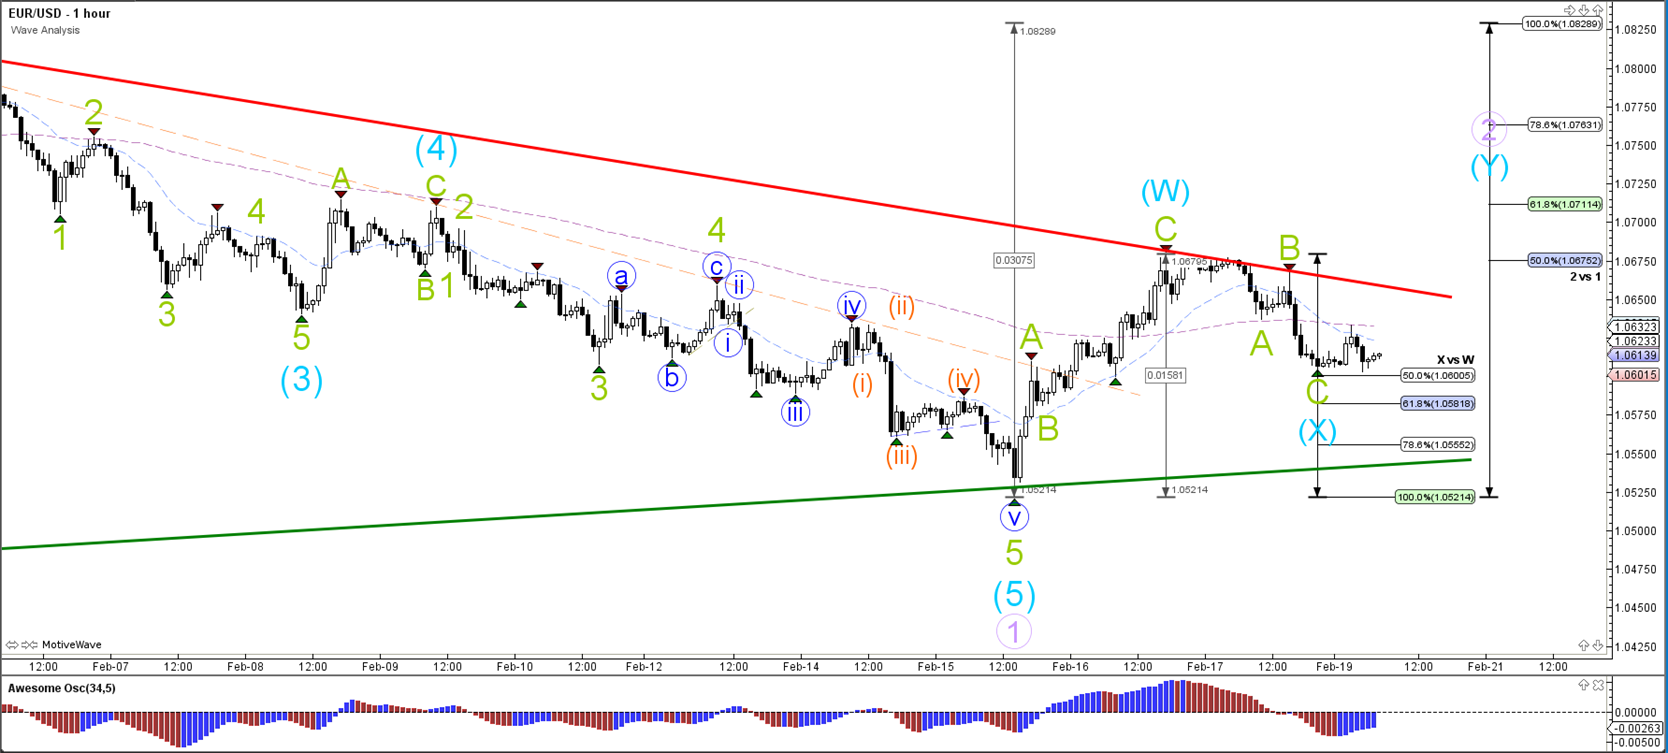
The EUR/USD showed a bearish bounce and price fell back to the 50% Fibonacci support level. Price will either break above resistance trend line (red) or retrace to deeper Fib levels of wave X vs W.
GBP/USD
4 hour
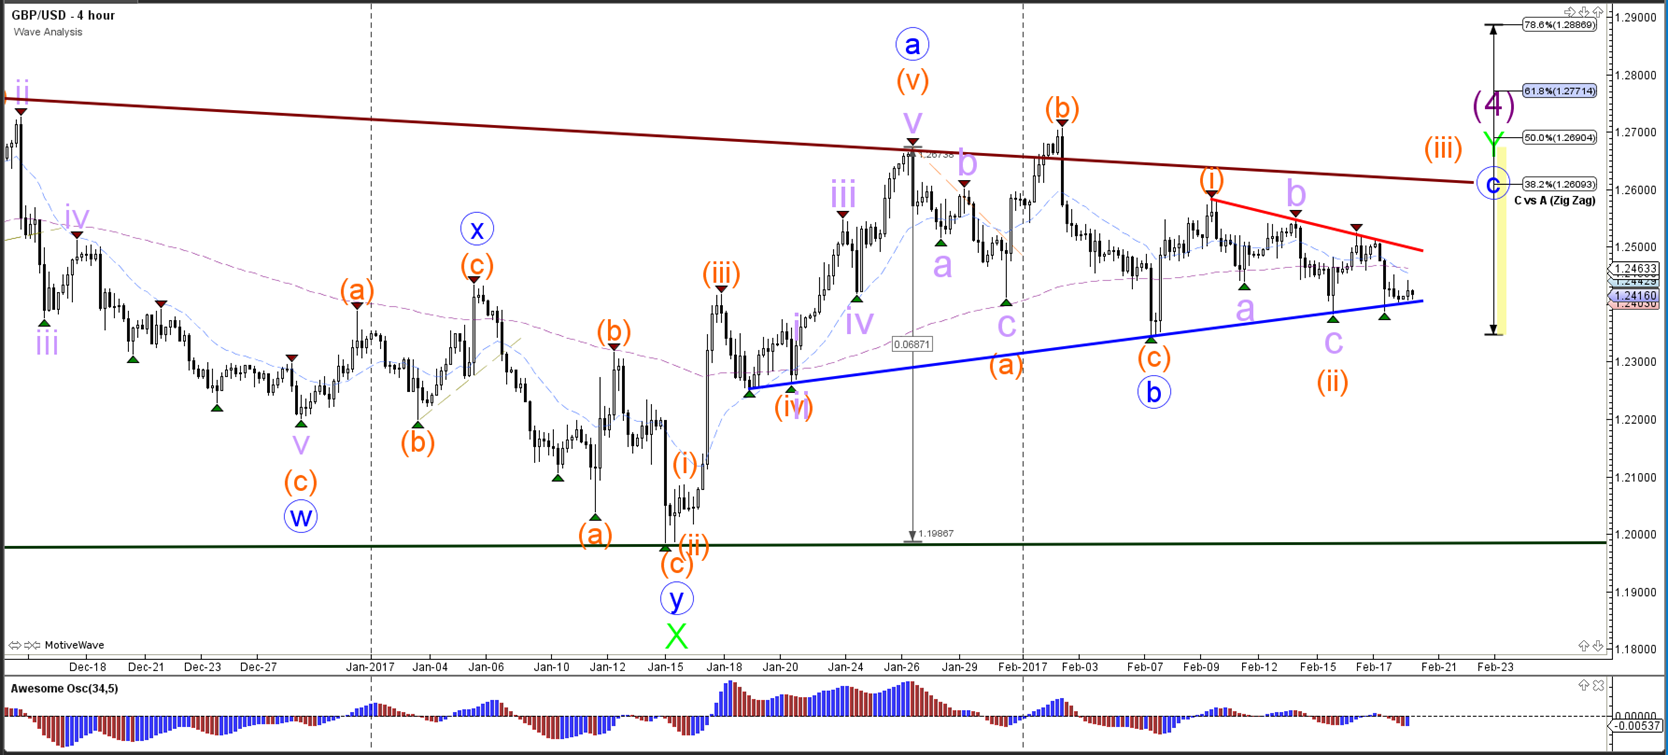
The GBP/USD is in between multiple support and resistance trend lines. At this moment price is close the support trend line (blue) which could be used as a bouncing spot within wave 2-3 (orange) and a larger wave C (blue).
1 hour
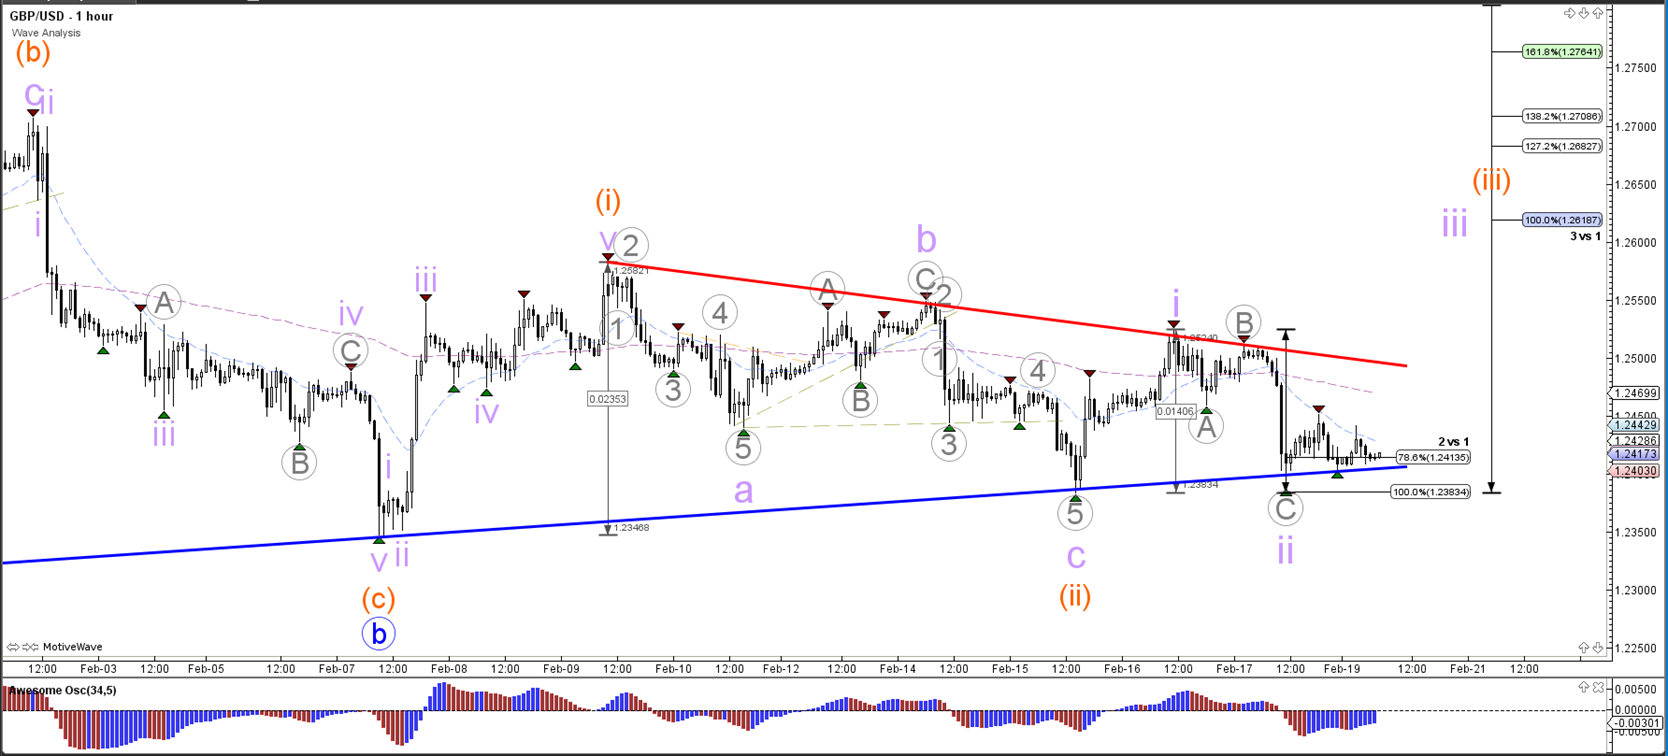
The GBP/USD seems to have built a bearish ABC zigzag (grey) towards the Fibonacci levels of wave 2 (purple). A break below the 100% Fib level of wave 2 vs 1 (purple) invalidates the wave structure. A bullish breakout above resistance (red) could see price move towards the Fibonacci targets of wave 3 vs 1 (orange).
Follow @ChrisSvorcik on twitter for latest market updates
