GBP/USD Breaks 1.25 Resistance within Bullish Trend Channel
GBP/USD
4 hour

The GBP/USD is in an uptrend channel indicated by the support (green) and resistance (red) trend lines. Price seems to be breaking above the 61.8% Fibonacci level which means that price could test the next Fib at 78.6%.
1 hour

The GBP/USD is trying to build a bullish breakout above resistance (dotted red).
EUR/USD
4 hour
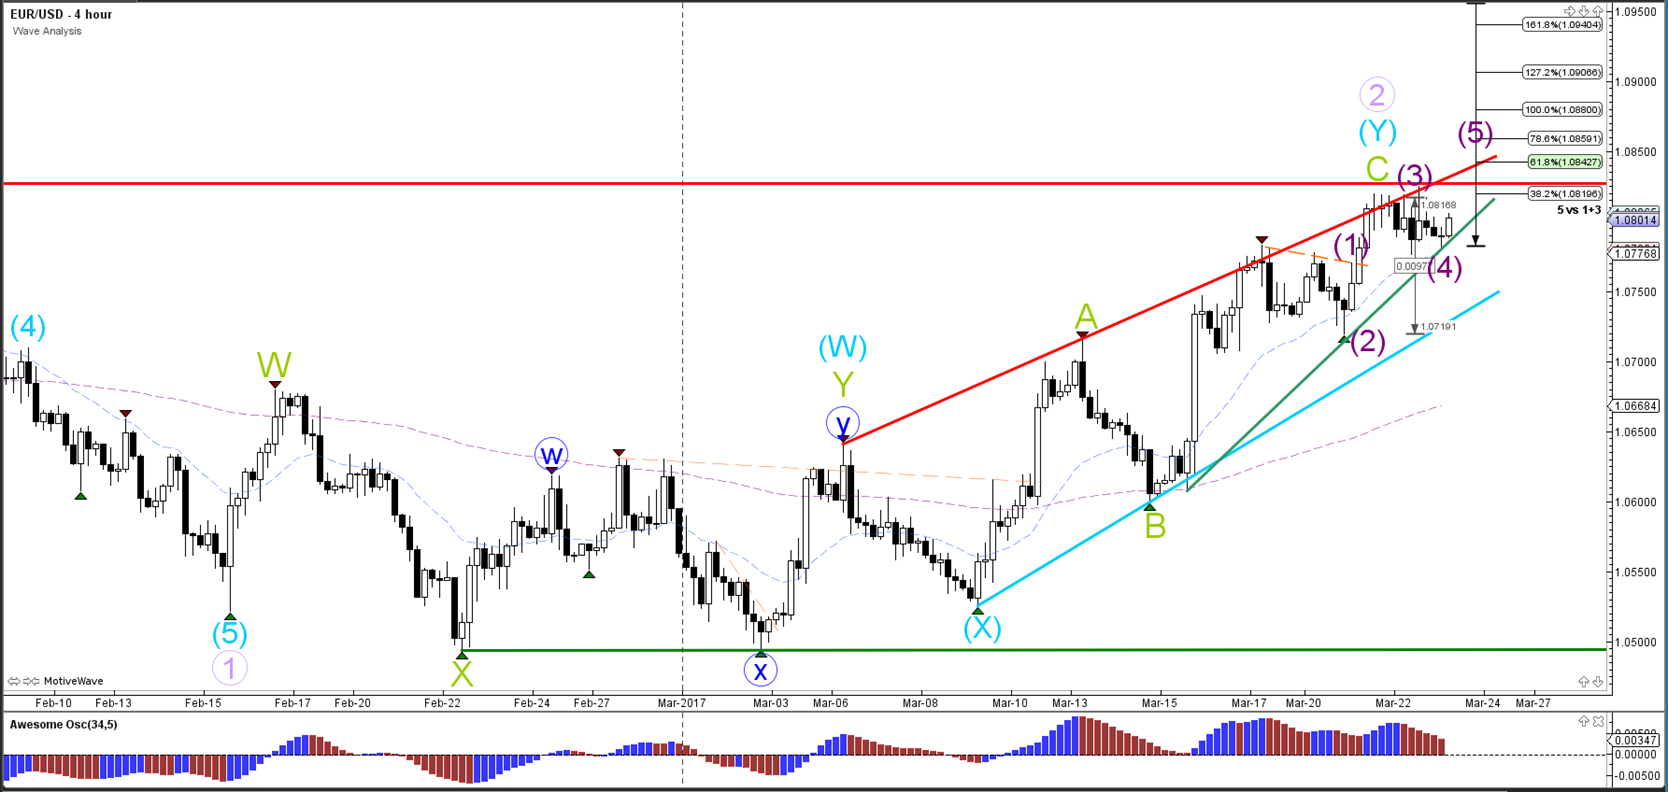
The EUR/USD is building a rising wedge chart pattern (red/green) trend lines. A break below the wedge could send the EUR/USD to test the next support (blue). A break above it could see price invalidates wave 2 (purple) at the horizontal line (red) and see a potential breakout within wave 5 (purple).
1 hour
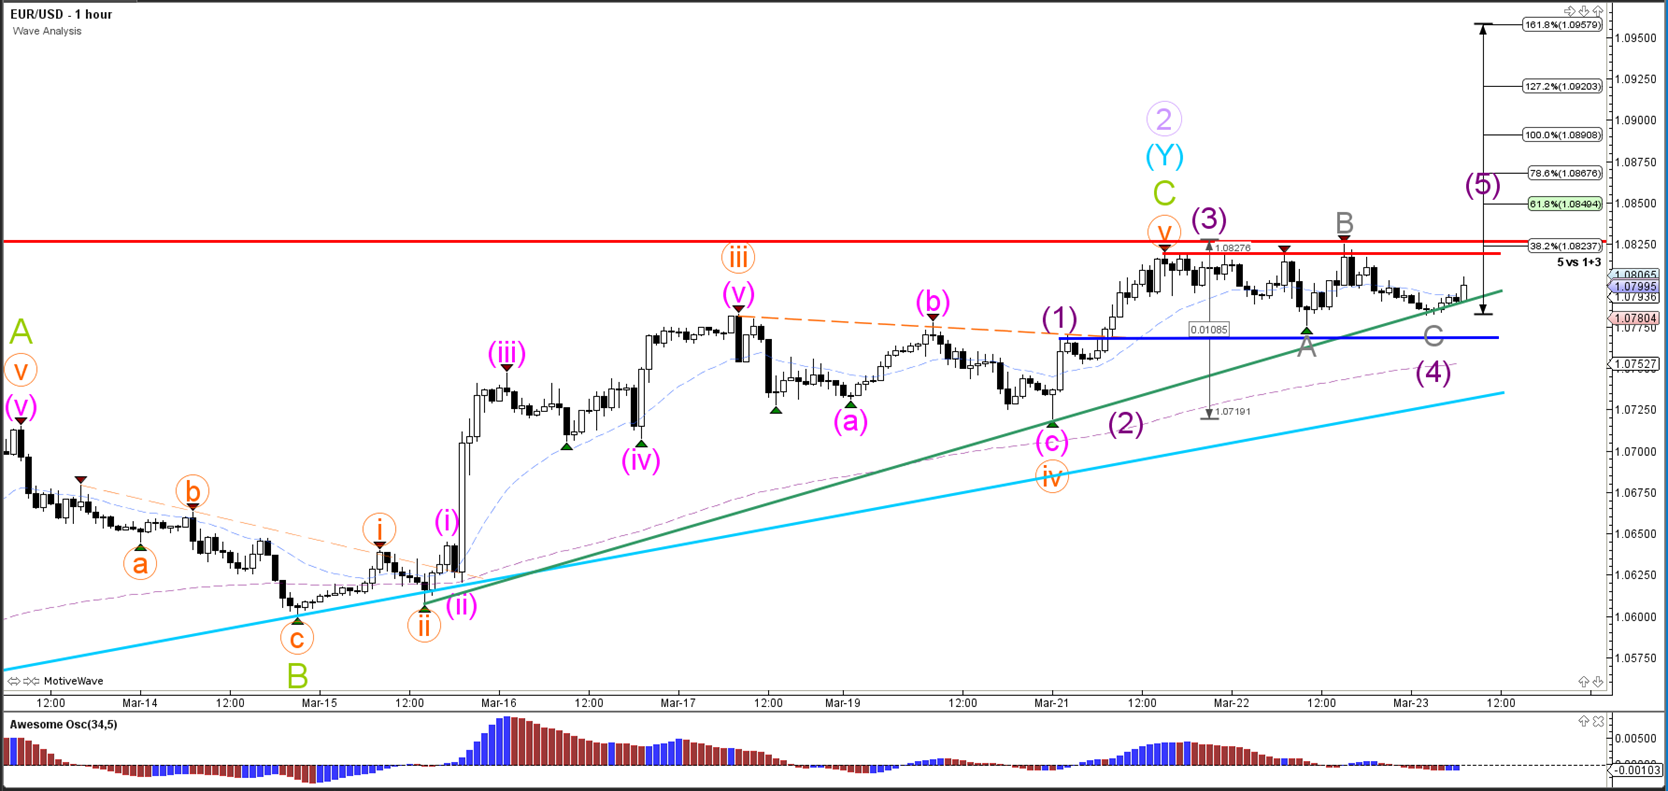
The EUR/USD could have completed an ABC correction (grey) within wave 4 (purple). The support and resistance trend lines are key. A break below the blue line invalidates the 5 wave pattern (purple).
USD/JPY
4 hour
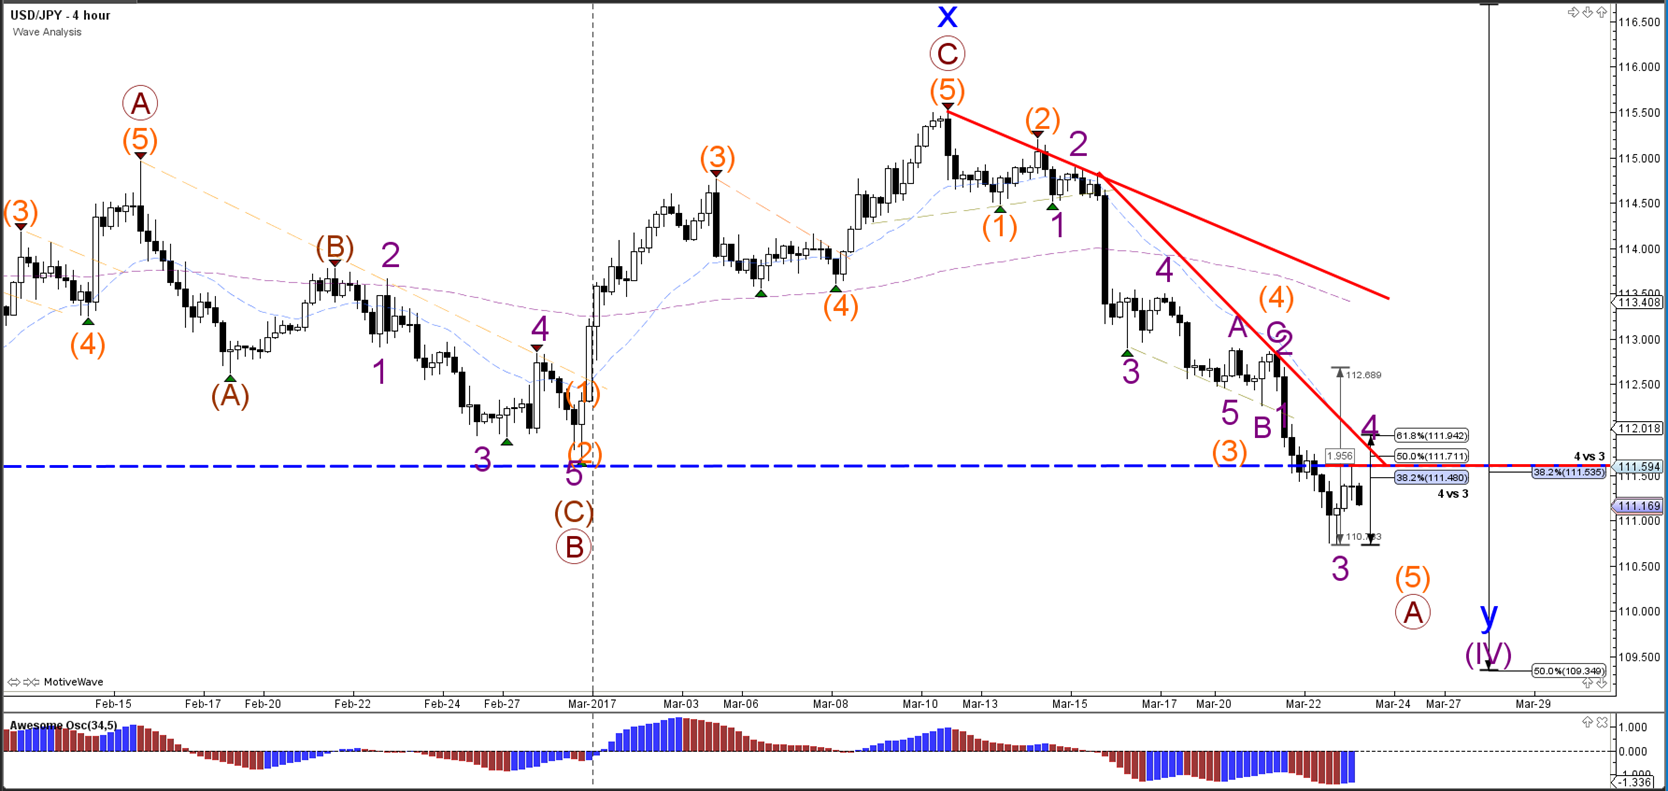
The USD/JPY broke below the bottom (dotted blue) and made a pullback to the broken bottom which has now become resistance (dotted red). The retracement could be part of a wave 4 (purple) unless price breaks above the 61.8% Fib of wave 4 vs 3.
1 hour
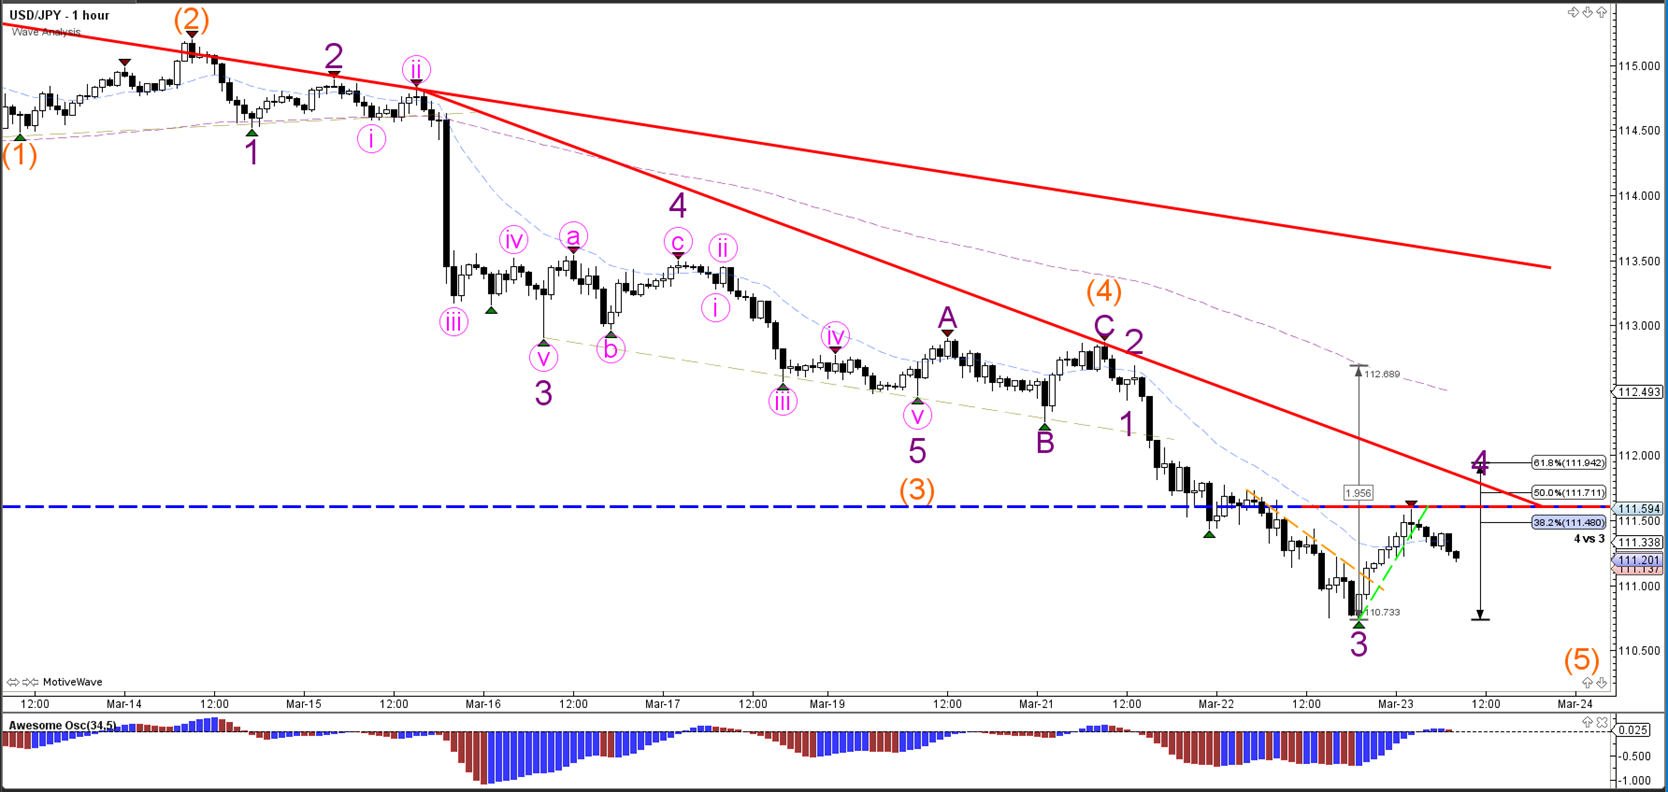
The USD/JPY could be building a 4 wave (purple/orange) within a larger wave 5 (orange).
Follow @ChrisSvorcik on twitter for latest market updates