EUR/USD Tests 38.2% Fibonacci Support at 1.2250
EUR/USD
4 hour
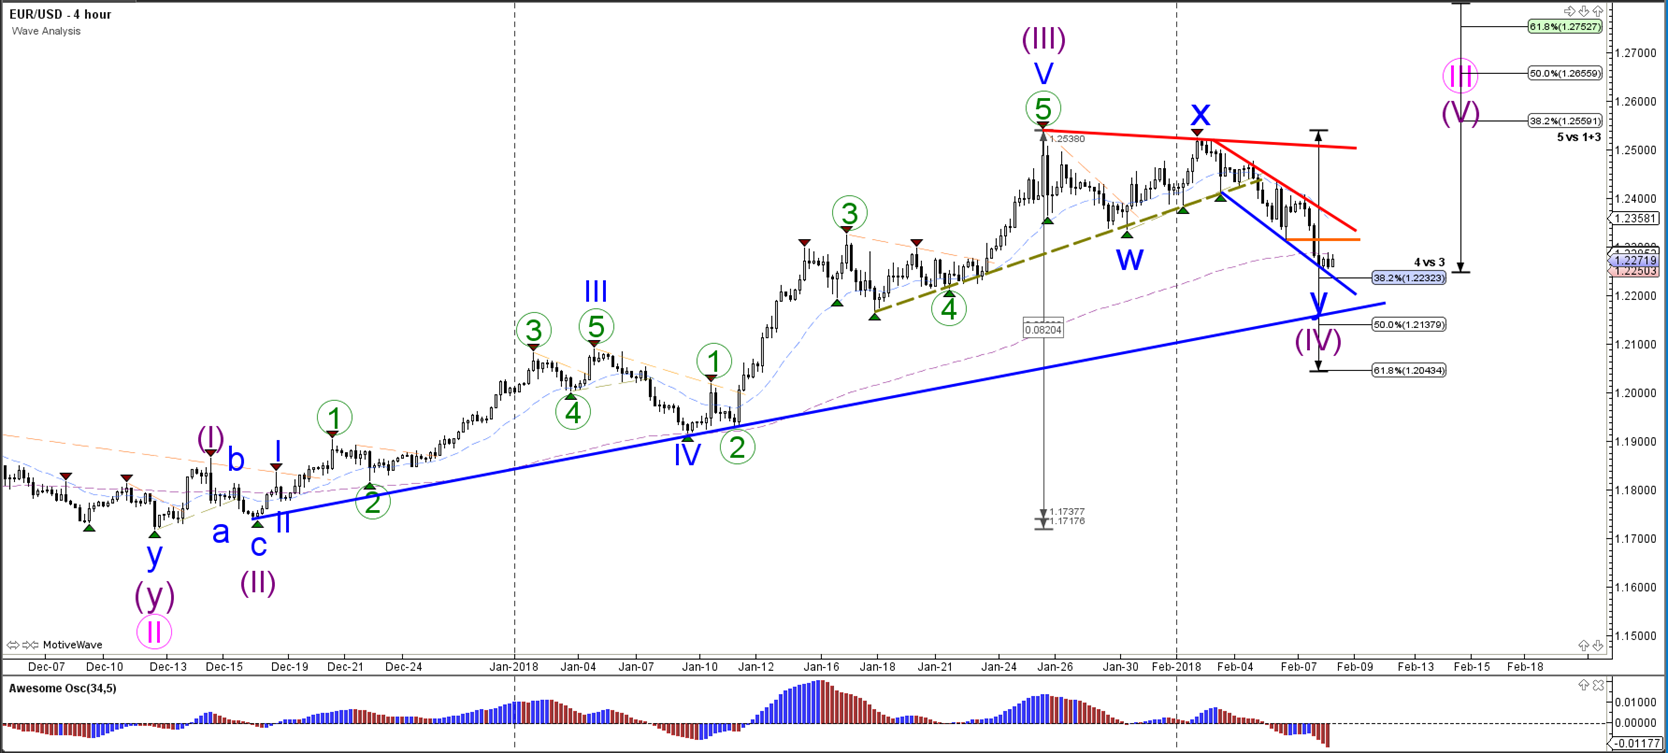
The EUR/USD continued to move lower within the bearish channel but price has now reached the 38.2% Fibonacci level of wave 4 (purple). This could be a potential bounce spot if price does complete the wave 4 correction. A break above resistance (red/orange) could see the start of a wave 5 (purple).
1 hour
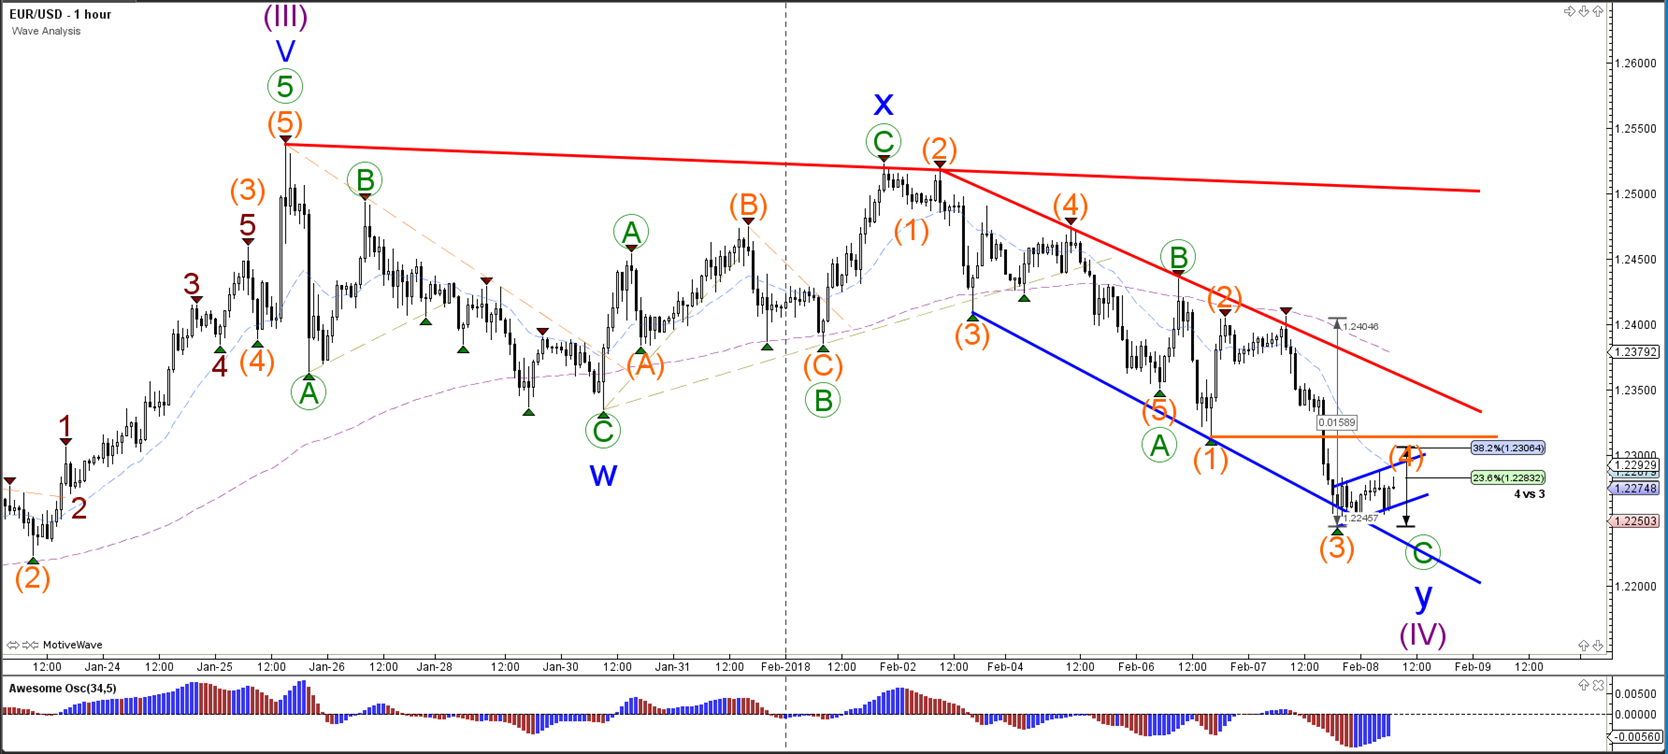
The EUR/USD failed to break above resistance and in fact extended the bearish correction. The wave pattern however remains most likely an ABC (green) correction. Whether the wave C (green) is indeed completed depends if price can break above the potential bottom of wave 1 (orange), otherwise one more lower low as part of wave 4-5 (orange) could occur.
GBP/USD
4 hour
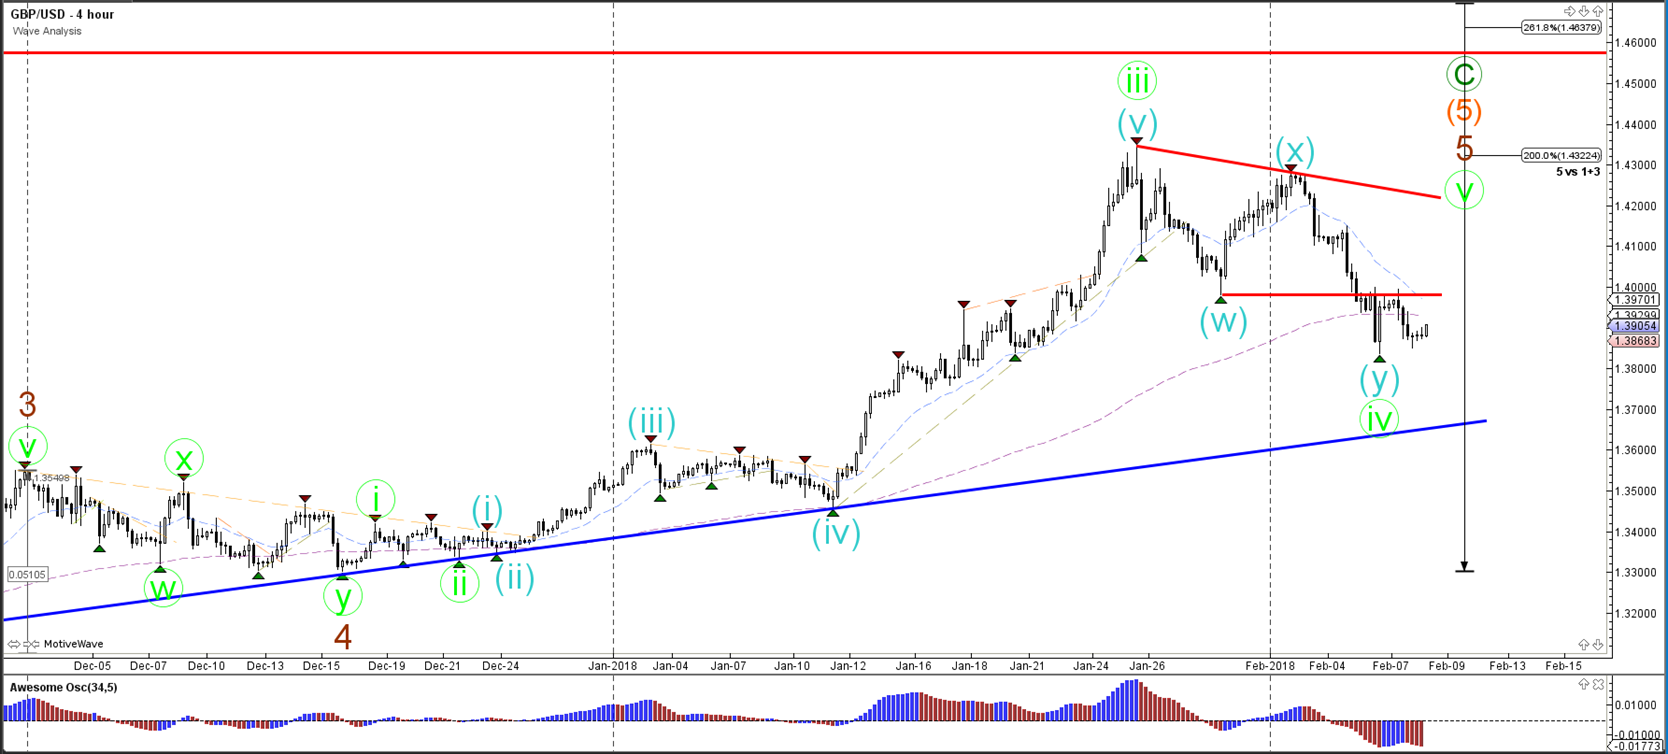
The GBP/USD could still be in a wave 4 (green) correction. A new bearish break would make this wave analysis unlikely and could indicate a potential larger bearish trend. A break above the previous top (red) could indicate a continuation rally.
1 hour
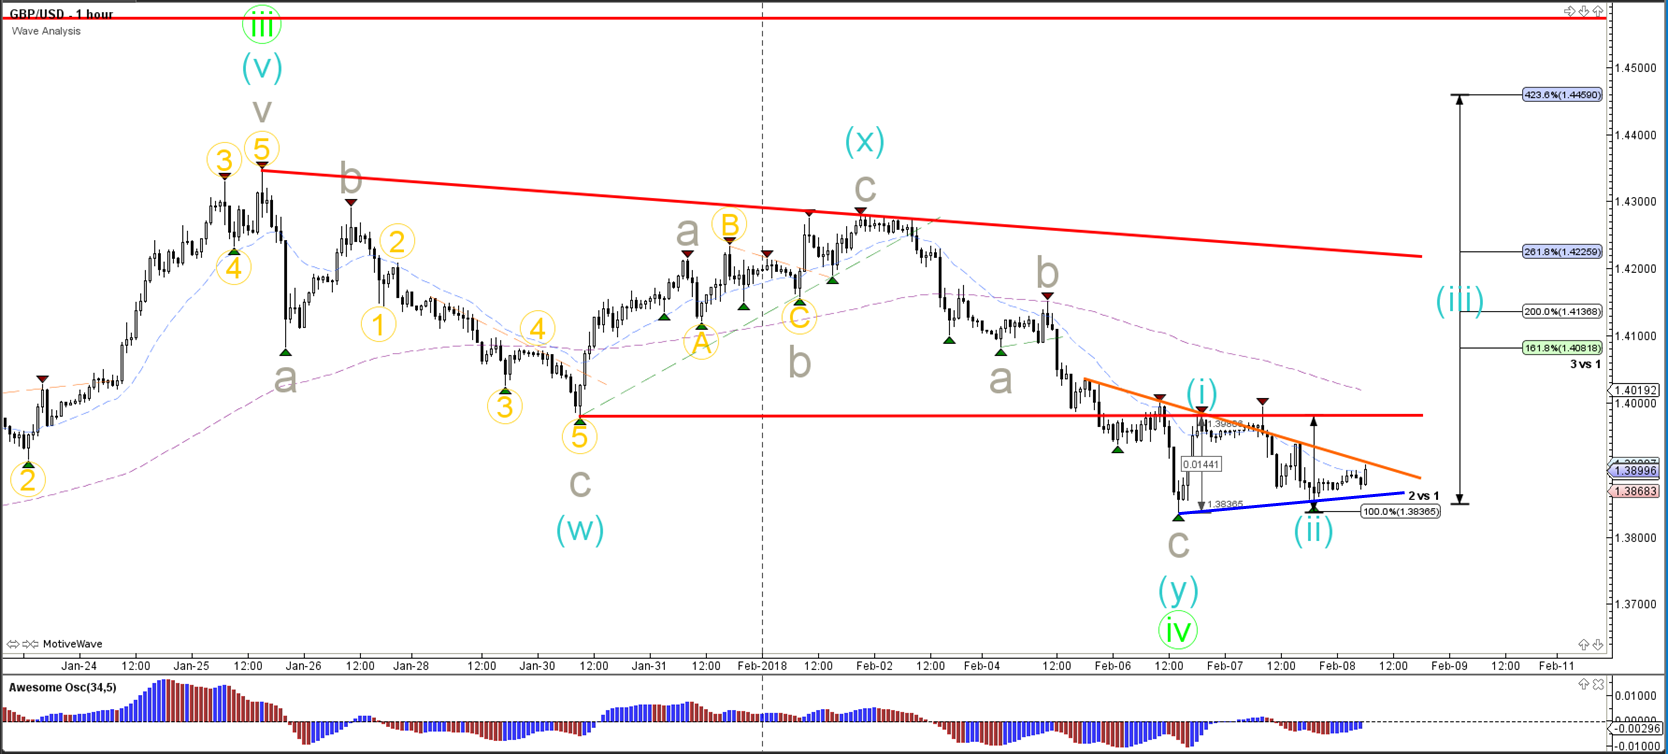
The GBP/USD did not invalidate the bottom of wave 2 (blue) and be building a wave 1-2 (blue) pattern. A break above resistance (red/orange) could indicate the start of wave 3 (blue).
USD/JPY
4 hour

The USD/JPY is trapped in between strong support (green/blue) and resistance (red/orange) but price still seems to be building a wave 1-2 (purple) pattern. A bearish break below the bottom and 100% Fib invalidates the wave 2 (purple).
1 hour
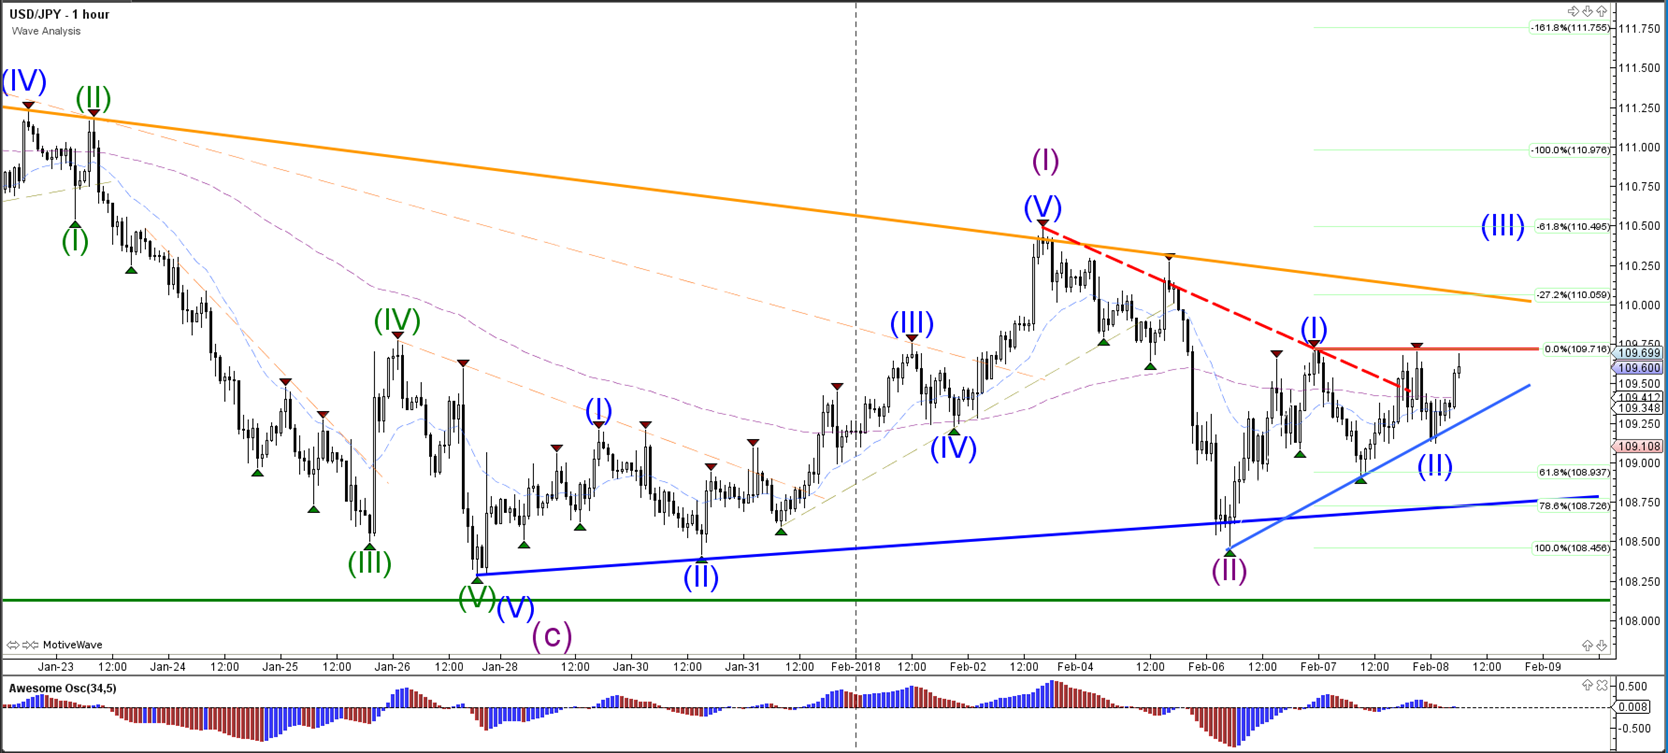
The USD/JPY needs to break above resistance (red) before an uptrend continuation is likely.
Follow @ChrisSvorcik on twitter for latest market updates.
Connect with Chris Svorcik on Facebook for latest Forex and education tips.