S&P500 Explodes To Best January Since 1987. What's Next?
The S&P 500 stock market index (SP500) has posted its best January performance in more than thirty years. However, with 2018 reporting the worst December since 1931 - and the worst year since the financial crisis - many people believe the January 2019 rally was simply a rebound from massively oversold levels.

Is this rally short lived, or can it last throughout the year? Let's look at the statistical, fundamental, and technical evidence…
The January Barometer: 86.8% Chance Of A Bullish Year?
Did you know there is a saying on trading floors which states: "As the S&P goes in January, so goes the year"?
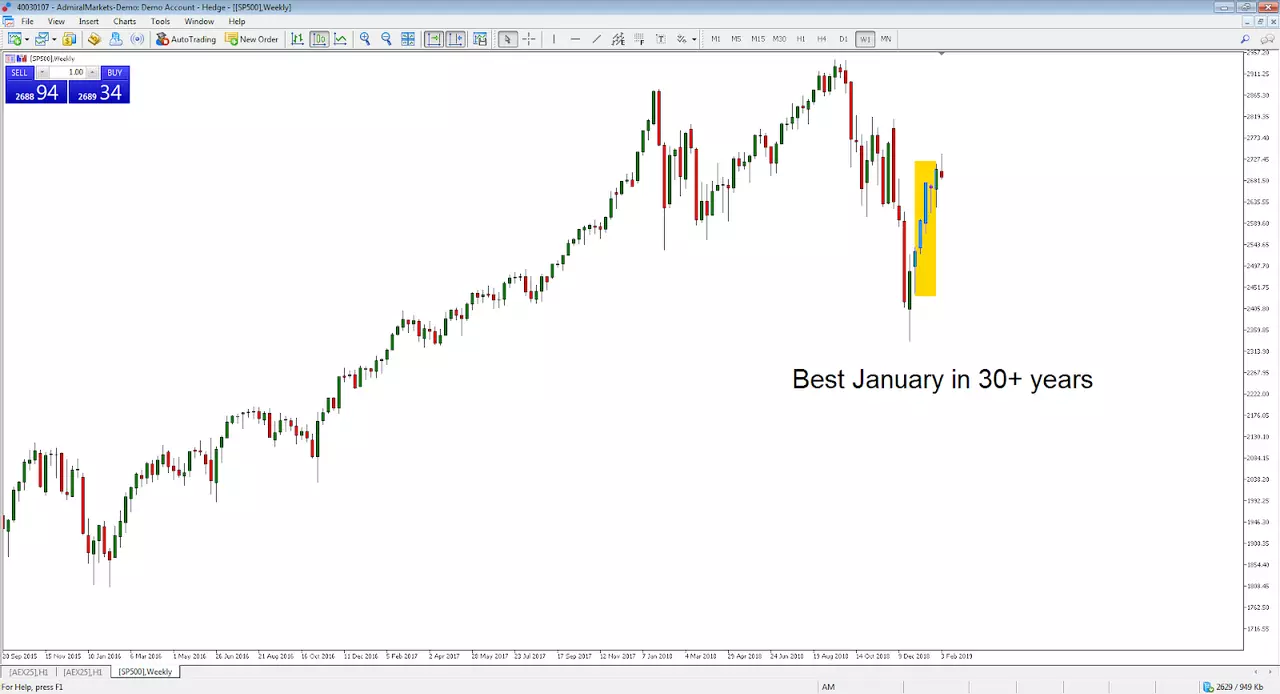
Source: Admiral Markets MT5 Supreme Edition, SP500, Weekly - Data range: from September 20, 2015, to February 8, 2019, accessed on February 8, 2019, at 3:23pm GMT. - Please note: Past performance is not a reliable indicator of future results.
The January Barometer statistical indicator was first created by Yale Hirsch in 1972. The long term record is impressive with an 86.8% accuracy rate. In fact, there have only been nine major errors in sixty-eight years, most of these occurring in secular bear markets.
Needless to say, this doesn't mean the market will move upwards in a straight line for the rest of the year - if it will at all - but it does provide an interesting statistical bias or, as traders would say, 'an edge'. While some market professionals are sceptical of the barometer, Hirsch says it makes sense, "because that's when Wall Street expectations are reset for the year… [and] when big investors and pension funds put money to work for the new year, or not".
Hirsch also established another statistical measure known as the 'first five days' phenomenon. Let's look into this index as well:
First Five Days Barometer: 82% Chance Of A Bullish Year?
This statistical indicator is based on an analysis of the first five trading days of the year. If it ends positive, then history shows there is a stronger bias for the year to end positive, as well. The trend is so strong that since 1950, when a given year's first five trading days ended positive, the S&P 500 index has likewise ended the year positive 82% of the time - with an average gain of 13.3%.
Yet even more positively, in pre-presidential election years, this indicator performs even better. In the last seventeen pre-presidential election years, twelve of them followed the direction of the 'first five days' phenomenon. With 2019 being a pre-presidential election year, it can be an extra edge in a trader's arsenal.
While the statistical side shows a higher bias towards the S&P 500 index ending positive this year, there are fundamental headwinds that could still make the year a wild ride and perhaps move outcomes even lower.
S&P 500 Fundamentals: The Fed, China & Trade
One of the many reasons 2018 was the worst year for the S&P 500 since the financial recession is because of the US Federal Reserve increasing interest rates. The uncertainty on the impact of increasing rates on the economy spooked many investors. However, the federal funds futures market is currently not pricing in any rate hike this year - helping to give stocks another potential boost.
Another issue that has caused concern for investors is the ongoing tension surrounding trade talks between Washington and Beijing. While US president Donald Trump's and Chinese premier Xi Jinping's teams are negotiating a trade deal, no headway has yet been made. Even though this issue continues to weigh on sentiment, an end to the trade war could be a big boost to global stock markets.
However, the fundamental scenarios have not stopped Wall Street analysts having a $3,000 median target for the S&P 500 by December 2019, providing a good amount of possibilities for uplift from current levels:
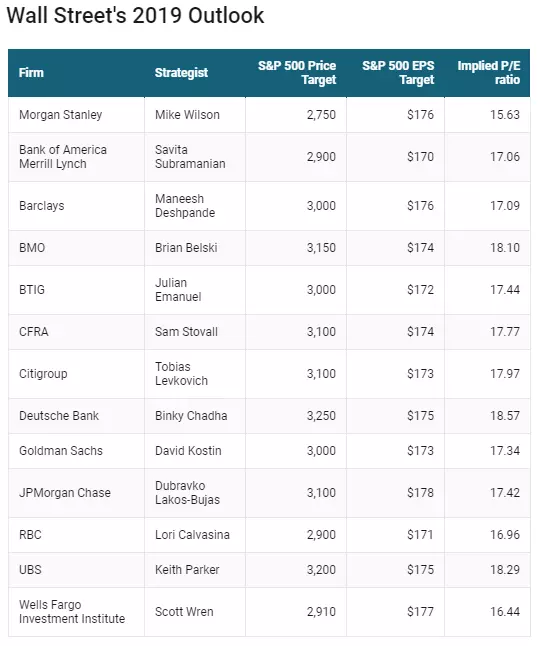
Source: CNBC
It is worthwhile noting that some investment banks, such as Morgan Stanley, believe that stocks are in a rolling 'bear market', with a 50% chance of a small earnings recession this year and a low target of $2,750 for December 2019.
So what does the SP500 CFD technical chart tell us about this time frame?
Long Term Trading View: SP500 Index CFD
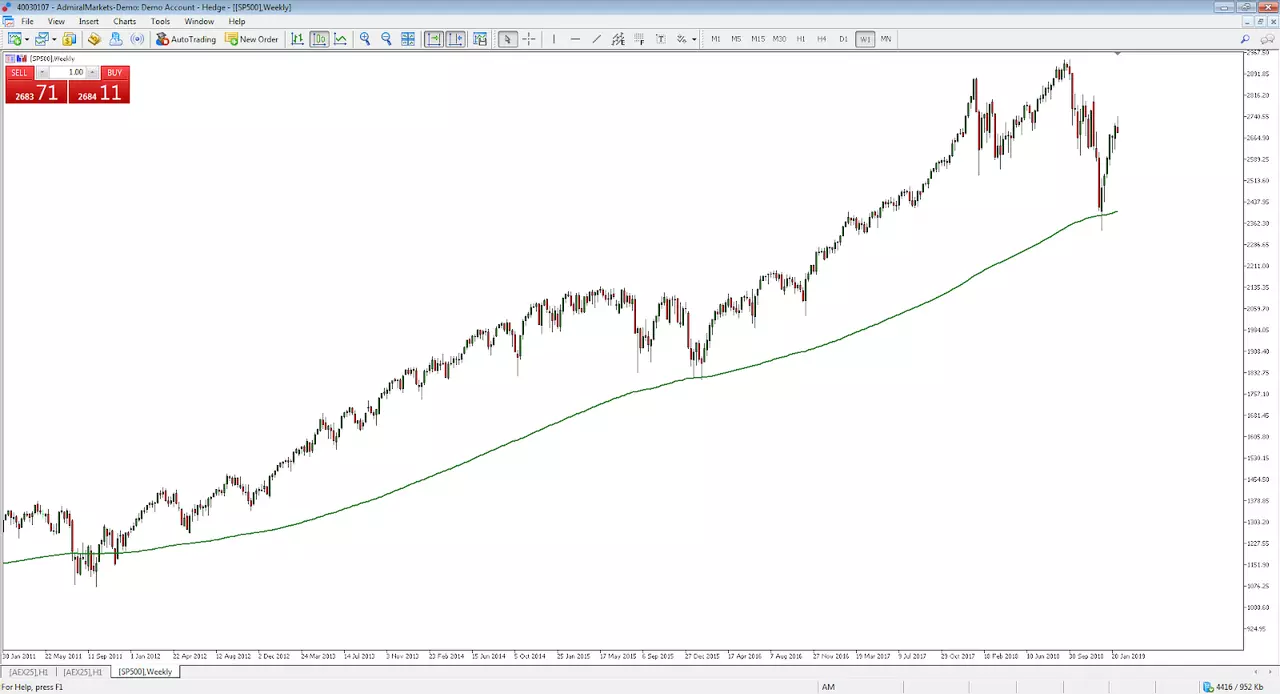
Source: Admiral Markets MT5 Supreme Edition, SP500, Weekly - Data range: from January 30, 2011, to February 8, 2019, accessed on February 8, 2019, at 4:14pm GMT. - Please note: Past performance is not a reliable indicator of future results.
In the SP500 CFD weekly chart shown above, it is clear to see the long term picture remains bullish. While the sharp drop in 2018 is evident, the market has since bounced higher off the 200 weekly moving average (the green line).
The last time the market bounced off this moving average was the week of February 7, 2016. After this period, the market made a series of swings, with higher high and higher low cycles trending for the proceeding several years.
Longer term traders will be looking for the market to repeat similar characteristics, either to keep them in their long positions, or to initiate new positions in line with the overall trend. As the S&P 500 is an index of the largest five-hundred stocks listed on the New York Stock Exchange, some advanced traders may use the index as an indicator of overall sentiment to aid in their decision to trade individual stocks and shares.
Short Term Trading View: SP500 CFD
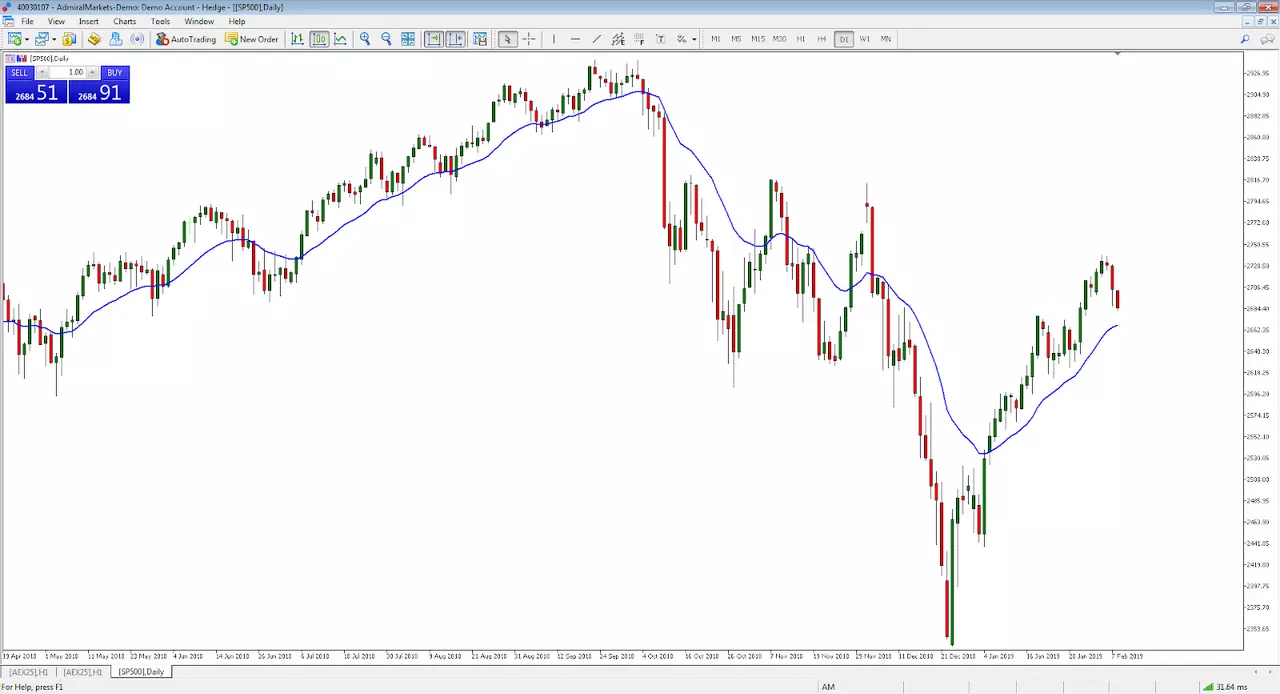
Source: Admiral Markets MT5 Supreme Edition, SP500, Daily - Data range: from April 19, 2018, to February 8, 2019, accessed on February 8, 2019, at 4:22pm GMT. - Please note: Past performance is not a reliable indicator of future results.
The above chart shows daily price action bars of the SP500 CFD. The blue line represents the 20 daily moving average. Shorter term traders may use this as a short term trend filter and look for long positions when price is above the line, and short positions when price falls below it. This could help to stay with the 'momentum' of the market.
Price action-based strategies could aid in identifying possible turning points within this momentum. For example, an inside bar is a popular price action pattern that represents a pause in the market. It is shown by a daily bar's high and low price range trading within the high and low price range of its previous bar. The theory is that this pause in the market is like a 'breather' before the market breaks out and continues in its trend.
On January 29, 2019, an inside bar formed on the chart of the SP500 CFD. Traders could have entered a buy order at the high of the inside bar, $2,652, with a stop loss at the low of the inside bar, $2,628.
With a 10 lot position size, this would result in a $240 loss if the entry and then stop loss was triggered. However, in this instance, the index continued to move higher. Trailing the stop loss beneath each daily bar's low would have resulted in an exit on February 7 at $2,723. This would have resulted in an approximate profit of $710.
Conclusion
While most analysts are seemingly bullish on the S&P 500 index for the end of the year, the market may see a lot of up and down volatility before then. Using a combination of both short term and long term trading strategies could prove to be effective for those happy with the risk. How will you be trading this year?
The given data provides additional information regarding all analysis, estimates, prognosis, forecasts or other similar assessments or information (hereinafter "Analysis") published on the website of Admiral Markets. Before making any investment decisions please pay close attention to the following:
- The analysis is published for informative purposes only and are in no way to be construed as investment advice or recommendation.
- Any investment decision is made by each client alone whereas Admiral Markets shall not be responsible for any loss or damage arising from any such decision, whether or not based on the Analysis.
- Each of the Analysis is prepared by an independent analyst (Jitan Solanki, Freelance Contributor) based on personal estimations.
- To ensure that the interests of the clients would be protected and objectivity of the Analysis would not be damaged Admiral Markets has established relevant internal procedures for prevention and management of conflicts of interest.
- Whilst every reasonable effort is taken to ensure that all sources of the Analysis are reliable and that all information is presented, as much as possible, in an understandable, timely, precise and complete manner, Admiral Markets does not guarantee the accuracy or completeness of any information contained within the Analysis. The presented figures refer that refer to any past performance is not a reliable indicator of future results.
- The contents of the Analysis should not be construed as an express or implied promise, guarantee or implication by Admiral Markets that the client shall profit from the strategies therein or that losses in connection therewith may or shall be limited.
- Any kind of previous or modeled performance of financial instruments indicated within the Publication should not be construed as an express or implied promise, guarantee or implication by Admiral Markets for any future performance. The value of the financial instrument may both increase and decrease and the preservation of the asset value is not guaranteed.
- The projections included in the Analysis may be subject to additional fees, taxes or other charges, depending on the subject of the Publication. The price list applicable to the services provided by Admiral Markets is publicly available from the website of Admiral Markets.

