Estee Lauder announces mixed results with reduced revenue

2020 will be remembered for being the year of Covid-19, which has not only directly affected people's health by collapsing healthcare systems, but by impacting our habits and lifestyles. We stopped going to the gym, working in offices, attending sporting events, attending the theatre, seeing movies, visiting museums, and travelling.
These changes also affect our physical appearance, since by reducing our social activity to a minimum, spending much more time at home with closed circles of people, we have stopped buying clothes and getting ready to go out, which impacts the results from companies like Estee Lauder, as the obligation to wear masks, the lack of nightlife and teleworking has reduced the use of makeup.
During yesterday’s trading day, the company announced its quarterly results. Despite the fact that we could observe an increase in the earnings per share, its income did not reach the expectations of the market consensus. Specifically, earnings per share were $1.59. with an income of $3.87 billion, versus $1.32 and $ 3.94 billion expected.
As in other sectors, the vaccination process and the control of the pandemic will be key for the coming months, since as this process advances, both tourism and leisure will gain more and more strength, generating greater demand for both the makeup and different skin protection creams for the summer.
Yesterday, after these results were announced, Estee Lauder lost 7.90% in the stock market causing the price to lose $300 per share, closing at $288.89, in the vicinity of the 38.2% Fibonacci retracement level that currently acts as its first support. The loss of this level could cause a further retracement in search of its next level of support at the previous lows in the red band or even up to the 50% Fibonacci level.
Over the last year, this company has followed a strong upward trend, as we can see in the daily chart, driven by the strong rises in the US stock markets. Specifically, after setting minimums on March 18, 2020, at $136.11, the price began a spectacular bullish rally that led it to reach maximums on April 29 at $318.27 per share, which represents an increase of 133, or 83%, despite the accumulated overbought and the bearish divergence that we can observe in recent months in its stochastic and MACD indicators respectively.
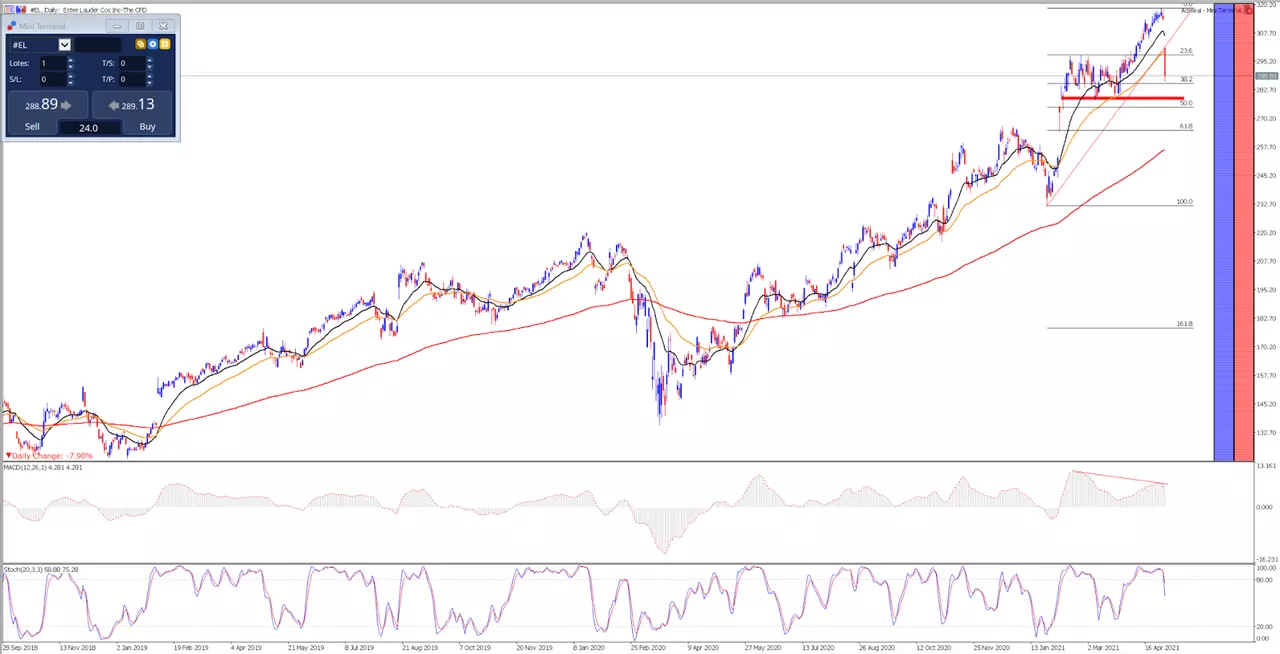
Source: Admiral Markets MetaTrader 5. Estee Lauder daily chart. Data range: from December 28, 2018, to May 4, 2021. Prepared on May 4, 2021, at 11:55 am CEST. Keep in mind that past returns do not guarantee future returns.
Price evolution of the last 5 years:
- 2020: 28.88%
- 2019: 58.75%
- 2018: 2.25%
- 2017: 66.35%
- 2016: -13.14%
With the Admiral Markets Trade.MT5 account, you can trade Contracts for Differences (CFDs) of Estee Lauder and more than 3000 stocks! CFDs allow traders to try to profit from the bull and bear markets, as well as the use of leverage. Click on the following banner to open an account today:

INFORMATION ABOUT ANALYTICAL MATERIALS:
The given data provides additional information regarding all analysis, estimates, prognosis, forecasts, market reviews, weekly outlooks or other similar assessments or information (hereinafter “Analysis”) published on the websites of Admiral Markets investment firms operating under the Admiral Markets trademark (hereinafter “Admiral Markets”) Before making any investment decisions please pay close attention to the following:
- This is a marketing communication. The content is published for informative purposes only and is in no way to be construed as investment advice or recommendation. It has not been prepared in accordance with legal requirements designed to promote the independence of investment research, and that it is not subject to any prohibition on dealing ahead of the dissemination of investment research.
- Any investment decision is made by each client alone whereas Admiral Markets shall not be responsible for any loss or damage arising from any such decision, whether or not based on the content.
- With view to protecting the interests of our clients and the objectivity of the Analysis, Admiral Markets has established relevant internal procedures for prevention and management of conflicts of interest.
- The Analysis is prepared by an independent analyst, Roberto Rojas (analyst), (hereinafter “Author”) based on their personal estimations.
- Whilst every reasonable effort is taken to ensure that all sources of the content are reliable and that all information is presented, as much as possible, in an understandable, timely, precise and complete manner, Admiral Markets does not guarantee the accuracy or completeness of any information contained within the Analysis.
- Any kind of past or modeled performance of financial instruments indicated within the content should not be construed as an express or implied promise, guarantee or implication by Admiral Markets for any future performance. The value of the financial instrument may both increase and decrease and the preservation of the asset value is not guaranteed.
- Leveraged products (including contracts for difference) are speculative in nature and may result in losses or profit. Before you start trading, please ensure that you fully understand the risks involved.

