The U.S. Thanksgiving holiday kicks off Holiday shopping
During today's session, Japan’s main index has seen a rise of 0.67%, or 196.62 points, leaving the Nikkei 225 index at 29,499.28 points. This continues the upward trend of recent days, leading the price towards the psychological figure of 30,000 points before continuing in search of its zone of annual highs.
After the increases in Japan, the European session continues the increases in its main stock markets despite the fact that the German GDP data for the third quarter has been slightly worse than expected by the market consensus, growing by 1.7% compared to the expected 1.8%.
But without a doubt, the Thanksgiving holiday in the United States is what will mark today's session. And due to the holiday, there will be no Wall Street updates.
As it does every year, Thanksgiving is the prelude to one of the most anticipated days of the year, since during Black Friday there are strong discounts on the different products, announcing the start of Christmas shopping. So during this weekend, a strong avalanche of purchases are expected in both physical stores and across the internet, with Amazon acting as one of the main protagonists of this weekend.
During the Black Friday campaign last year, Amazon obtained revenue of $4.8 billion dollars, an increase of 60% if we compare it with the income obtained during the year 2019. So as we can see, the Covid-19 pandemic past year was key when making the decision whether to make purchases physically or through the internet.
This year, as autumn progresses and winter approaches, we are seeing a progressive increase in Covid-19 cases. However, the overall pandemic has improved considerably due to the vaccination process of the population, so this could considerably affect sales through electronic platforms.
Therefore, we must be very attentive to the sales figures published by both Amazon and other e-commerce platforms, since these could have a significant impact if the data is worse than last year’s.
Technically speaking, Amazon is up 9.93% this year, and is currently facing its main support level in the coincident zone of its 18-session blank moving average and the important level of support/resistance represented by the orange stripe after bouncing lower from the area of its annual highs in a possible double-top formation represented by the green strip.
Good sales data during this campaign could again give a boost to the price and this could look again for the zone of historical maximums. On the contrary, a not entirely satisfactory campaign could generate a bearish breakout of this important support level, causing a further correction possibly in search of its long-term uptrend line.
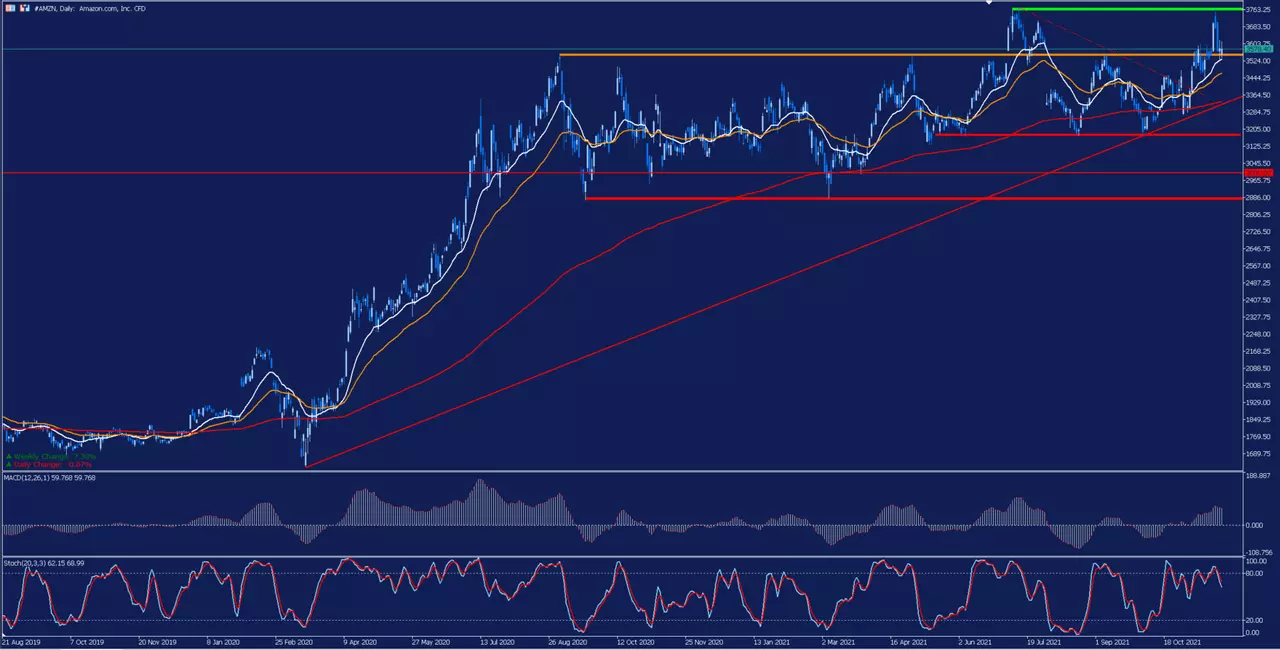
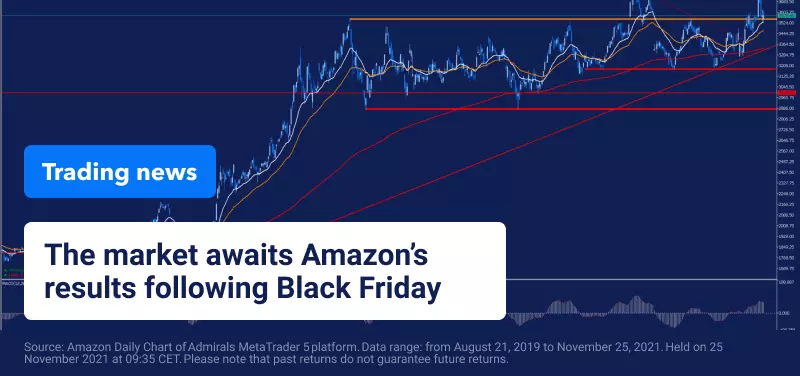
Source: Amazon Daily Chart on Admirals MetaTrader 5 platform. Data range: from August 21, 2019, to November 25, 2021. Held on 25 November 2021 at 09:35 CET. Please note that past returns do not guarantee future returns.
Price evolution in the last 5 years:
- 2020: 76.26%
- 2019: 23.03%
- 2018: 28.43%
- 2017: 55.96%
- 2016: 10.95%
With the Admirals Trade.MT5 account, you can trade Contracts for Differences (CFDs) of Amazon and more than 3000 stocks! CFDs allow traders to try to profit from the bull and bear markets, as well as the use of leverage. Click on the following banner to open an account today:

INFORMATION ABOUT ANALYTICAL MATERIALS:
The given data provides additional information regarding all analysis, estimates, prognosis, forecasts, market reviews, weekly outlooks or other similar assessments or information (hereinafter “Analysis”) published on the websites of Admiral Markets investment firms operating under the Admiral Markets trademark (hereinafter “Admiral Markets”) Before making any investment decisions please pay close attention to the following:
- This is a marketing communication. The content is published for informative purposes only and is in no way to be construed as investment advice or recommendation. It has not been prepared in accordance with legal requirements designed to promote the independence of investment research, and that it is not subject to any prohibition on dealing ahead of the dissemination of investment research.
- Any investment decision is made by each client alone whereas Admiral Markets shall not be responsible for any loss or damage arising from any such decision, whether or not based on the content.
- With view to protecting the interests of our clients and the objectivity of the Analysis, Admiral Markets has established relevant internal procedures for prevention and management of conflicts of interest.
- The Analysis is prepared by an independent analyst, Roberto Rojas (analyst), (hereinafter “Author”) based on their personal estimations.
- Whilst every reasonable effort is taken to ensure that all sources of the content are reliable and that all information is presented, as much as possible, in an understandable, timely, precise and complete manner, Admiral Markets does not guarantee the accuracy or completeness of any information contained within the Analysis.
- Any kind of past or modeled performance of financial instruments indicated within the content should not be construed as an express or implied promise, guarantee or implication by Admiral Markets for any future performance. The value of the financial instrument may both increase and decrease and the preservation of the asset value is not guaranteed.
- Leveraged products (including contracts for difference) are speculative in nature and may result in losses or profit. Before you start trading, please ensure that you fully understand the risks involved.

