

Weekly Market Outlook: Central Banks, US Jobs & Earnings in Focus
It’s a big week ahead with three major central banks providing their latest interest rate decision and monetary policy outlook. It starts with the Reserve Bank of Australia (RBA) Statement on Tuesday, then the Bank of England (BOE) Monetary Policy Report on Thursday followed by the European Central Bank (ECB) press conference a few hours later.
The market is expecting an interest rate hike from the Bank of England this Thursday. Expect heightened volatility in the British pound (GBP) and UK stocks. The outlook from the central bank will be the most important as markets expect UK interest rates to be at the highest level since 2009 by the end of the year.
The week ends with the US Non-Farm Payroll report which is the most eagerly anticipated news item on the monthly economic calendar. It can be a mover for all markets so be sure to exercise good risk management principles this week.
This week’s earnings announcements include reports from Amazon, Alphabet, PayPal, Spotify, eBay, Shell, Ford and others.
You can learn more about some of the global themes affecting the markets in this selection of education articles.
Weekly Forex Calendar
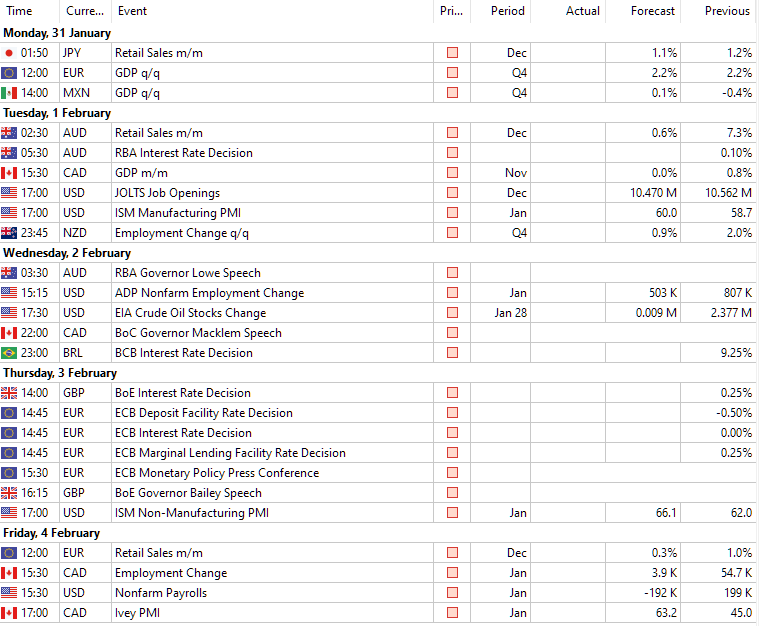
Source: Forex Calendar from the MetaTrader 5 trading platform provided by Admirals.
Did you know that three times a week, three professional traders talk through the markets live and show you how to identify potential trading opportunities?
Reserve your complimentary spot in the Admirals Spotlight webinar now by clicking the banner below!

Trader’s Radar – Bank of England Official Bank Rate
On Thursday 3 February at 12.00 pm GMT, the Bank of England (BOE) will announce its latest interest rate decision. This will be followed by a speech from BOE Governor Andrew Bailey about the decision and the accompanying monetary policy report.
The markets are expecting the central bank to increase interest rates 25 bps from 0.25% to 0.50%. Inflation is currently at record levels in the UK, employment is strong and the Omicron Covid-variant was less impactful on the economy than expected. The strength of the economy is why the markets believe the central bank will increase rates this week.
However, much of the expectation may already be priced in. The British pound has been a lot stronger against the commodity currencies such as the Australian dollar and New Zealand dollar. The US dollar has been even stronger than the British pound due to the expectation of the Fed increasing interest rates as well.
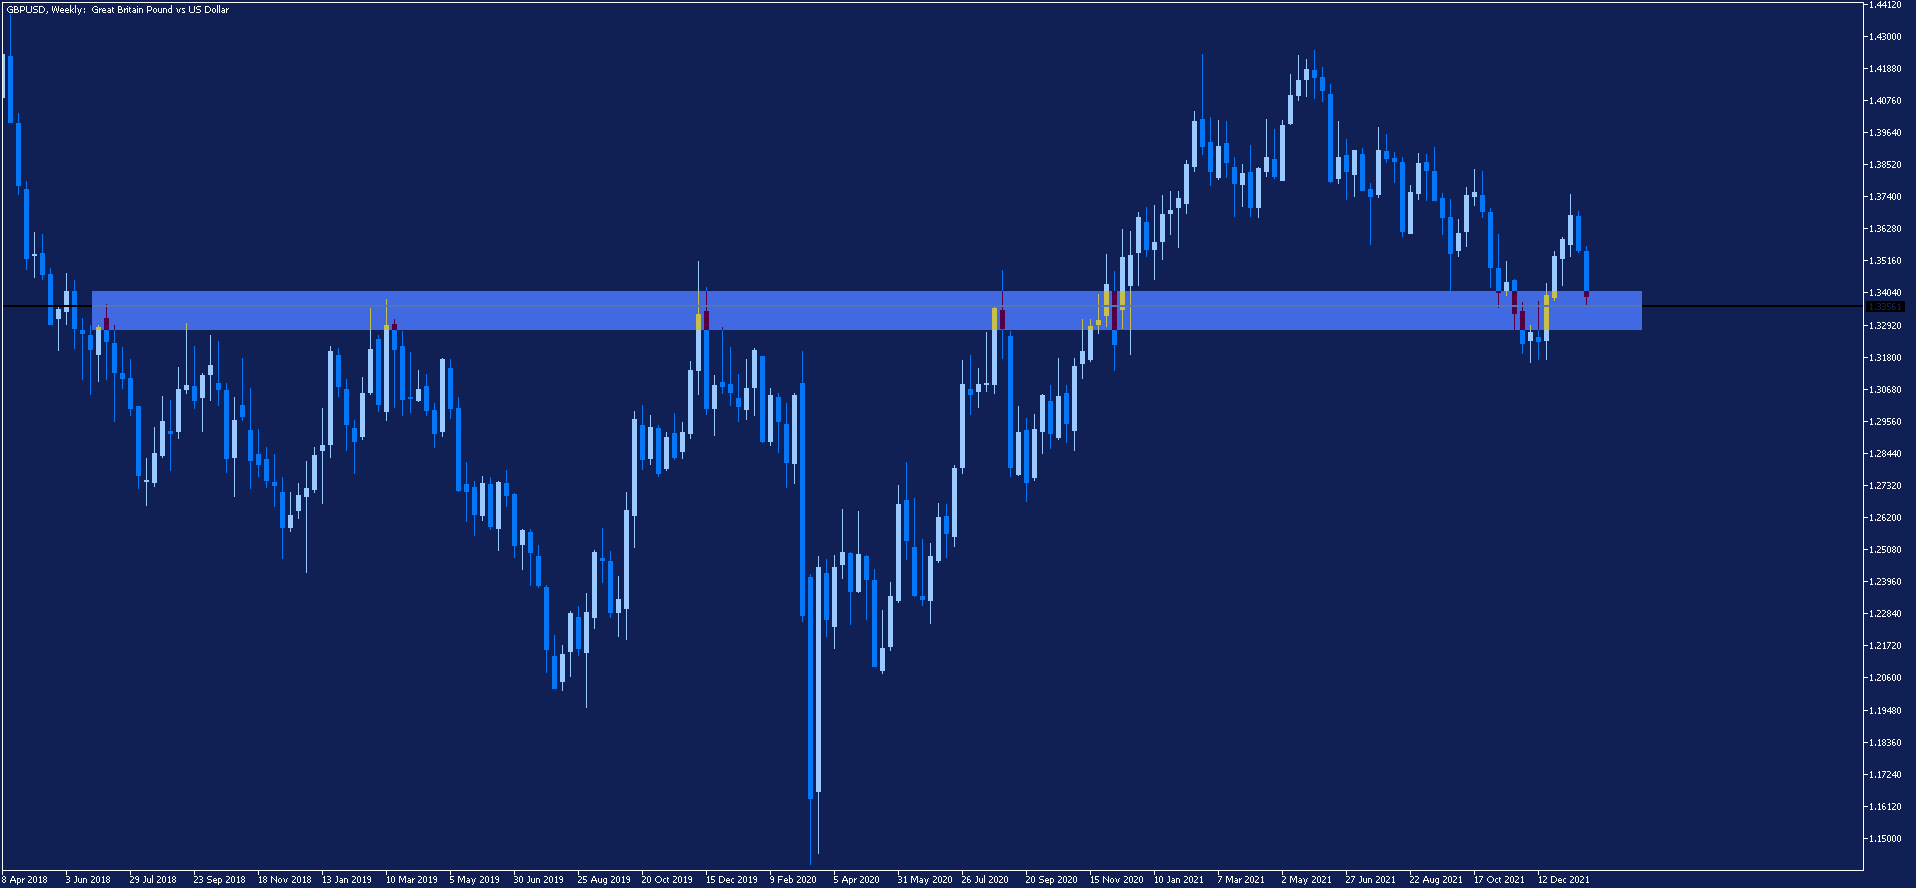
Source: Admirals MetaTrader 5, GBPUSD, Monthly - Data range: from 1 Jul 2005 to 30 Jan 2022, performed on 30 Jan 2022 at 7:00 pm GMT. Please note: Past performance is not a reliable indicator of future results.
The price of GBPUSD is currently trading around horizontal support between 1.3400 and 1.3200. The price of the currency pair has turned at these levels before in 2018, 2019 and 2020.
If the buyers remain bullish on the prospects of the UK economy, these levels may serve as a platform for them to build upon. However, a break below from investors opting for the US dollar instead could see some further downside.
If you’re feeling inspired and ready to trade live in the market, you can open a live trading account by clicking on the banner below and accessing an impressive range of trading features to support you in your journey.

Corporate Trading Updates and Stock Indices
Global stock market indices had a tough start to the year with the majority of them declining in near double-digits. However, the sell-off cooled last week with most stock indices running into technical levels of horizontal support.
This could be a critical week for stock indices – especially with the US jobs report out on Friday. If sentiment can improve, then most stock indices are trading around technical levels for buyers to build upon. However, a break below these technical levels could see an even deeper sell-off occur.
This week’s earnings announcements include reports from Amazon, Alphabet, PayPal, Spotify, eBay, Shell, Ford and others.
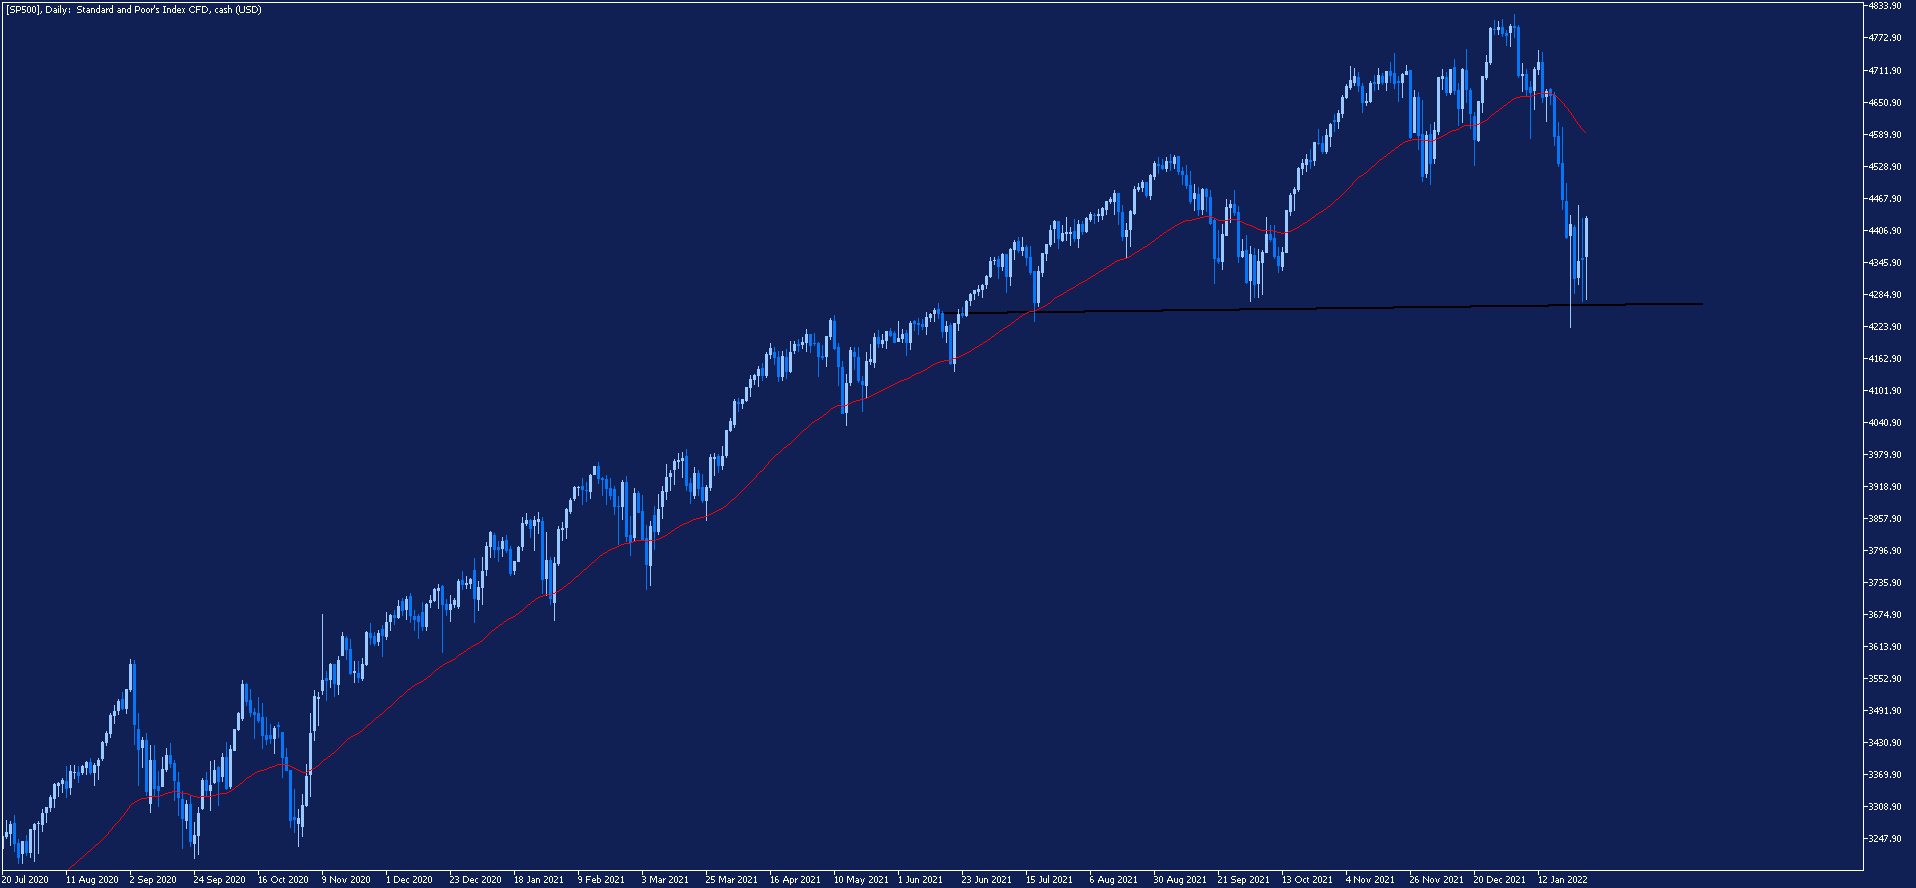
Source: Admirals MetaTrader 5, SP500, Daily - Data range: from 20 Jul 2020 to 30 Jan 2022, performed on 30 Jan 2022 at 6:30 pm GMT. Please note: Past performance is not a reliable indicator of future results. Past five-year performance of the S&P 500: 2021 = 26.99%, 2020 = +16.17%, 2019 = +29.09%, 2018 = -5.96%, 2017 = +19.08%
The S&P 500 stock market index’s sell-off stalled last week at horizontal support where buyers have turned before, around the $4,272.00 price level. The market already turned higher at the end of last week and it will be interesting to see if buyers can start an uptrend from here or if the price will break through for a deeper correction.
Traders may use the Admirals Trade.MT4 and Trade.MT5 accounts to trade contracts for differences (CFDs) on stock indices and other markets which enables you to trade long and short. Alternatively, investors may use this sell-off to identify high-quality stocks trading at lower prices to invest in from the Invest.MT5 account.
Did you know that you can use the Trading Central Technical Ideas Lookup indicator to find actionable trading ideas on this index and thousands of other instruments across Forex, stocks, indices, commodities and more?
You can get this indicator completely FREE in the Premium Analytics section once you open an account...

INFORMATION ABOUT ANALYTICAL MATERIALS:
The given data provides additional information regarding all analysis, estimates, prognosis, forecasts, market reviews, weekly outlooks or other similar assessments or information (hereinafter “Analysis”) published on the websites of Admirals investment firms operating under the Admirals trademark (hereinafter “Admirals”) Before making any investment decisions please pay close attention to the following:
- This is a marketing communication. The content is published for informative purposes only and is in no way to be construed as investment advice or recommendation. It has not been prepared in accordance with legal requirements designed to promote the independence of investment research, and that it is not subject to any prohibition on dealing ahead of the dissemination of investment research.
- Any investment decision is made by each client alone whereas Admirals shall not be responsible for any loss or damage arising from any such decision, whether or not based on the content.
- With a view to protecting the interests of our clients and the objectivity of the Analysis, Admirals has established relevant internal procedures for the prevention and management of conflicts of interest.
- The Analysis is prepared by an independent analyst, Jitan Solanki (analyst), (hereinafter “Author”) based on their personal estimations.
- Whilst every reasonable effort is taken to ensure that all sources of the content are reliable and that all information is presented, as much as possible, in an understandable, timely, precise and complete manner, Admirals does not guarantee the accuracy or completeness of any information contained within the Analysis.
- Any kind of past or modelled performance of financial instruments indicated within the content should not be construed as an express or implied promise, guarantee or implication by Admirals for any future performance. The value of the financial instrument may both increase and decrease and the preservation of the asset value is not guaranteed.
- Leveraged products (including contracts for difference) are speculative in nature and may result in losses or profit. Before you start trading, please ensure that you fully understand the risks involved.
