Spinning Top Candlestick Pattern Analysis
Candlestick patterns have become popular for analysing market price action and behaviour. Many traders also use them to develop strategies to help identify potential trading opportunities. There are many different candlestick patterns, but the spinning top candlestick offers some interesting insights.
This material is for informational purposes only and not financial advice. Consult a financial advisor before making investment decisions.

Table of Contents
Key Takeaways
- The spinning top candlestick is one that specifically identifies a neutral bias in the market and possible indecision about its future direction.
- A spinning top has a small body that is in the centre of a long upper and lower wick.
- They help to identify trend exhaustion and indecision in the market and can be used for general market understanding or for potential trading ideas.
- As spinning tops represent psychological insight of buyers and sellers, they can be used across all global and UK markets.
- The Admirals Premium Analytics Screener can automatically identify multiple chart and candlestick patterns on 8,000+ instruments, including UK shares.
Demystifying the Spinning Top Candlestick
In this section, we discuss what a spinning top candlestick pattern looks like, the information it provides and how to ascertain its reliability.
What is a Spinning Top Candlestick?
A spinning top candlestick pattern has a small body centred between a long upper and lower wick.
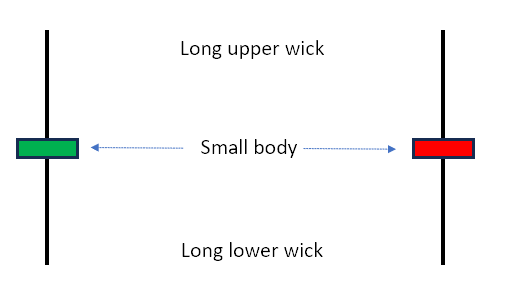
A spinning top represents a big battle between the buyers and sellers, driving the market higher and lower through the long upper and lower wicks. However, the small body represents the market closed similarly to where it opened, but with no one gaining the upper hand to take the market higher or lower. Depending on the context, this could mean several things.
After a strong trend, it could represent exhaustion from one side of the market and could be used as a signal to exit a trade or enter a potential market reversal trade.
If spinning tops occur in a range-based market, it confirms that no one is ready to take directional control of the market, and more indecision and sideways price action could ensue. This can help in knowing when to stay out of the market or support the application of range-based trading strategies.
Identifying Spinning Tops: Bullish vs. Bearish Implications
As spinning tops can represent indecision or exhaustion in the market, they can have both bullish and bearish implications. Which one depends on the preceding market context.
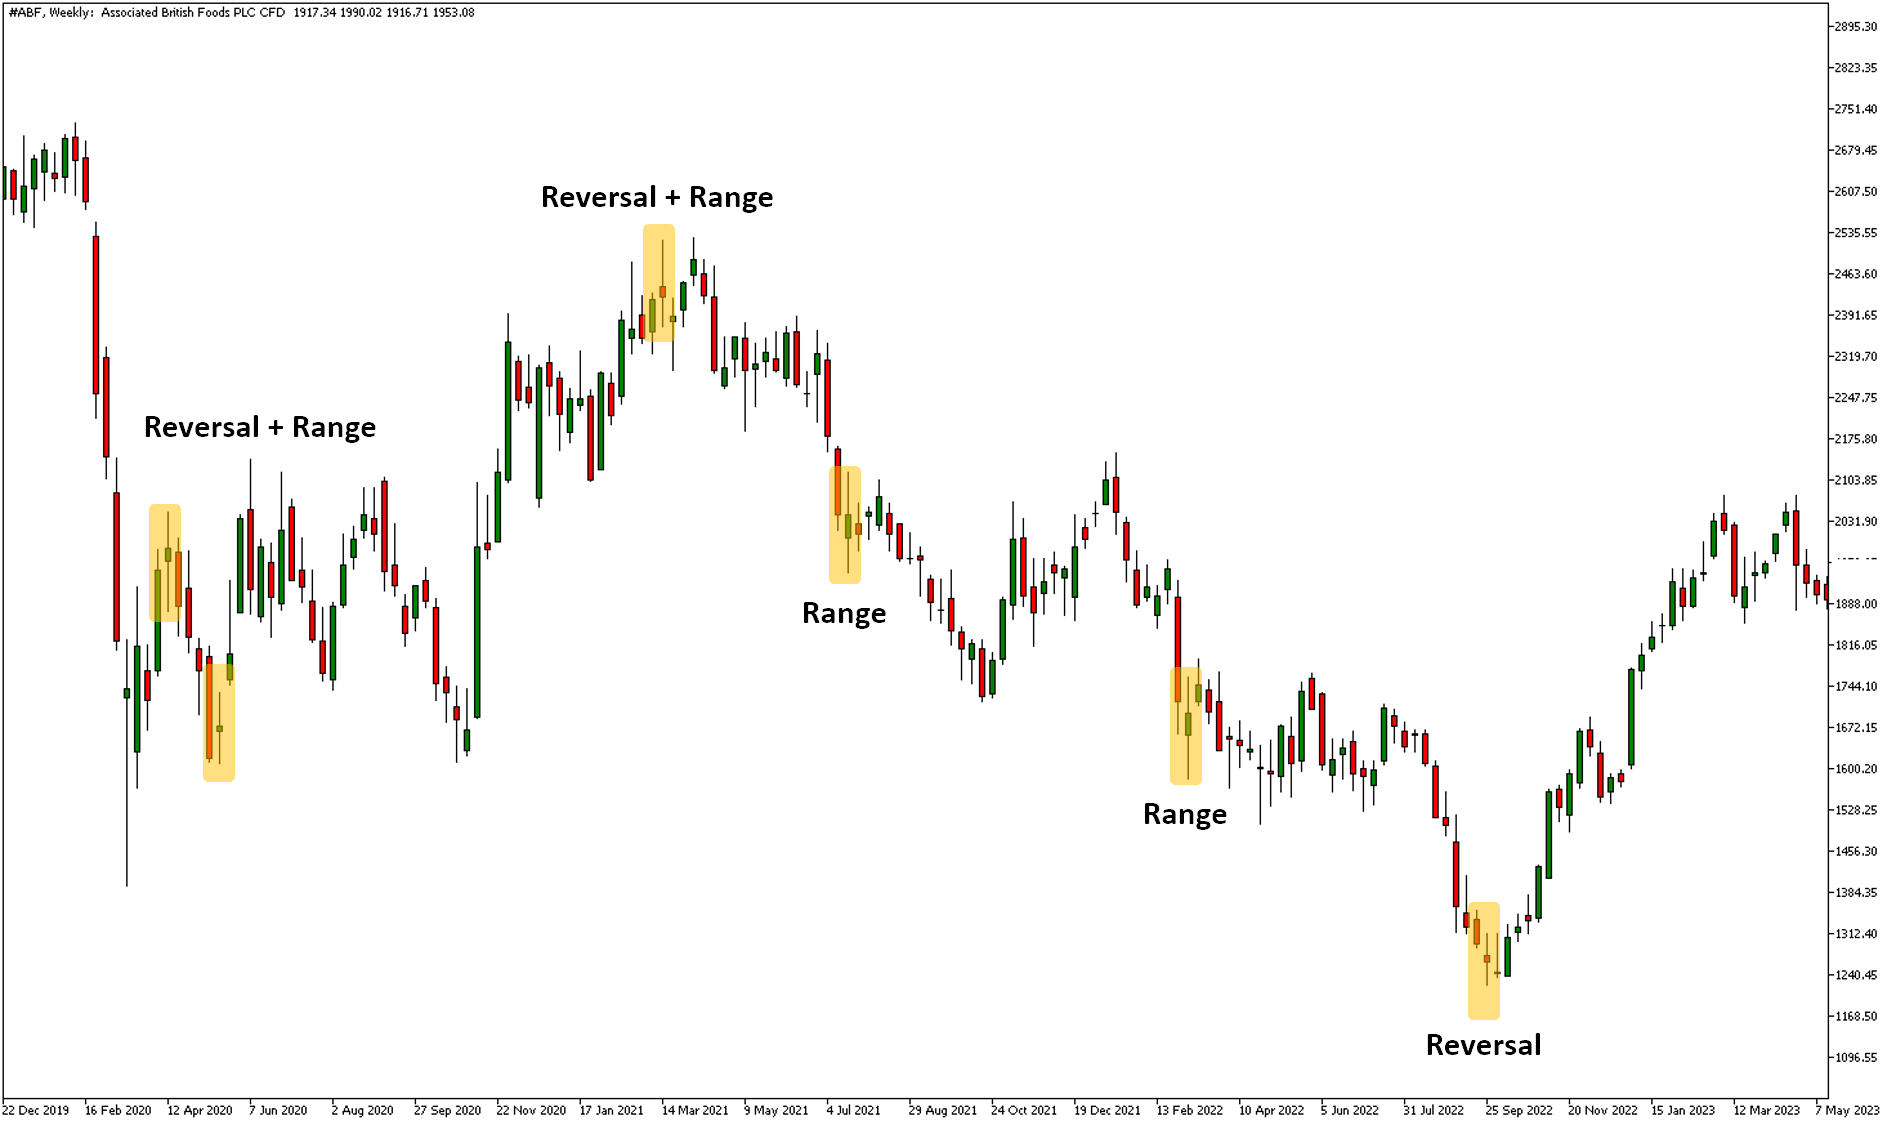
In the weekly share price chart of UK company Associated British Foods (ABF) during 2019 and 2023, there are multiple instances of spinning top candlestick patterns (highlighted in yellow). These examples have a small body in the centre of the candles with long upper and lower wicks relative to the body.
In some instances, the spinning top candle led to the exhaustion of a trend and a reversal. In other instances, it led to more indecision and sideways, range-based movement.
The largest similarity is that in each case, the spinning top caused price to stall first and then either put in a bearish or bullish reversal or range before continuing a trend. Therefore, analysing the broader context is important in knowing whether a spinning top is a bullish or bearish signal.
This is where other indicators and technical clues can be useful, as discussed further down this guide. It is important to note that no one pattern is foolproof, so any analysis should be interpreted with caution.
Assessing Spinning Top Reliability: Timeframes and Context Matter
As we've already seen in the last section, the reliability of a spinning top depends on the context they are applied. For example:
- A spinning top at the end of a trend could signify an exhaustion that could lead to a trend reversal or a pause before the trend continues.
- If there is no clear trend, a spinning top could confirm indecision in the market resulting in more range-based activity.
The timeframe you choose to trade on can also affect the reliability of a spinning top. Higher timeframes such as the monthly, weekly and daily charts represent the buying and selling activity over a longer period of time. Therefore, analysing these charts may give a clearer understanding of what's happening in the market.
The lower the timeframe you go, the more short-term price activity you see and, therefore, more randomness. For example, on a 60-minute, 30-minute or 5-minute chart, the market context can change very quickly. This could result in seeing many spinning tops but more difficult in ascertaining what they are telling you.
However, using multiple timeframe analysis and combining what is happening on both higher and lower timeframes may help to provide a much clearer picture of what is happening in the market. This understanding can provide greater context in the application of spinning top candles.
Spinning Tops in Action: Applying Them in the Market
There are several different ways to apply spinning tops in the market. Many traders will use candlestick patterns in combination with other technical analysis indicators to build a broader picture of what is happening in the market. Let's look at a few of these.
Combining Spinning Tops with Other Technical Indicators
While there are hundreds of different technical indicators, three stand out as interesting additions to spinning top patterns.
Moving Averages
A moving average provides a line on a chart that shows the average price direction of a market over a fixed period of time. They are commonly used to help identify the trend of the market as well as areas where the market could potentially turn.
Generally, when the price is below a moving average, it indicates selling momentum and when the price is above a moving average, it indicates buying momentum.
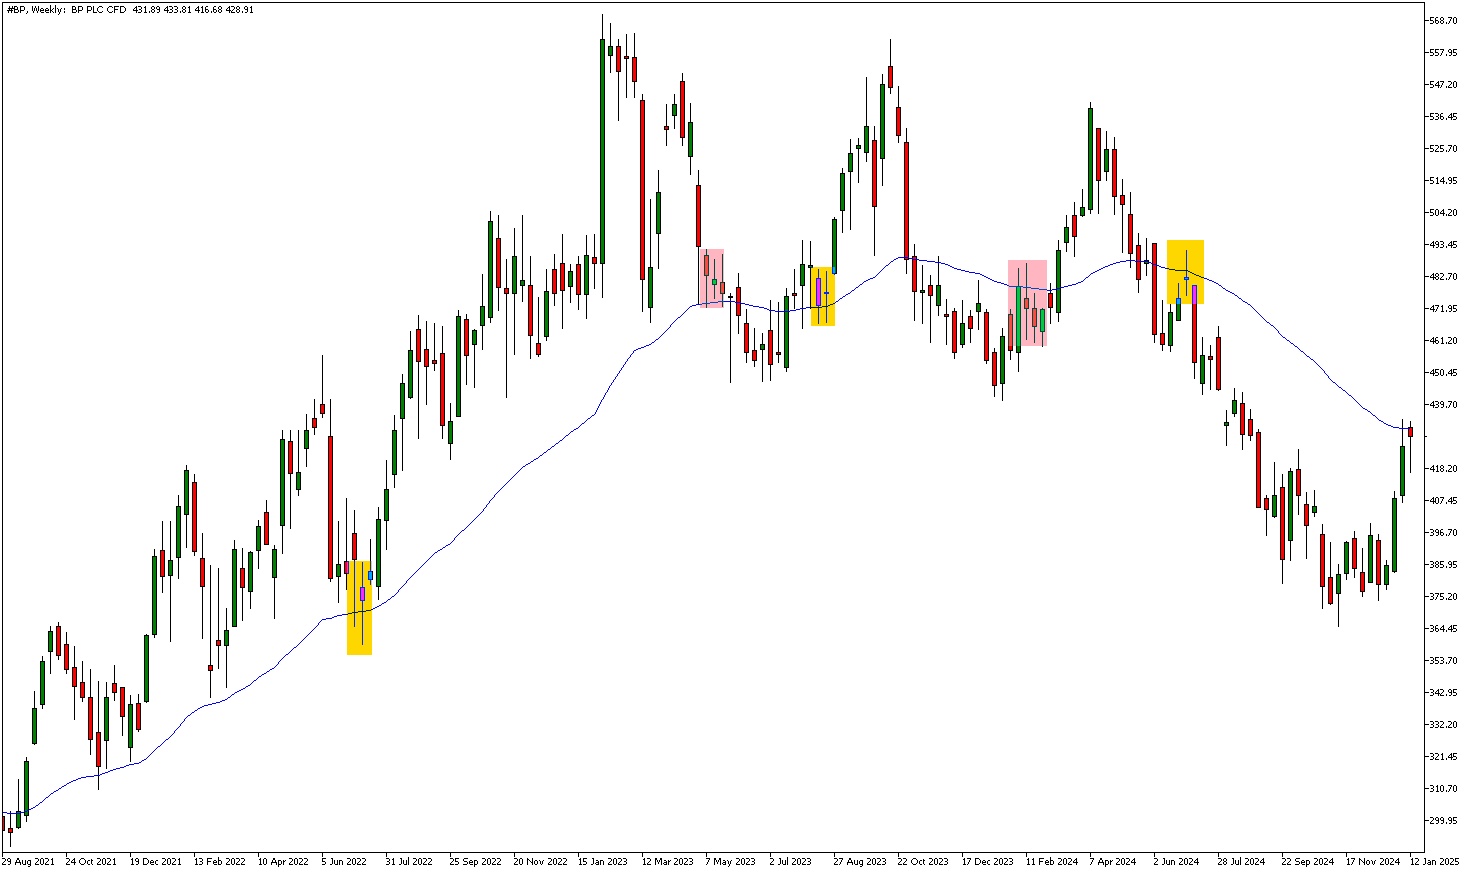
The chart above shows BP's share price from August 2021 to January 2025. The blue line on the chart is the 50 exponential moving average (EMA), which represents the average price over the last 50 weekly bars on the chart.
The yellow and red boxes are examples of spinning top candles that developed on the 50 EMA. On the three occasions highlighted by the yellow boxes, the market turned and moved in a directional manner - in line with the moving average. On the two occasions highlighted by the red boxes, the market didn't turn and break through the moving average.
This is a very small sample size, and past performance is not a reliable indicator of future results. By stacking different technical clues together, it can start to build a more probable picture. The most important factor is risk management and navigating the wins and losses that come with trading the market.
Relative Strength Index (RSI)
The relative strength index (RSI) is known as a momentum oscillator. It measures the speed and magnitude of a market's recent price action and can be used in several ways. The most common use is to help identify overbought and oversold conditions as well as divergences between price and the oscillator.
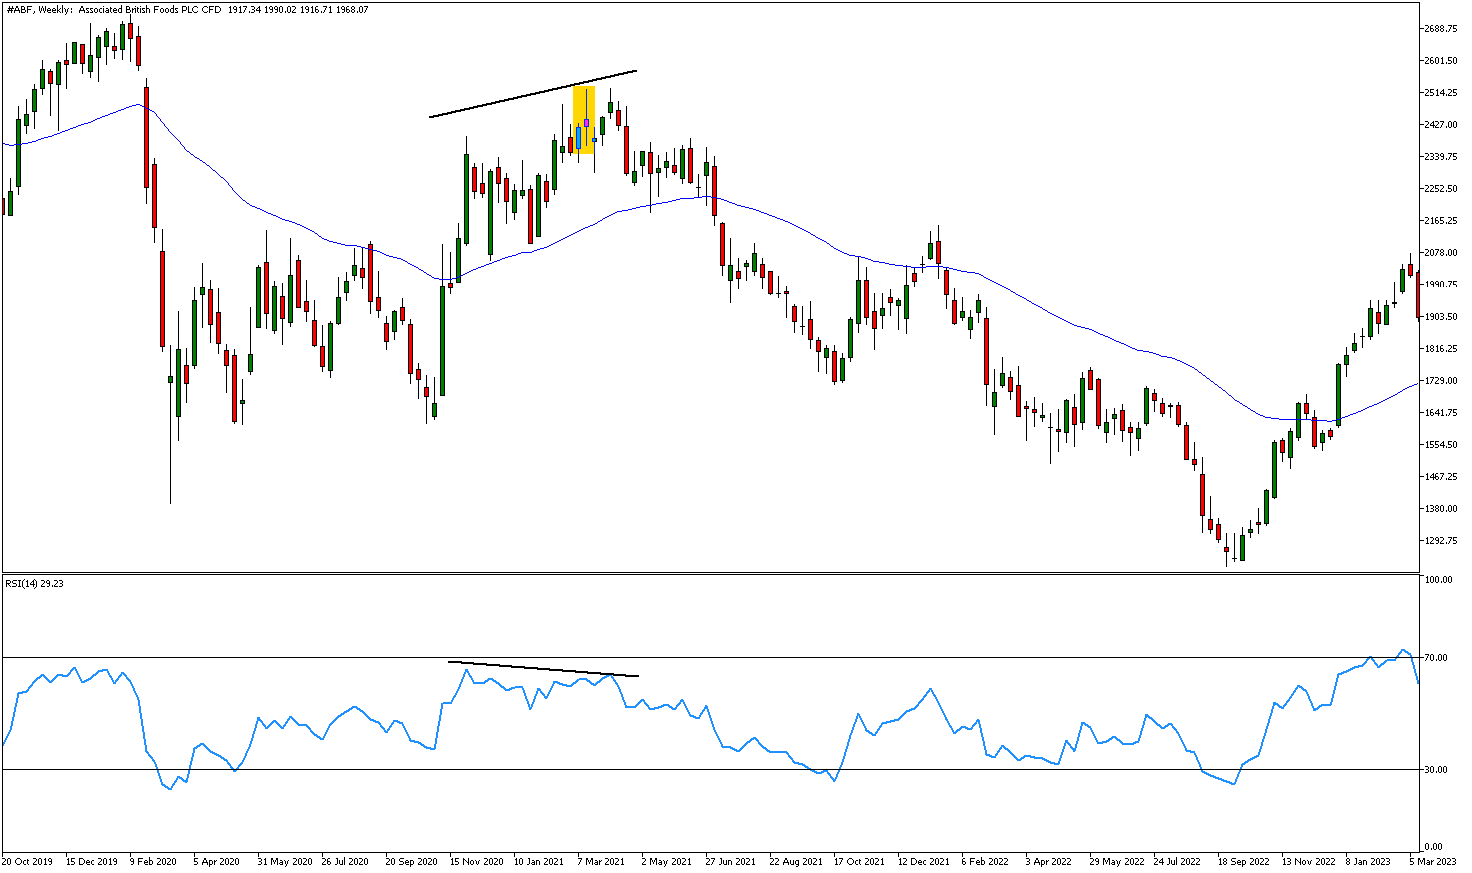
RSI divergence occurs when the RSI line is moving in the opposite direction of the market trend. In the chart above, the black line segment shows that price continued to trade higher in early 2021, but the RSI (14) indicator did not follow - it diverged.
This suggests that the move higher is weakening, and a reversal could follow. In these situations, if there is also a spinning top candle pattern suggesting the trend is exhausting, then there is a combination of factors that could lead to a reversal in price. However, there are no guarantees or certainties when trading the market.
Moving Average Convergence Divergence (MACD)
The MACD indicator is another technical analysis indicator that can help to confirm price trends, highlight overbought and oversold conditions and identify divergences in price trends.
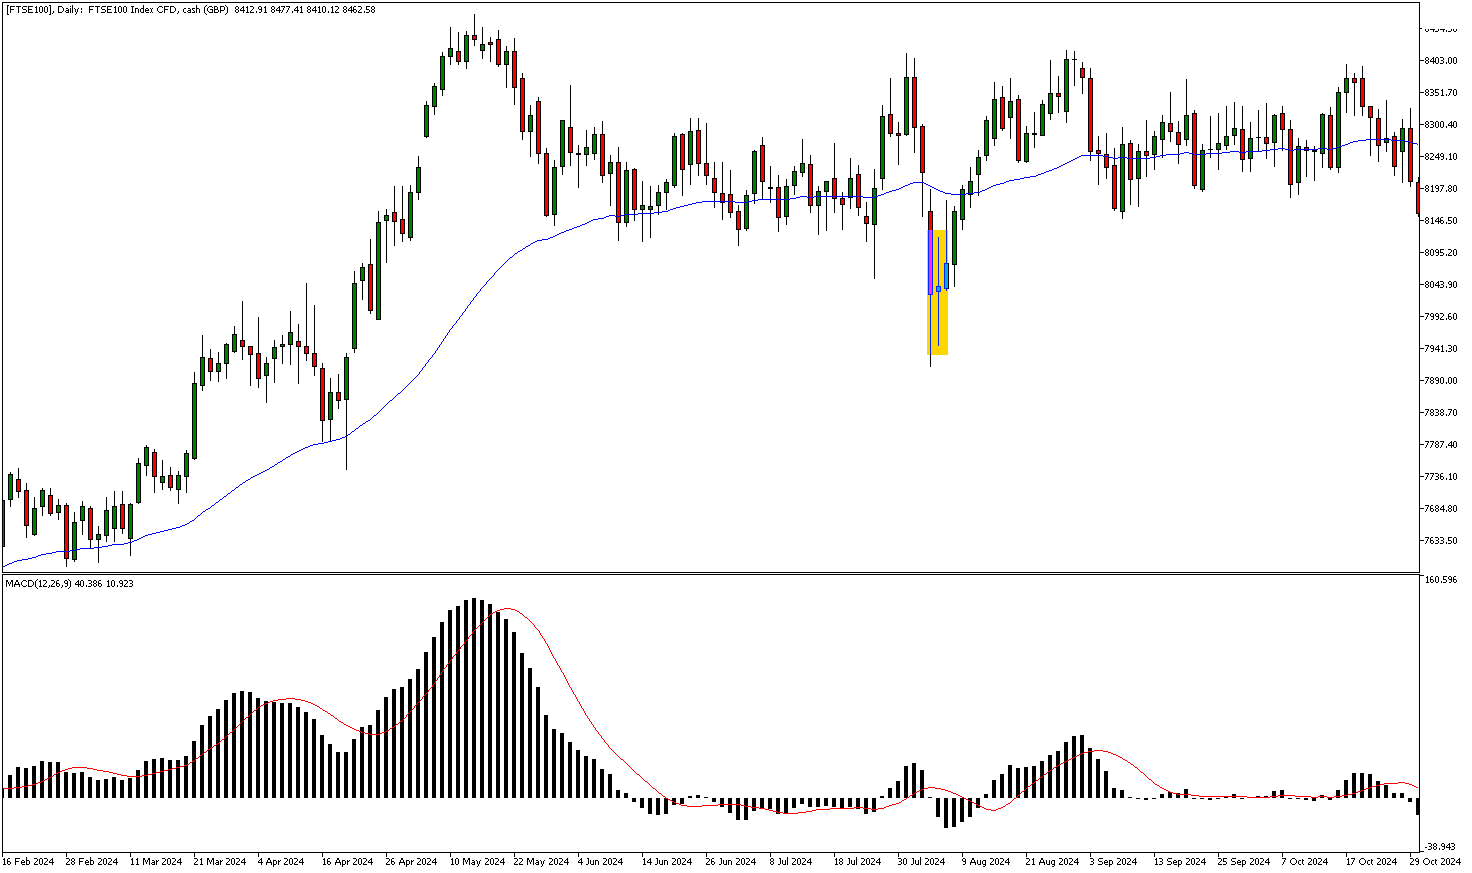
The daily chart above shows the FTSE100 stock market index with the MACD indicator. When the MACD is above the 0-line it indicates bullish momentum and when below the 0-line, bearish momentum. Some traders will then use this as a directional bias to trade with the trend or as a sign to look for reversals.
The yellow box highlights a spinning top formation after a recent move lower. During this time, the MACD was trading below the 0-line confirming the recent bearish momentum. Identifying reversals like this may also be more useful in a range-based market which the MACD can also help to identify.
Between February and May 2024, the MACD bars were very large and increasing, signifying high momentum and trend direction. However, over the next few months, the MACD bars were much smaller and frequently went above and below the 0 line rather than significantly moving away from it. This suggests the momentum of the market is low, signifying the potential of range-based price action.
Trading Strategies Using Spinning Top Candlesticks
A trading strategy is useful for traders to build focus and gain consistency. So, what is a strategy? It is a list of conditions to check before executing a trade. The conditions can range from technical analysis, candlestick patterns, indicators and fundamental analysis but should also include strict entry, exit and risk management criteria.
Below is an example of how to construct a strategy for educational purposes only.
Bullish Spinning Top Strategy
- Identify a spinning top candle on a monthly, weekly or daily chart
- If MACD is bullish and above zero and 50 EMA trade the trend
- If MACD is bearish and below zero and RSI (14) divergence trade a reversal
- Identify an additional level of support on the chart using a trendline or horizontal line
- Enter when the price breaks above the high of the spinning top candle with a stop loss on the low of the candle
- Keep the risk low and target at least one, but ideally two, times your risk
- Whether the trade wins or loses, record it in your trade journal and learn from it
Bearish Spinning Top Strategy
- Identify a spinning top candle on a monthly, weekly or daily chart
- If MACD is bearish and below zero and 50 EMA trade the trend
- If MACD is bullish and above zero and RSI (14) divergence trade a reversal
- Identify an additional level of resistance on the chart using a trendline or horizontal line
- Enter when the price breaks below the low of the spinning top candle with a stop loss on the high of the candle
- Keep the risk low and target at least one, but ideally two, times your risk
- Whether the trade wins or loses, record it in your trade journal and learn from it
The Admirals Premium Analytics Candlestick Stock Screener
For those interested in trading technical analysis patterns on global and UK markets, then the Premium Analytics feature can help. This feature offers a stock screener for different technical events.
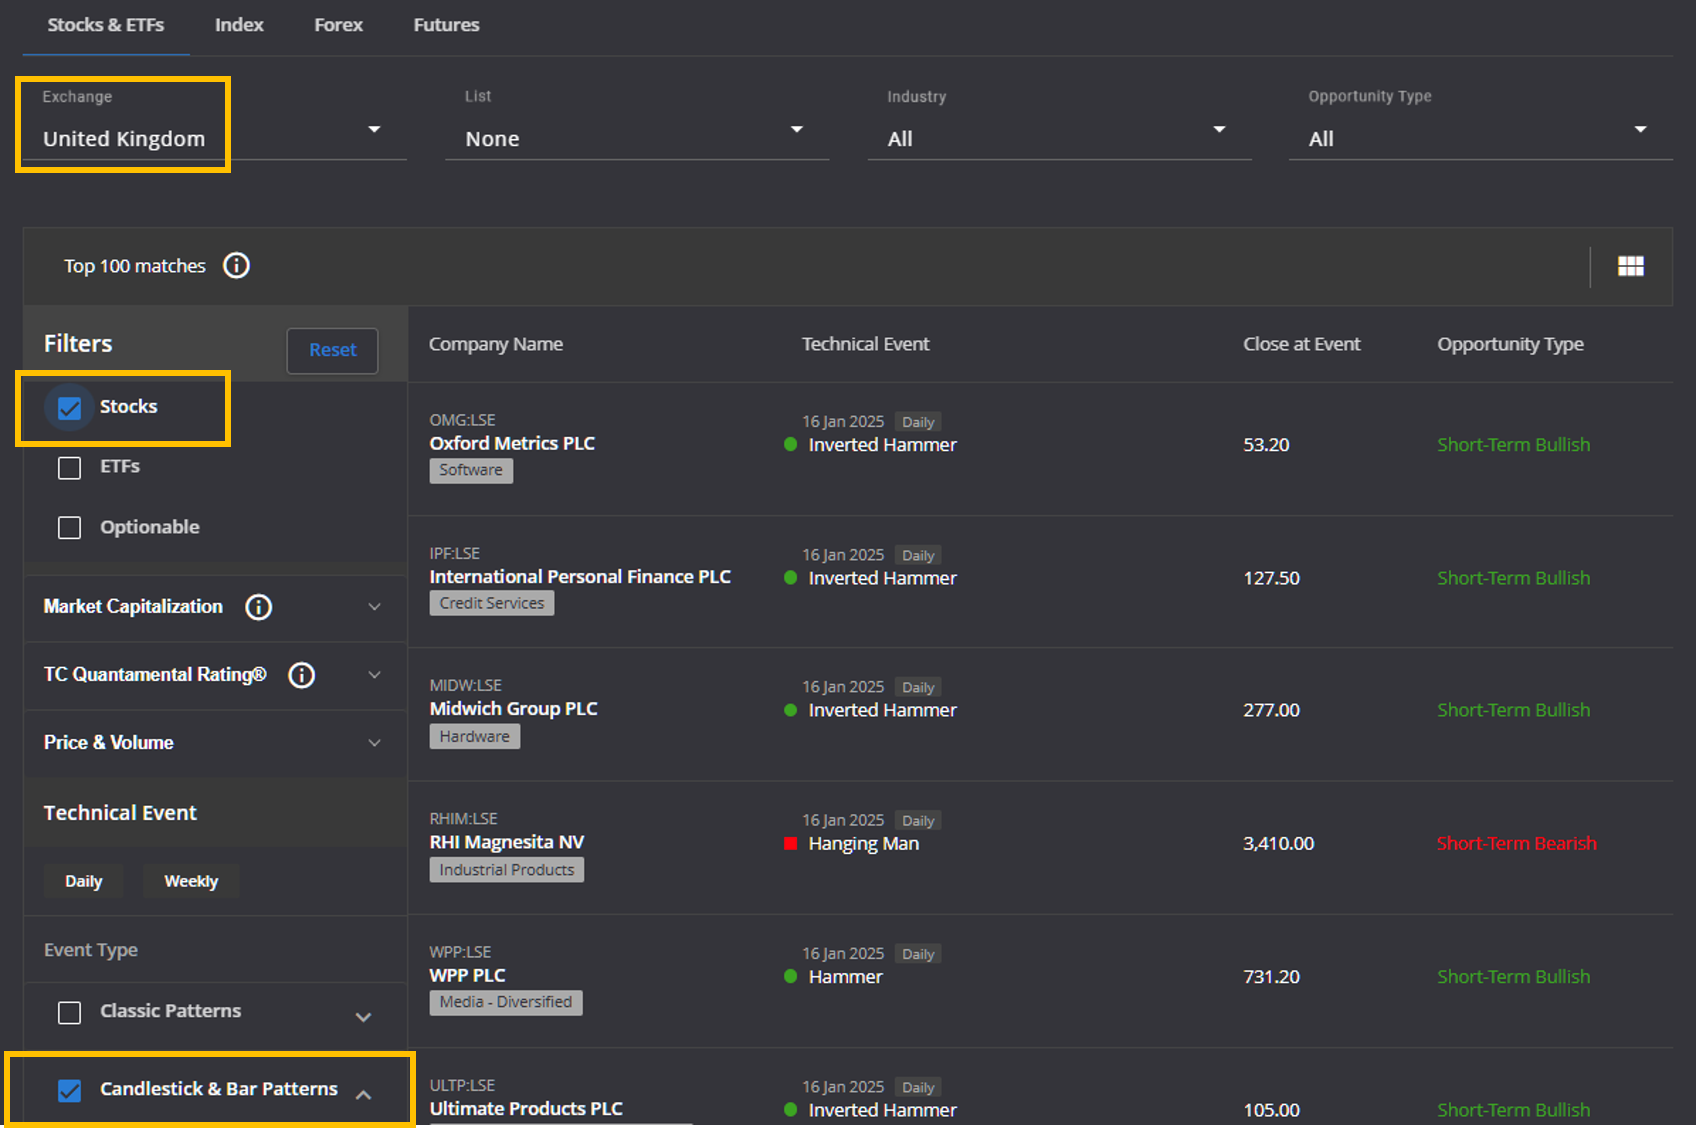
In the screenshot above, I have selected United Kingdom, Stocks, Candlestick & Bar Patterns. The algorithmic technology will then find all the UK stocks that are exhibiting different candlestick patterns, saving hours in research time.
If you click on any of the stocks, it will then provide further information regarding the different technical events and offer support and resistance levels.
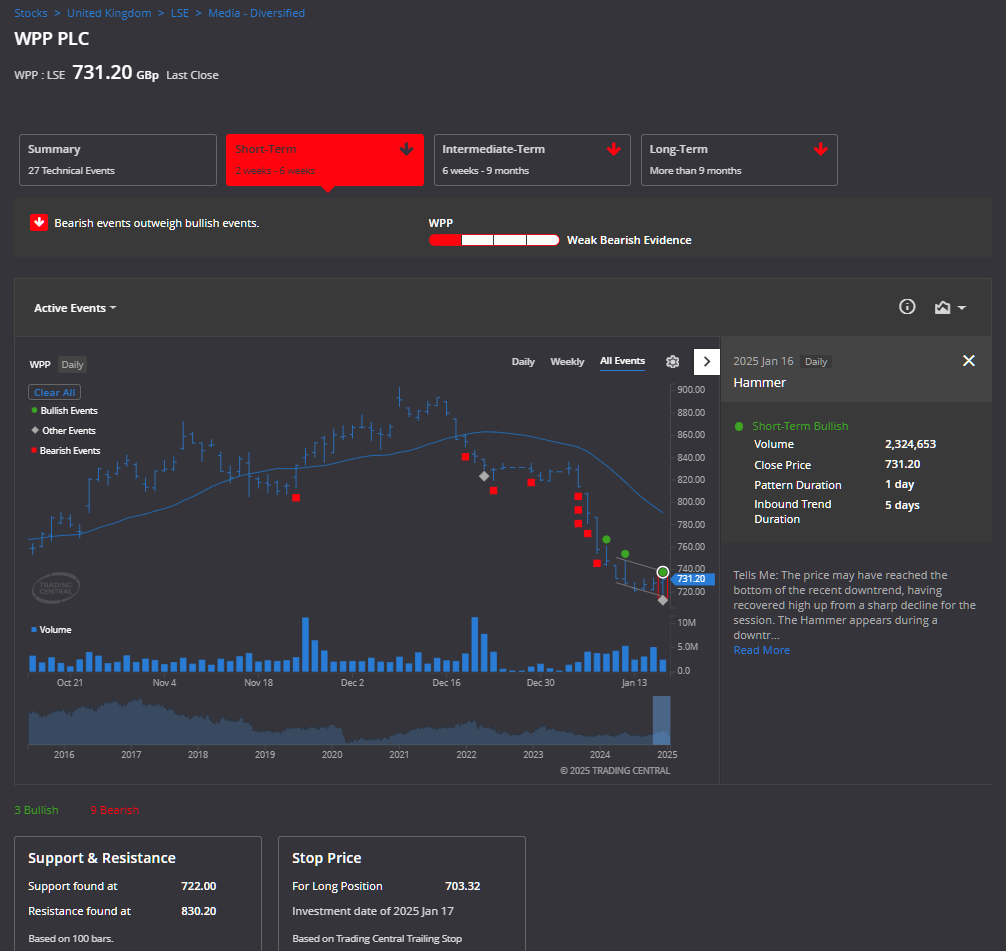
In the screenshot above, the screener highlights all the past technical events on the chart as well as current ones. It has highlighted another type of candlestick pattern called a hammer. It will also offer sentiment information, and price levels of support and resistance.
You can access this screener yourself by opening an Admirals Dashboard account in just a few steps.

Conclusion
The spinning top candlestick pattern offers unique insights into market behaviour and psychology. It's a candle that has a small body with a long upper and lower wick. It signifies a strong battle between buyers and sellers that ended neutral. These can be used to help identify trend exhaustion or confirm a more range-based market.
Combining spinning tops with other technical analysis indicators is more prudent to try and gain an edge in the market. It is proper risk management that helps to navigate the wins and losses.
The struggle for most traders is finding the time to identify candlestick patterns on the wealth of UK stocks, indices and currencies available. This is where the Admirals Premium Analytics Screener can be of use, as it will find all types of candlesticks across thousands of global stocks for you.
Open a trading account to experience the screener for yourself and trade from a free demo account to practice your skills in a virtual environment until you are ready to go live.

INFORMATION ABOUT ANALYTICAL MATERIALS:
The given data provides additional information regarding all analysis, estimates, prognosis, forecasts, market reviews, weekly outlooks or other similar assessments or information (hereinafter “Analysis”) published on the websites of Admirals' investment firms operating under the Admirals trademark (hereinafter “Admirals”). Before making any investment decisions, please pay close attention to the following:
1. This is a marketing communication. The content is published for informative purposes only and is in no way to be construed as investment advice or recommendation. It has not been prepared in accordance with legal requirements designed to promote the independence of investment research, and that it is not subject to any prohibition on dealing ahead of the dissemination of investment research.
2. Any investment decision is made by each client alone whereas Admirals shall not be responsible for any loss or damage arising from any such decision, whether or not based on the content.
3. With view to protecting the interests of our clients and the objectivity of the Analysis, Admirals has established relevant internal procedures for prevention and management of conflicts of interest.
4. The Analysis is prepared by an analyst (hereinafter “Author”). The Author, Jitanchandra Solanki, is an employee of Admirals. This content is a marketing communication and does not constitute independent financial research.
5. Whilst every reasonable effort is taken to ensure that all sources of the content are reliable and that all information is presented, as much as possible, in an understandable, timely, precise and complete manner, Admirals does not guarantee the accuracy or completeness of any information contained within the Analysis.
6. Any kind of past or modeled performance of financial instruments indicated within the content should not be construed as an express or implied promise, guarantee or implication by Admirals for any future performance. The value of the financial instrument may both increase and decrease, and the preservation of the asset value is not guaranteed.
7. Leveraged products (including contracts for difference) are speculative in nature and may result in losses or profit. Before you start trading, please ensure that you fully understand the risks involved.