Shorting the US100 Index to Hedge a Long Tech Stock Portfolio
While the recent stock market decline has created some interesting long-term investing opportunities, some investors have used it as an opportunity to hedge their stock portfolios.
Through products such as index CFDs (contracts for difference), you can speculate on a stock market index to rise or fall.
If it can be timed correctly, any potential profit from speculating on a continued fall in a stock market index can help to offset any losses in a long-stock portfolio which is the very reason CFDs were created by two investment bankers in London during the 1990s.
In this week's trade idea example, we go through how to trade the US100 stock market index to hedge a long tech-based stock portfolio. You can also use this concept as an example to trade other stock index CFDs based on the construction of your stock portfolio.
| Index CFD: | US100 Index CFD |
| Trade.MT4 / Trade.MT5 Symbol: | US100 |
| Date of Idea: | 31 January 2022 |
| Time Line: | 2 - 3 weeks |
| Entry Level: | 13,718.00 |
| Stop Loss Level: | 14,653.00 |
| Target Level: | 12,656.00 |
| Position Size for Trade.MT4 / Trade.MT5 Account: | Max 2% |
| Risk: | High |
- The Invest.MT5 account allows you to buy real stocks and shares from 15 of the largest stock exchanges in the world.
- The Trade.MT4 and Trade.MT5 accounts allow you to speculate on the price direction of stocks and stock market indices using CFDs. This means you can trade long and short to potentially profit from rising and falling prices. Learn more about CFDs in this How to Trade CFDs article.
All trading is high risk and you can lose more than you risk on a trade. Never invest more than you can afford to lose as some trades will lose and some trades will win. Start small to understand your own risk tolerance levels or practice on a demo account first to build your knowledge before investing.

What is Hedging?
Hedging is the method of lowering the overall drawdown in a portfolio by taking the opposite position of your holdings.
For example, if you have an Admirals Invest.MT5 account you may hold shares in technology companies such as Apple, Microsoft or Tesla. However, the recent stock market decline may have caused these investments to lose theoretical value.
Investors typically have three options:
- Sit through the drawdown and have a long term view that the share price will eventually move back up.
- Sell the positions and try to buy them back at better levels if the market continues to fall.
- Short sell the US100 index CFD so any potential profit from this trade can offset any fall in the value of the overall stock holdings.
Option number three is actually why CFDs were created by two investment bankers in the 1990s. However, it is worthwhile noting that it is much easier said than done. What happens if you get your timing wrong on your short index CFDs? Then you may open yourself up to losses in your stock portfolio AND from your short index CFD position.
This is why risk management is key. The aim is not to try and cover all of the loss in value in your long stock portfolio but to lower the overall drawdown by trying to profit from a continued fall in the stock market index, offsetting some of the fall in value of your stock portfolio.
Why Trade the US100 Index?
Some of the most popular stocks among investors are in the technology sector. These include stocks such as Apple, Amazon, Tesla, Facebook (now Meta), Microsoft, Alphabet and so on.
There have been times in the past few years that these six stocks accounted for almost half the value of the US100 index (an index of the largest 100 shares listed on the NASDAQ Exchange).
Therefore, if you are trying to hedge a portfolio of mainly technology stocks then the US100 stock market index is a good one to focus on.
In January, the index ended around 15% lower. The threat of rising interest rates - which makes borrowing costs for businesses more expensive - hurt the technology sector the most as they rely on growth.
With the Federal Reserve expected to increased interest rates five times this year, it’s likely the direction of the US100 index will be widely watched among traders and investors.
The index has broken the 55 WMA with the 144 WMA in sight
In the weekly chart of the US100 index CFD shown below, the price has spent the last two weeks under the 55-period weekly moving average (red line).
Historically, when the price has broken this moving average it has moved towards the 144-period weekly moving average (green line).
The 55-period and 144-period are based on the Fibonacci sequence which is often used by traders in technical analysis.
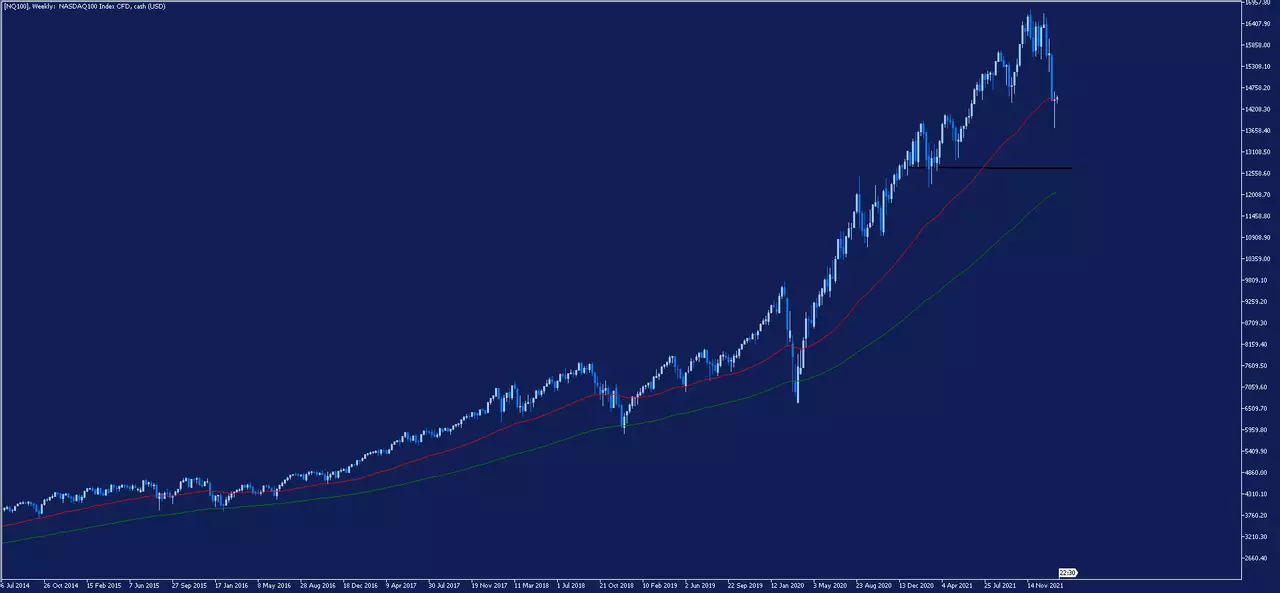
Source: Admirals MetaTrader 5, US100, Weekly - Data range: from 6 Jul 2014 to 31 Jan 2022, performed on 31 Jan 2022 at 7:00 am GMT. Please note: Past performance is not a reliable indicator of future results.
If the price does continue to fall then traders may be focused on the next major horizontal support level around 12,656.00 (shown by the black horizontal line) which is just above the 144-period weekly moving average.
There are a variety of different technical analysis tools traders will use to help in their decision-making process. You can learn more about technical indicators in the Admiral Forex Indicators library.
An Example Trading Idea for the US100 Index CFD
Based on the analysis above, an example trading idea for the US100 index CFD could be as follows:
- Short sell the index on a break of last week’s low (commencing 24 Jan 2022) at 13,718.00.
- Place a protective stop loss on a break of last week’s high at 14,653.00.
- Place a target at the next major level of support around 12,656.00.
- Keep your risk small at a maximum of 2% of your total account.
- Time Line = 2 – 3 weeks.
- If you traded with a position size of 0.1 lots, then:
- If your target is reached = $106.20 profit
- If your stop loss is reached = -$93.50 loss
It’s wise to remember that the share price is unlikely to go up in a straight line and it may even go much further down before it rises, especially considering the recent sell-off in global stock markets.
Therefore, be sure to exercise good risk management which is one of the most important aspects of trading successfully. You should always know how much you could potentially lose on a trade and the risks involved.
You can do this using the Admirals Trading Calculator for the Trade.MT4 account, as shown below:
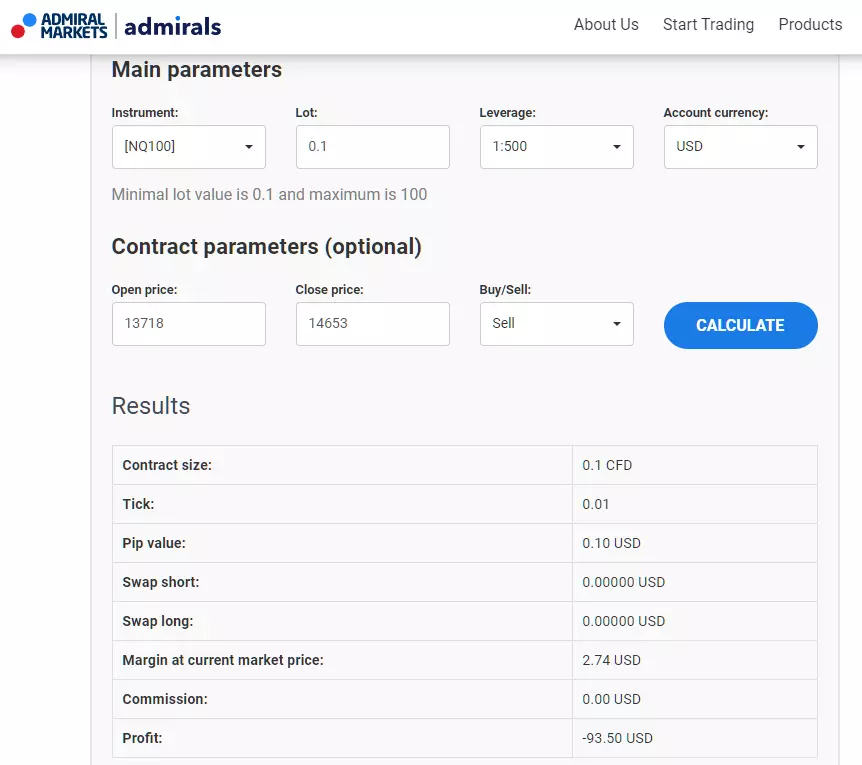
Source: Admirals Trading Calculator
Another factor to consider is the cost of trading CFDs. These include:
-
Spread. This is the difference between the buy price and the sell price of an instrument.
- The Admirals typical spread on the US100 index is just 1 point.
-
Commission. This is the cost to make a buy and sell transaction.
- From the Admirals Trade.MT4 account there are ZERO commissions to pay to buy or sell a stock index CFD.
-
Swaps. This is the overnight fee to roll your position over to the next day.
- The current swap fee for the US100 index CFD from the Trade.MT4 account is –0.00847 for long positions and –0.00819 for short positions.
You can find more details from the Admirals Contract Specification page.
How to Trade the US100 Index in 4 Steps
You can trade the US100 index CFD and other global stock market indices from the Trade.MT4 or Trade.MT5 accounts.
- Open an account with Admirals to access the Trader’s Room.
- Click on Trade on one of your live or demo accounts to open the web platform or download the MetaTrader 4 or MetaTrader 5 desktop platform.
- Search for US100 at the bottom of the Market Watch window and drag the symbol onto the chart.
- Use the one-click trading feature, or right-click and open a trading ticket to input your trade size, stop loss and take profit level.
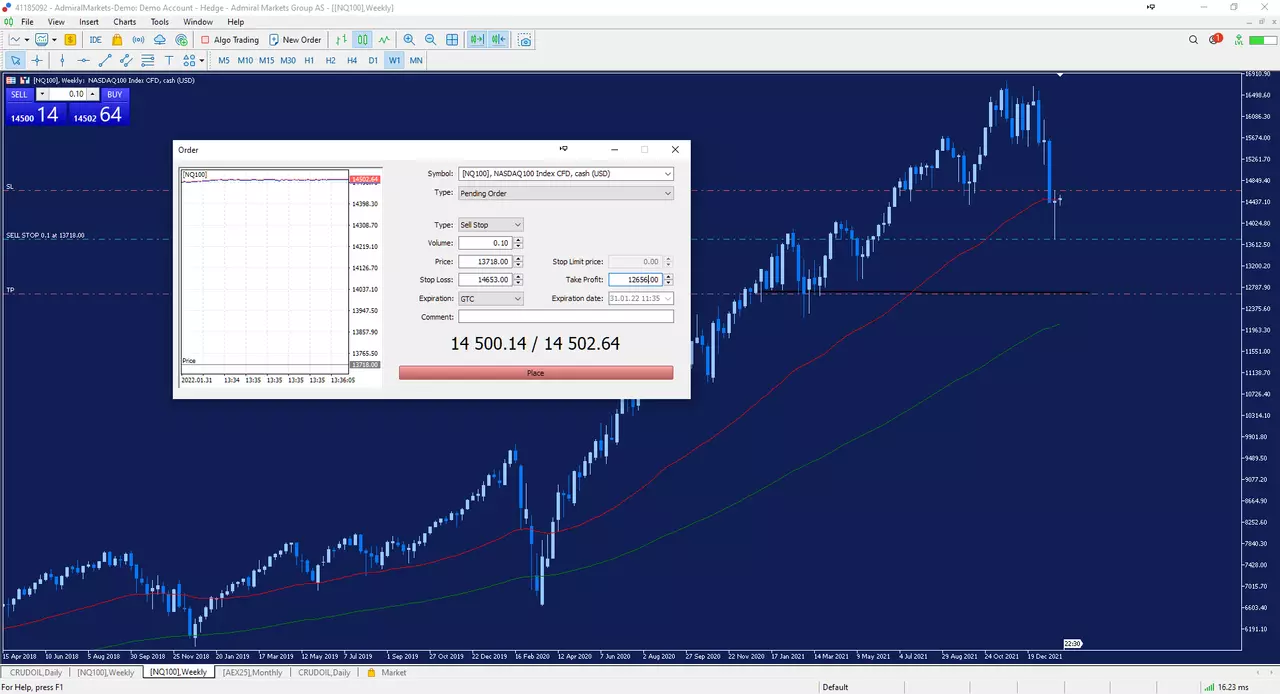
Source: Admirals MetaTrader 5 Desktop. Past performance is not a reliable indicator of future results, or future performance.
Click on the banner below to trade the US100 index today! ▼▼▼

Do You See the US100 Index Moving Differently?
Remember that all analytics and trading ideas are based on the personal view and experience of the author.
If you believe there is a higher chance the US100 index will move higher, then you can also trade long using CFDs.
The Trade.MT5 and Trade.MT4 account allows you to speculate on the price direction of stocks, indices and other asset classes using CFDs.
This means you can trade long and short to potentially profit from rising and falling prices. Learn more about CFDs in this How to Trade CFDs article.
INFORMATION ABOUT ANALYTICAL MATERIALS:
The given data provides additional information regarding all analysis, estimates, prognosis, forecasts, market reviews, weekly outlooks or other similar assessments or information (hereinafter “Analysis”) published on the websites of Admirals’ investment firms operating under the Admirals trademark (hereinafter “Admirals”) Before making any investment decisions please pay close attention to the following:
- This is a marketing communication. The content is published for informative purposes only and is in no way to be construed as investment advice or recommendation. It has not been prepared in accordance with legal requirements designed to promote the independence of investment research, and that it is not subject to any prohibition on dealing ahead of the dissemination of investment research.
- Any investment decision is made by each client alone whereas Admirals shall not be responsible for any loss or damage arising from any such decision, whether or not based on the content.
- With a view to protecting the interests of our clients and the objectivity of the Analysis, Admirals has established relevant internal procedures for the prevention and management of conflicts of interest.
- The Analysis is prepared by an independent analyst, Jitan Solanki (analyst), (hereinafter “Author”) based on their personal estimations.
- Whilst every reasonable effort is taken to ensure that all sources of the content are reliable and that all information is presented, as much as possible, in an understandable, timely, precise and complete manner, Admirals does not guarantee the accuracy or completeness of any information contained within the Analysis.
- Any kind of past or modelled performance of financial instruments indicated within the content should not be construed as an express or implied promise, guarantee or implication by Admirals for any future performance. The value of the financial instrument may both increase and decrease and the preservation of the asset value is not guaranteed.
- Leveraged products (including contracts for difference) are speculative in nature and may result in losses or profit. Before you start trading, please ensure that you fully understand the risks involved.

