Trading CADJPY From Technical Resistance and BOJ Volatility

At the end of last month, the Bank of Japan spent nearly $20 billion in an attempt to defend the falling yen. However, now the Japanese yen is trading near the levels it was before the central bank action.
In a statement at the beginning of October, Japan’s Finance Minister Shunichi Suzuki said they are ready to take decisive steps in the Forex market if excessive moves in the yen continue to persist.
This makes currency pairs such as CADJPY interesting as it currently trades at long-term technical resistance. Learn how to trade it here.
| Currency: | Canadian Dollar vs Japanese Yen |
| Symbol for Trade.MT4/Trade.MT5 Account: | CADJPY |
| Date of Idea: | 3 Oct 2022 |
| Time Line: | 1 - 4 weeks |
| Entry Level: | 104.50 |
| Stop Loss Level: | 110.55 |
| Target Level: | 98.45 |
| Position Size: | Max 1% |
| Risk: | High |
- The Trade.MT4 and Trade.MT5, as well as the Zero account types allow you to speculate on the price direction of currency pairs using CFDs. This means you can trade long and short to potentially profit from rising and falling prices. Learn more about CFDs in this How to Trade CFDs article.
All trading is high risk and you can lose more than you risk on a trade. Never invest more than you can afford to lose as some trades will lose and some trades will win. Start small to understand your own risk tolerance levels or practice on a demo account first to build your knowledge before investing.

Trading the CADJPY Currency Pair
The Bank of Japan has kept an ultra-loose monetary policy stance for many years. When the majority of the world’s central banks have been increasing interest rates, the Bank of Japan has – so far – still kept its interest rate at negative levels.
This has been one reason why the Japanese yen currency pairs have been surging higher with USDJPY trading at 24-year highs. The borrowing of the Japanese Yen at low interest rates to then invest in currencies with a high interest rate – known as the carry trade – has influenced the trend of the yen pairs this year, along with other factors.
The intervention from the Bank of Japan at the end of September was the first operation to buy the yen since 1998. Bank of America analysts have highlighted that the central bank has $1.3 trillion in foreign reserve assets meaning they could intervene again in the currency by selling some of its assets.
The Bank of Canada has moved in the opposite direction to the Bank of Japan and has increased interest rates aggressively this year. While the Bank of Canada has one of the highest interest rates among its peers at 3.25% the most recent statement hinted that the end of the tightening cycle could be soon, although another interest rate hike is expected at the next meeting.
CADJPY Technical Analysis Chart
The monthly price chart below is of CADJPY (Canadian dollar vs Japanese yen), taken from the MetaTrader 5 trading platform provided by Admirals. It shows that – in the long term – the currency pair is trading in a consolidation or range.
The price has been contained in between the upper horizontal resistance line at ~106.20 and the lower horizontal support line at ~73.20. Both of these price levels have had historical rejections several times since 2007.
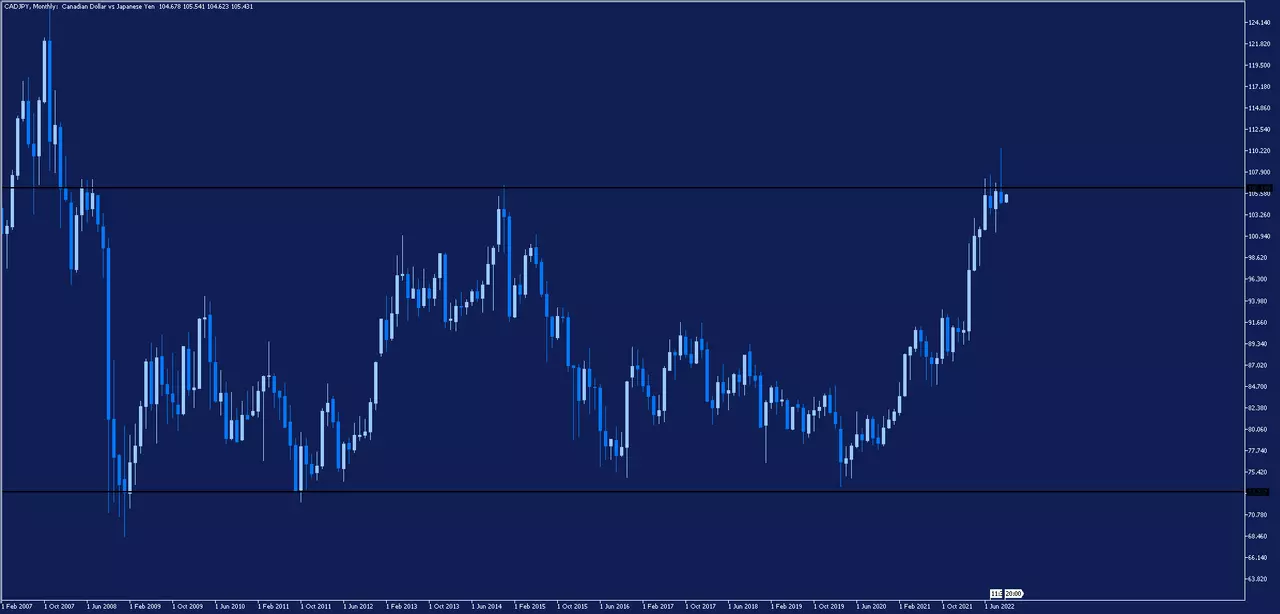
As the price is now trading at the top of the horizontal resistance line, technical analysis traders will be looking for clues if buyers have become exhausted allowing sellers to take control. These clues could use price action patterns or technical indicators.
Of course, the price may break through this horizontal resistance line if nothing changes from the fundamental side. In this case, technical analysis traders will be looking for clues if buyers are taking control after the breakout of the range.
An Example Trading Idea for CADJPY
Based on the analysis above an example trading idea for CADJPY could be as follows:
- Short sell CADJPY a few pips below the low of September’s monthly candle at 104.50.
- Place a protective stop loss on a break of the same monthly candle’s high at 110.55.
- Place a target of a 1:1 reward to risk at 98.45 (110.55 - 104.50 = 6.05, then 104.50 - 6.05 = 98.45).
- Keep your risk small at a maximum of 1% of your total account.
- Time Line = 1 – 4 weeks.
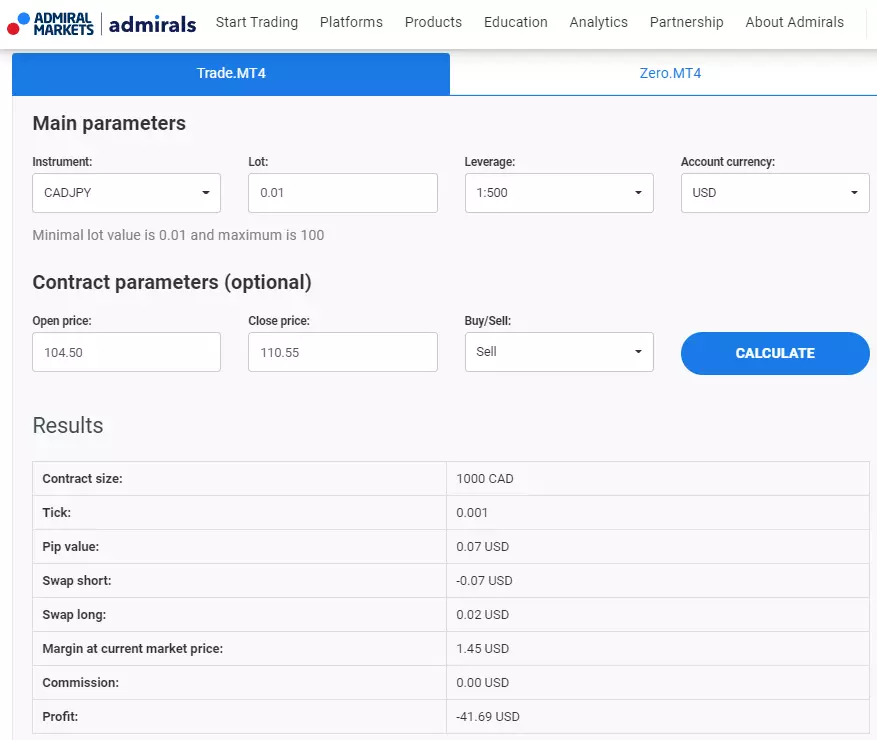
- If you traded with a position size of 0.01 lots (the lowest size) on a USD base account, then:
- If your target is reached = $41.69 profit
- If your stop loss is reached = -$41.69 loss
As the currency markets are extremely volatile right now, be sure to exercise good risk management which is one of the most important aspects of trading successfully. You should always know how much you could potentially lose on a trade and the risks involved.
You can do this using the Admirals Trading Calculator for the Trade.MT4 account, as shown below:
Another factor to consider is the cost of trading currency CFDs. These include:
- Spread. This is the difference between the buy price and the sell price of an instrument.
- The Trade.MT4/Trade.MT5 account typical spread on CADJPY is only 0.031.
- The Zero.MT4/Zero.MT5 account typical spread on CADJPY is only 0.016.
- Commission. This is the cost to make a buy and sell transaction.
- The Trade.MT4/Trade.MT5 account commission to buy or sell CADJPY is 0.
- The Zero.MT4/Zero.MT5 account commission to buy or sell CADJPY is only $3 per lot, per side.
- Swaps. This is the overnight fee to roll your position over to the next day.
- The current swap fee for CADJPY is –1.075 for short positions and 0.237 for long positions.
You can find more details regarding the fees and terms for each account type (commission-based and commission-free) from the Admirals Contract Specification page for CADJPY.
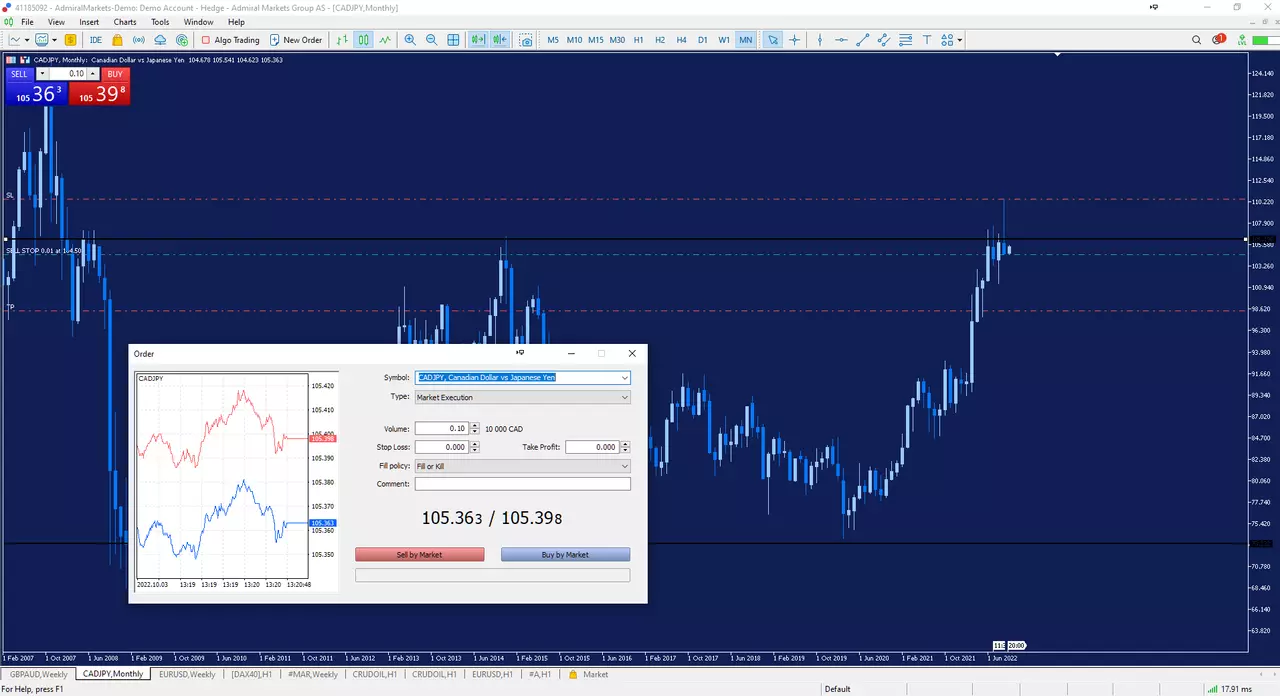
How to Trade CADJPY in 4 Steps
You can trade CADJPY using the four-step process below:
- Open an account with Admirals to access the Trader’s Room. This could be a demo account or a live account from Trade.MT5, Trade.MT4, Zero.MT5 or Zero.MT4.
- Click on Trade icon next to one of your live or demo trading accounts to open the web platform. Or download the MetaTrader 4 or MetaTrader 5 desktop platform which you can also upgrade to the Supreme Edition for free and access free technical analysis trading ideas from Trading Central.
- Search for CADJPY at the bottom of the Market Watch window and drag the symbol onto the chart.
- Use the one-click trading feature, or right-click and open a trading ticket to input your trade size, stop loss and take profit level.
Click on the banner below to trade CADJPY today! ▼▼▼

Do You See CADJPY Moving Differently?
Remember that all analytics and trading ideas are based on the personal view and experience of the author. If you believe there is a higher chance the CADJPY price will move in a different direction, then you can go long and short using CFDs (Contracts for Difference) from your Admirals trading account. Learn more about CFDs in this How to Trade CFDs article.
INFORMATION ABOUT ANALYTICAL MATERIALS:
The given data provides additional information regarding all analysis, estimates, prognosis, forecasts, market reviews, weekly outlooks or other similar assessments or information (hereinafter “Analysis”) published on the websites of Admirals’ investment firms operating under the Admirals trademark (hereinafter “Admirals”) Before making any investment decisions please pay close attention to the following:
- This is a marketing communication. The content is published for informative purposes only and is in no way to be construed as investment advice or recommendation. It has not been prepared in accordance with legal requirements designed to promote the independence of investment research, and that it is not subject to any prohibition on dealing ahead of the dissemination of investment research.
- Any investment decision is made by each client alone whereas Admirals shall not be responsible for any loss or damage arising from any such decision, whether or not based on the content.
- With a view to protecting the interests of our clients and the objectivity of the Analysis, Admirals has established relevant internal procedures for the prevention and management of conflicts of interest.
- The Analysis is prepared by an independent analyst, Jitanchandra Solanki (analyst), (hereinafter “Author”) based on their personal estimations.
- Whilst every reasonable effort is taken to ensure that all sources of the content are reliable and that all information is presented, as much as possible, in an understandable, timely, precise and complete manner, Admirals does not guarantee the accuracy or completeness of any information contained within the Analysis.
- Any kind of past or modelled performance of financial instruments indicated within the content should not be construed as an express or implied promise, guarantee or implication by Admirals for any future performance. The value of the financial instrument may both increase and decrease and the preservation of the asset value is not guaranteed.
- Leveraged products (including contracts for difference) are speculative in nature and may result in losses or profit. Before you start trading, please ensure that you fully understand the risks involved.

