Price Action Tricks: How To Trade 1-2-3 Patterns

The 1-2-3 pattern is one of the most popular trading patterns. Once you're experienced enough, you will be able to spot them all over the place. However, like any other pattern, it's not 100% reliable, but can be used as part of a trading strategy or trading system.
Let's step into the universe of price action trading!
What is a 1-2-3 Pattern?
We can say that it is the bottom, a correction, a re-test, and a rebound. The pattern usually occurs at the end of trends and swings, and they are an indication of a change in trend. They can also be found within a trading range, and they take place when the directional momentum of a trend is diminishing.
Uptrend:
- Point 1 is the lowest low point, forms a support level.
- Point 2 will be the peak, or the highest point, forms a resistance level.
- Point 3 will be the second low point, a support level (must be higher than point 1 which is the lowest low point.
- The price breakout above point 2 signals the continuation of the uptrend.
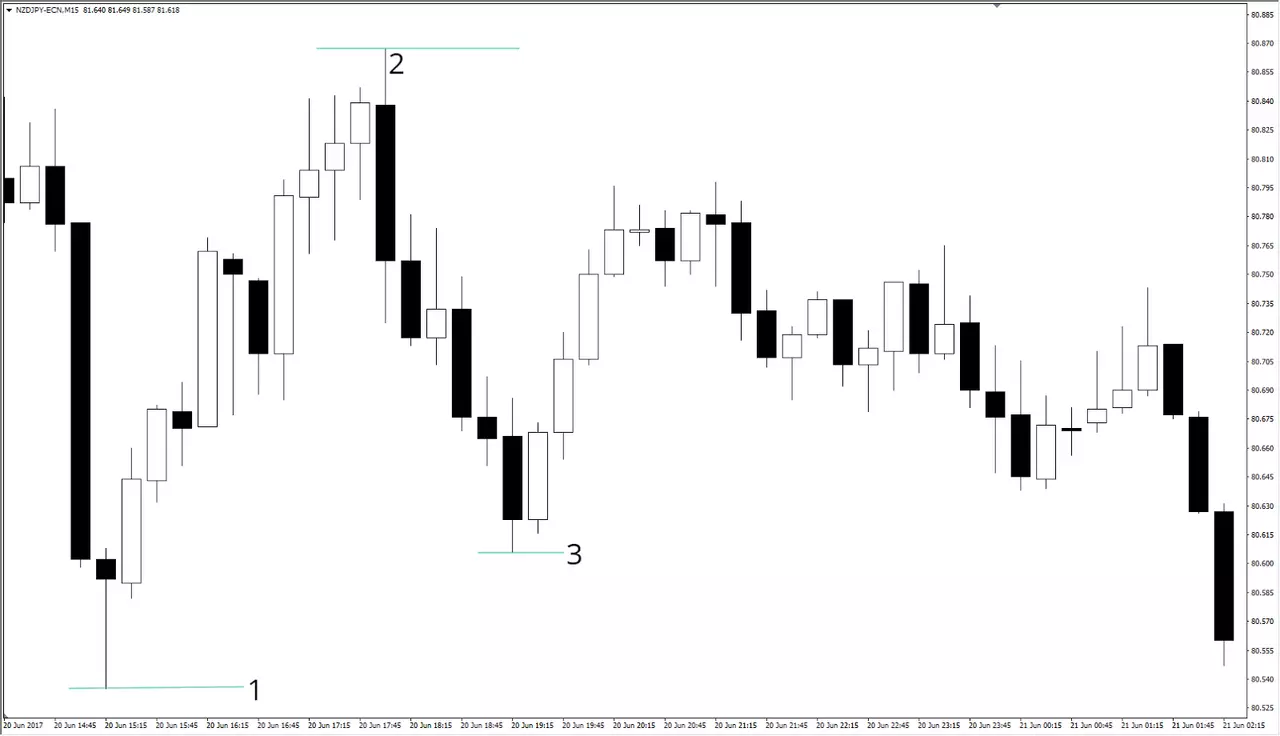
Source: NZD/JPY Chart, AM MT4, June 20, 15:15 Platform Time
Downtrend:
- Point 1 becomes the highest peak when price finds resistance and moves down.
- Point 2 becomes the lowest low point, forms support.
- Point 3 forms when the price moves up and forms a resistance.
- The price breakout below point 2 support level indicates that the market is most likely to continue going south in a downtrend.
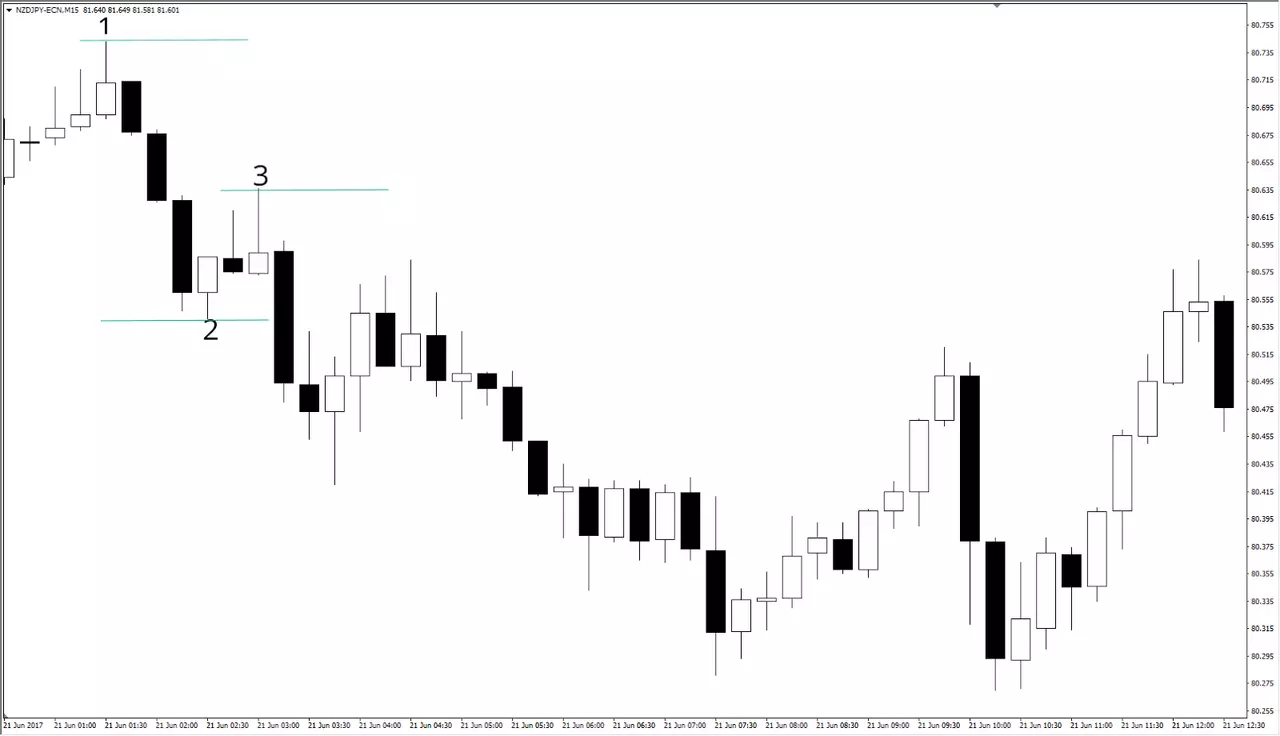
Source: NZD/JPY Chart, AM MT4, June 21, 01:30 Platform Time
1-2-3 patterns are also known as continuation patterns that represent breakouts of consolidated prices in the direction of the trend. They might also signal a reversal move, which we will discuss in the section below.
How to Trade 1-2-3 Patterns
Trend Continuation
First, you must consider the short-term trend and trading in this direction. We do not need to consider the long-term trend because we do not aim to trade it. The chart below shows the market swing. As this chart has been in an uptrend, the swing is shown from the low to the next high. To be on the right side of the shorter-term swings within a trend, traders need to observe the short-term trends.
Pro Tip: Consider every time frame when analysing the trade. For example, if you are trading the M15 chart, trade the current M15 chart trend, it doesn't matter what the daily chart is doing. This is critical, as every chart has its own trend. The H4 could be a completely different trend to the 15 minute chart. In the example below, we aim to trade from one swing to the next using the short-term trend to ensure we are on the right side of the next swing.
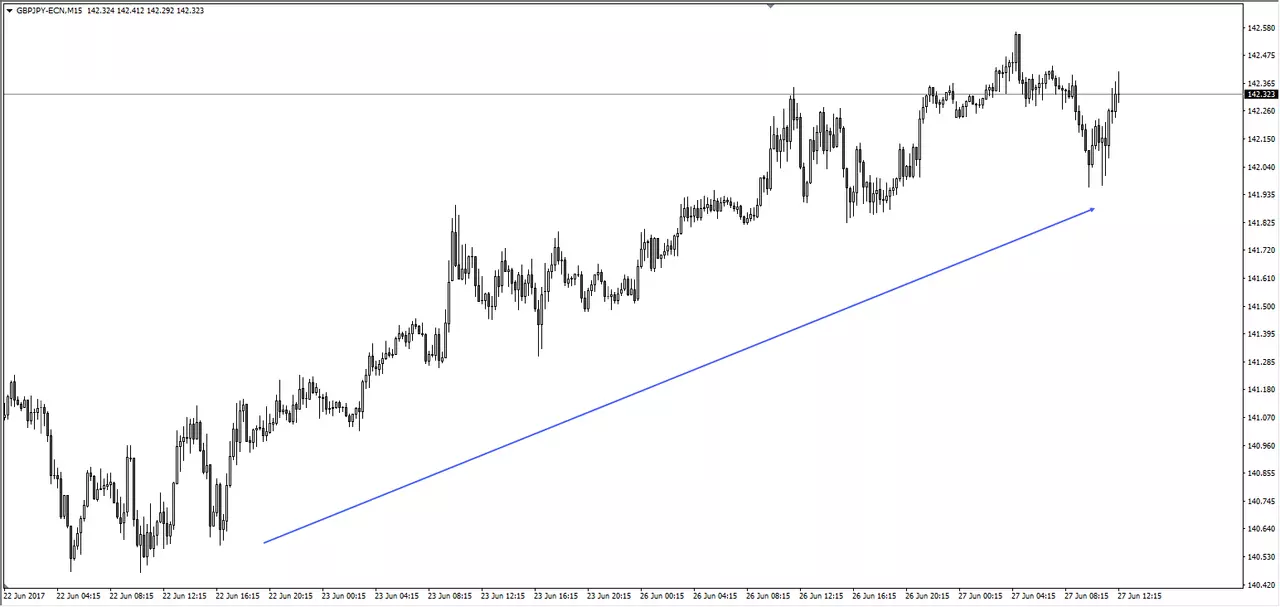
Source: GBP/JPY M15 Chart, AM MT4, June 27, 11:30 Platform Time
Trend Reversal
The first thing we must consider in the 1-2-3 pattern reversal is finding the first leg of the reversal. For example, if there is an uptrend, number 1 would be the first leg to the new lower low (LL). Number 2, or the second leg of the pattern, is when the price is retracing, but does not make a fresh high or low. Thus, in this uptrend example, the first leg is moving lower, and the second leg is moving the price back higher, but does not make a new high; hence, step two completes a new lower high (LH). If the price does to make a new high, the uptrend is still in play. For the last and final leg of the pattern, the price, again, moves lower, past the previous low that was made from the first leg and hence goes on to make a new lower low.
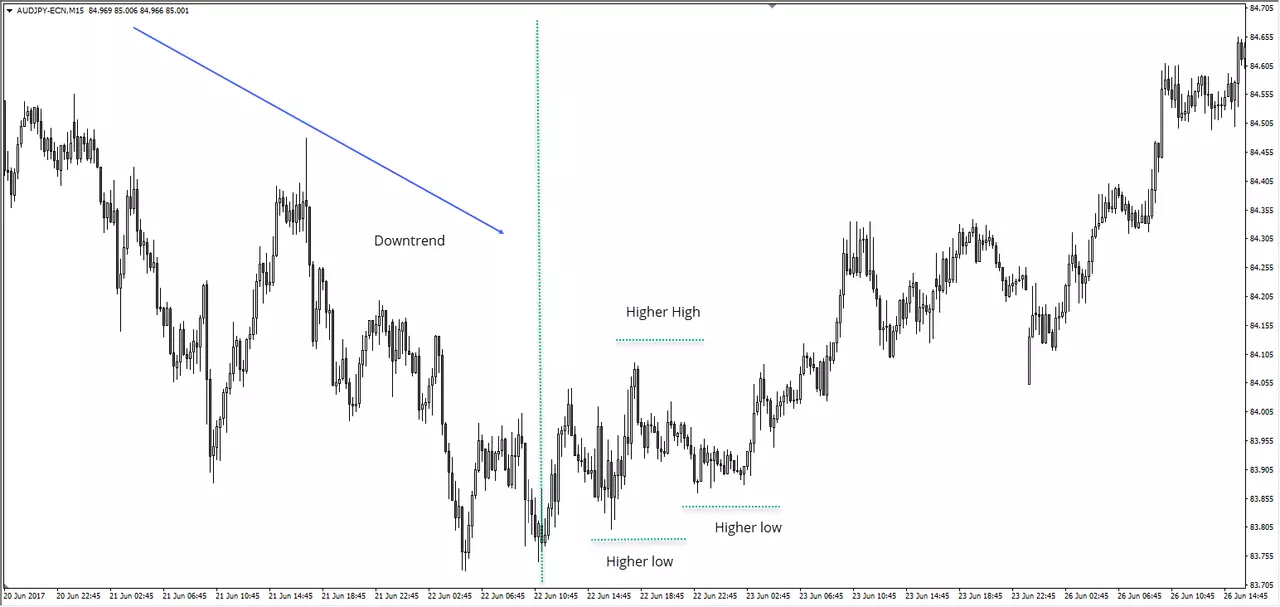
Source: AUD/JPY M15 Chart, AM MT4, June 22, 10:45 Platform Time
This example shows that the price was in an existing downtrend, and for the trend to change, we are looking for a 1-2-3 back higher. The first leg of this trend change is the price making a new higher low. The next step in this pattern is a price thrust and making of a new higher high. It is crucial for the price in this second step not to make a new lower low, which would otherwise confirm the fact that the trend will continue lower. The last leg of this pattern and also confirmation that the short-term trend has changed is leg 3, which is the price moving back lower again to make a new higher low.
1-2-3 Pattern Forex Indicator
To ensure a complete trading system, traders need more than just an indicator, namely, risk management, position sizing, timing, trading journals to evaluate progress, entry rules, exit rules, etc.
For this purpose, the official MQL5 website provides a free 1-2-3 indicator you might want to use to spot 1-2-3 patterns. Being a professional trader, I prefer to spot them myself.
Additionally, you should consider downloading MetaTrader 4 Supreme Edition that has tons of useful features, such as the Currency Strength Meter, that should provide you with an edge on 1-2-3 pattern trading.
Exercise: How to Draw 1-2-3 Manually
1-2-3 Patterns Within a Trend
- Open your MT4 Chart.
- Find a trend that is represented by Higher Highs-Higher Lows or Lower Highs-Lower Lows.
- Draw your 1-2-3 points as the price is moving in the direction of the new trend.
- Enter on the break of point 2 with a stop above/below point 3.
- Follow the market up or down, depending on the trend.
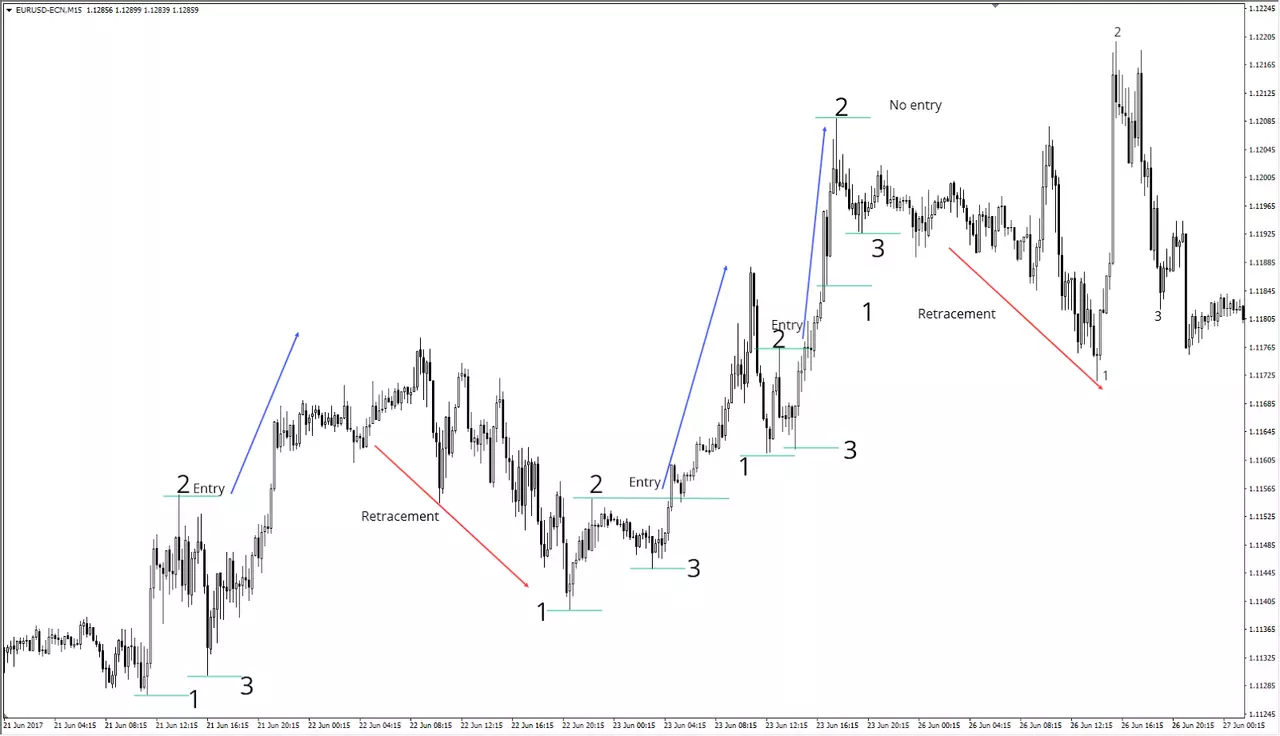
Source: EUR/USD M15 chart, AM MT4, 15:30 Platform Time
As you can see in the example above, the EUR/USD currency pair is showing an uptrend, so we only need to take 1-2-3 patterns in the direction of the trend (i.e., up). Retracements should be ignored. As we can see in the last 1-2-3 pattern example, there was no entry because point 2 hadn't been broken, and the retracement started just before the price moved further upside.
1-2-3 Patterns Within a Reversal
- Wait for a trend to end.
- It usually happens at the exhaustion as the price gets close to its extremes.
- Draw your 1-2-3 points as the price is moving in the direction of the new trend.
- Enter on the break of point 2 with a stop above/below point 3.
- Follow the market up or down, depending on the retracement or the new trend.
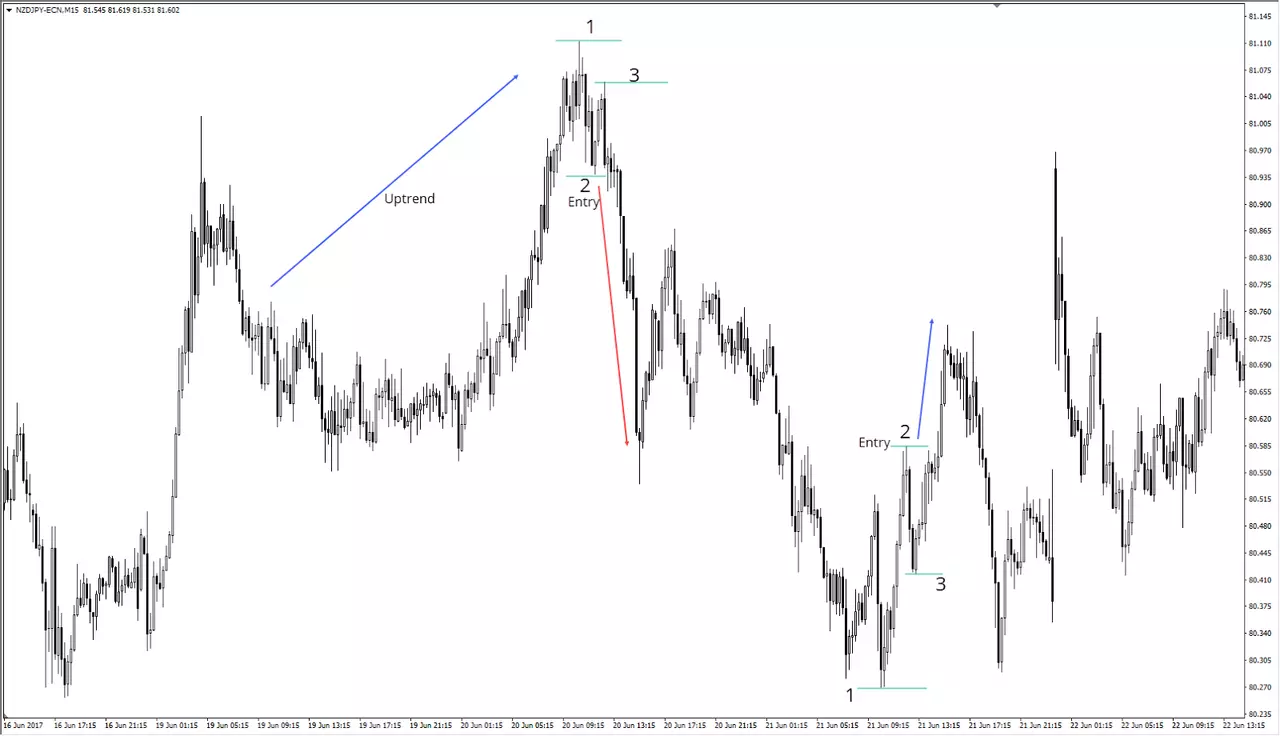
Source: NZD/JPY M15 chart, AM MT4, June 16, 21:15 Platform Time
Reversals happened at the top and the bottom as we can see from the chart above. If you are having trouble with identifying possible price extremes, I suggest using the ATR indicator or Bollinger Bands.
As we can see, 1-2-3 patterns can be applied to various Forex and CFD trading systems, but are mostly used in price action trading. Next time, we will talk about how to pick targets using 1-2-3 patterns.
Trade With Admiral Markets
If you're feeling inspired to start trading, or this article has provided some extra insight to your existing trading knowledge, you may be pleased to know that Admiral Markets provides the ability to trade with Forex and CFDs on up to 80+ currencies, with the latest market updates and technical analysis provided for FREE! Click the banner below to open your live account today!